- Table of Content
- 1.Far side solar...
- 2.ESWW2025 - cal...
- 3.Review of spac...
- 4.Noticeable Sol...
- 5.International ...
- 6.Geomagnetic Ob...
- 7.PROBA2 Observa...
- 8.The SIDC space...
- 9.Review of Iono...
- 10.Courses, semin...
2. ESWW2025 - call for abstracts and live space weather forecasts
3. Review of space weather
4. Noticeable Solar Events
5. International Sunspot Number by SILSO
6. Geomagnetic Observations in Belgium
7. PROBA2 Observations
8. The SIDC space weather briefing
9. Review of Ionospheric Activity
10. Courses, seminars, events
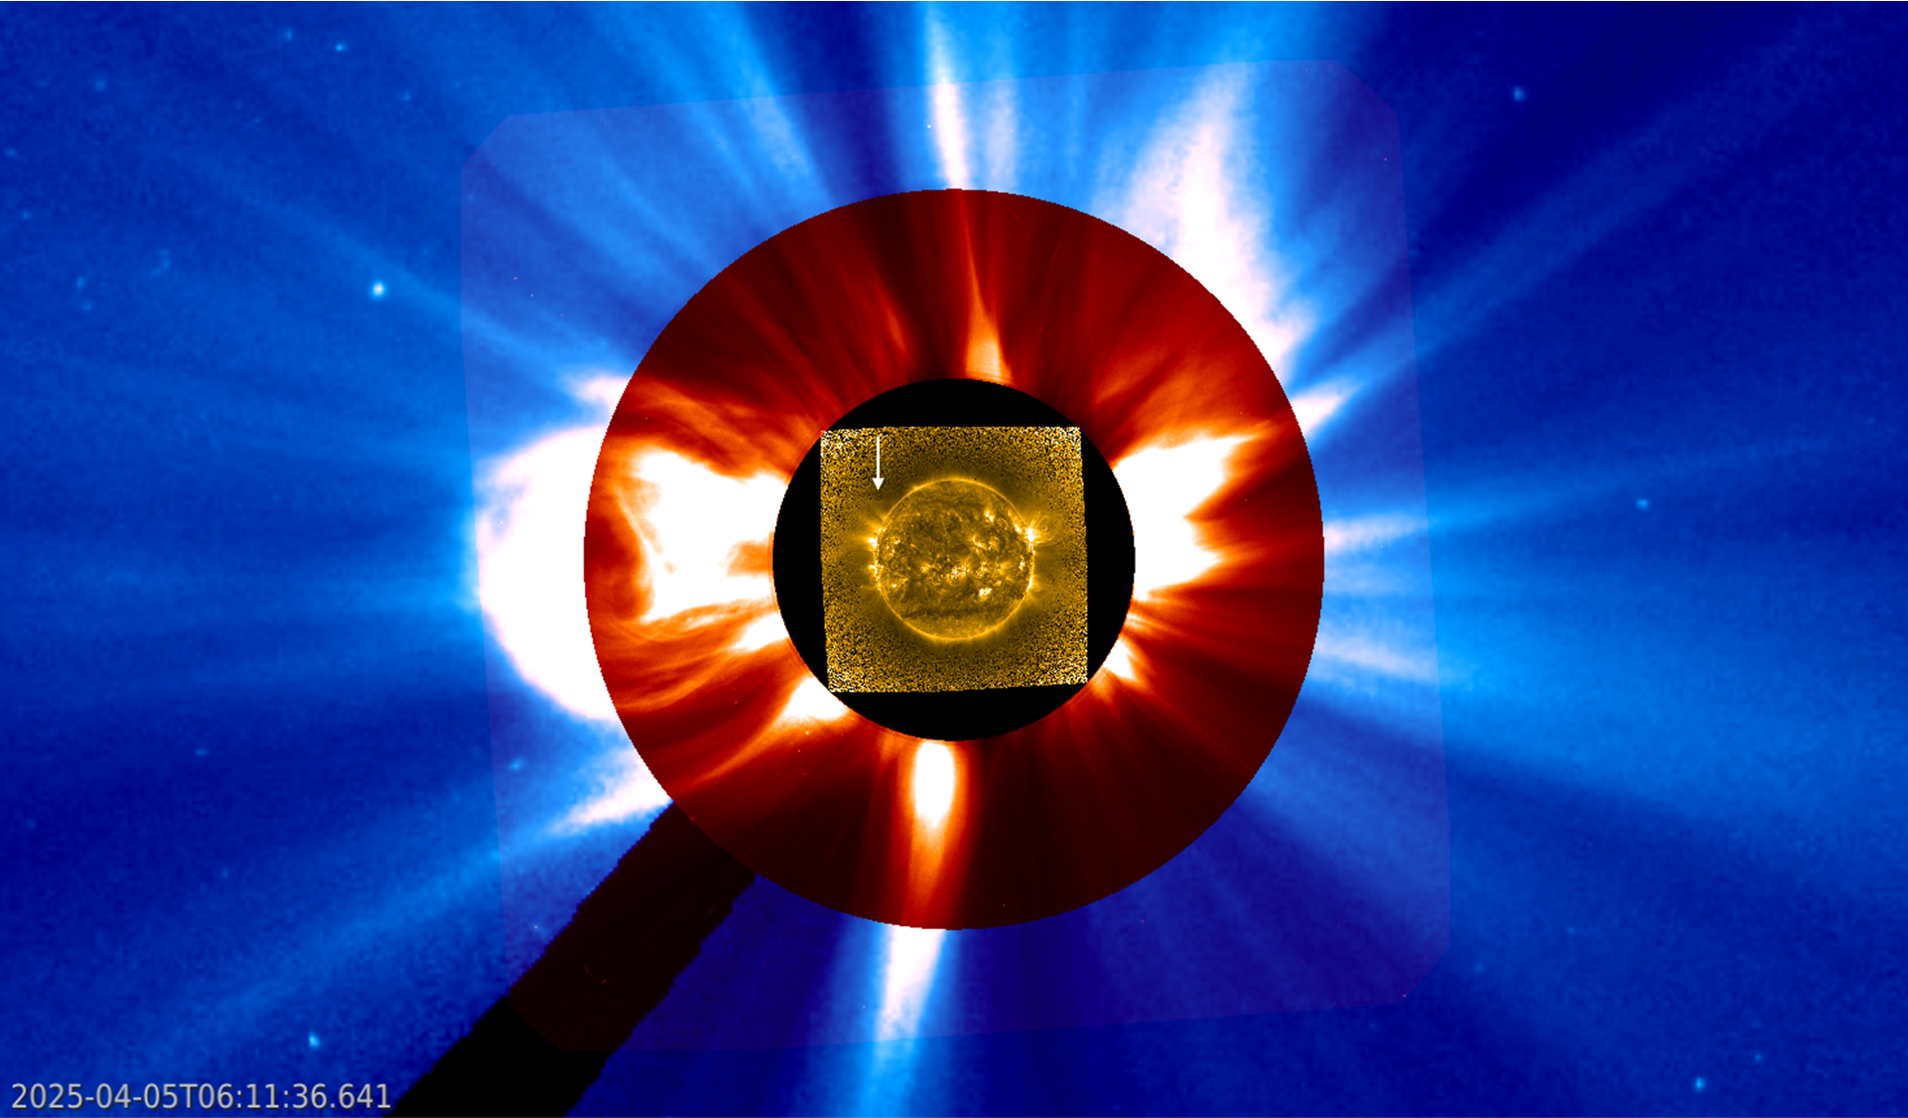
Far side solar eruptions
Coronagraphic images from SOHO revealed a partial halo coronal mass ejection (CME with a width greater than 120 degrees) leaving the Sun on 5 April. Closer examination by the SIDC space weather forecaster (https://www.sidc.be/ ) revealed this eruption had a far side origin, with no obvious signatures of the eruption on the Sun's earth-facing side. The SDO imagery underneath shows the Sun at temperatures of 700.000 degrees (AIA 171). Around 04:00UTC on 5 April, it shows a violent eruption in the solar outer atmosphere (the "corona") near its east limb, followed about an hour later by an apparently much slower eruption with -as seen from Earth- a horizontal, wide slab of plasma gradually moving northward starting from around 45 degrees north (see annotated image underneath). The post-eruption coronal loops appear about an hour later, from a location about halfway between the first eruption and the lift-off of the second eruption. Clips of the eruptions are available in the online version of this STCE newsitem at https://www.stce.be/news/760/welcome.html

That there are at least 2 CMEs at work seems also evident from the SOHO/LASCO coronagraphic imagery. The main CME is directed to the east and related to the first, rather violent eruption. It's becoming first visible at 04:12UTC in LASCO C2 imagery and has a plane-of-the-sky speed near 400 km/s. The second CME has a fuzzier outline and becomes visible around 08:00UTC. Related to the much slower eruption, it has a plane-of-the-sky speed near 250 km/s and is directed to the north-north-east. In the annotated imagery underneath, the wide-field EUV image obtained by PROBA2/SWAP has been overlaid on the coronagraphic images by SOHO/LASCO. SWAP's off-disk corona has been enhanced.
One of the possible scenarios is that the first, more violent eruption destabilized the magnetic environment of a filament, that subsequently got ejected into space. STEREO-A is preceding the Earth by 32 degrees, while Solar Orbiter was located - as seen from Earth- 12 degrees beyond the west limb, so there's basically a blanc area of 78 degrees in longitude that is not covered by any of the satellites capable of EUV-imaging, precisely the area of our current interest. Nonetheless, the first image available from Solar Orbiter for 5 April shows a plasma feature over the northwest limb -as seen from SolO- around 06:00UTC (upper image SolO/FSI 304, lower image SolO/FSI 174; both off-disk enhanced). This is very likely corresponding to the wide slab of plasma as observed by e.g. SDO and PROBA2 around that time. The first eruption took indeed place almost on the opposite side of the Sun as seen from SolO, and so most of the features seen around 06:00UTC are likely related to the second eruption. Note the different shapes of the feature are due to line-of-sight effects. As further SolO/EUI images become available in the coming days, it may become clearer what happened on the Sun's far side early on 5 April.

ESWW2025 - call for abstracts and live space weather forecasts
The European Space Weather Week is an annual space weather conference in Europe and is being organised since 2004. It has evolved to an event where the content is mainly defined by space weather stakeholders and the community.
Recently, the sessions have been defined and now, they are open for contributions.
During the week, space weather service centres are also invited to present their space weather forecast.
Info on how to submit an abstract for a contribution to a session or a live space weather forecast can be found on the website: https://esww.eu
List of the sessions
Parallel: Space Weather Research (SWR), Community-Driven (CD), Open (OPS), Application PipeLine (APL)
SWR1 - Magnetic sources of Space Weather Across Solar Atmospheric Layers. Conveners: Paolo PAGANO; Clementina SASSO; Ioannis KONTOGIANNIS; Hanna STRECKER
SWR2 - Interdisciplinary Insights into Space Weather Events of Solar Cycle 25: From Solar Origins to Planetary Impacts. Conveners: Karmen Martinic; Manuella Temmer; Guram Kervalishvili; Rute Santos
SWR3 - Inner Magnetospheric Dynamics and Coupling Processes. Conveners: Ravindra DESAI; Sarah Glauert; Adnane Osmane; Alex Lozinski
SWR4 - Interactions in the Earth's Magnetosphere-Ionosphere-Thermosphere System and their Space Weather Impact. Conveners: Daria KOTOVA; Lucilla ALFONSI; Guram KERVALISHVILI; Alan WOOD
SWR5 - Space Climate. Conveners: Claudio CORTI; Kalevi MURSULA; Barbara PERRI; Ilya USOSKIN
CD1 - Combination of physics-based and data-driven methods for space weather forecasting. Conveners: Sabrina GUASTAVINO; Dario DEL MORO; Filipa S. BARROS
CD2 - All about the solar wind. Conveners: Stephan G. HEINEMANN, Eleanna ASVESTARI
CD3 - Refining the Sunspot Number Series : challenges and benefits for the Space Climate Community. Conveners: Theodosios Chatzistergos, Laure Lefèvre, Ilya Usoskin
CD4 - Space Weather Impacts on Transportation Systems. Conveners: Cameron PATTERSON; Juliane HÜBERT; David BOTELER; Magnus WIK
CD5 - Open Validation in Space Weather Modeling. Conveners: Martin REISS; Barbara PERRI; Karin MUGLACH; Evangelia SAMARA
CD6 - Radiation for exploration beyond LEO. Conveners: Giovanni SANTIN; Aiko NAGAMATSU; Thomas BERGER
CD7 - Space weather at unmagnetized or weakly magnetized solar system objects. Conveners: Gabriella STENBERG WIESER; Sofia BERGMAN; Charlotte GOETZ
CD8 - The Vigil Mission: Advancing Space Weather Operations and Science. Conveners: Matthew West; Jeffrey Newmark; Steph Yardley; Hannah Schunker
CD9 - Communicating Science Through Aurora: Engaging the Public in Space Weather. Conveners: Lenka ZYCHOVA; Christine VERBEKE; Laure LEFEVRE
OPS - Open parallel session. Conveners: Adur Pastor Yabar, Kseniia Golubenko, David Themens, Anna Morozova
APL1 - Space Weather Services and Alerts for End-Users: Bridging Forecasting, Infrastructure, and Communication. Conveners: Judith DE PATOUL; Francois-Xavier BOCQUET; Mpho TSHISAPHUNGO; Kasper VAN DAM
APL2 - Bridging the Gap: Reproducibility, Deployment, Operation, Updates, and Monitoring of Machine Learning-Based Solar Flare Forecast Models. Conveners: Shane Maloney; Sophie Murray; Paul Wright; Anna Massone
Plenary (P)
P1 - Space Weather Challenges in the Arctic: A Round Table Discussion. Conveners: Magnus Wik; Andrew Dimmock
P2 - Space Weather at the Moon, Mars, and Beyond: Recent Advancements, Observations, and Future Opportunities for Exploration. Conveners: Gina DIBRACCIO; Beatriz SANCHEZ-CANO; Fabrice CIPRIANI
Review of space weather
Solar Active Regions (ARs) and flares
Solar flaring activity went from high, moderate, low and picked up again to moderate by the end of the week.
Fifteen numbered active regions were observed on the visible solar disk. SIDC Sunspot Group 461 (NOAA Active Region 4048) was the largest and most complex region. It had first a beta-gamma-delta configuration and simplified to beta-gamma. This region was the primary driver of the flaring activity and produced eight out of the nine M-class flares this week. The largest flare from this region was an M2.5 flare (SIDC Flare 4005), peaking at 22:31 UTC on April 1. The largest flare overall was an M5.6 flare (SIDC Flare 3994), peaking at 06:46 UTC on April 1, and was associated with SIDC Sunspot Group 459 (NOAA Active Region 4046; beta-gamma).
Coronal mass ejections
No Earth-directed coronal mass ejections (CMEs) were detected in the available coronagraph images.
Coronal Holes
A returning low-latitude negative polarity coronal hole (SIDC Coronal Hole 99) began to cross the central meridian on April 01. The associated high-speed stream arrived at Earth late on April 03.
Proton flux levels
The greater than 10 MeV GOES proton flux exceeded the 10 pfu threshold early in the week, reaching a maximum of 147 pfu as measured by GOES-18 at 04:25 UTC on April 1.
The proton flux decreased below the 10 pfu threshold by 08:30 UTC on April 2, remaining slightly elevated for the rest of the week.
Electron fluxes at GEO
The greater than 2-MeV electron flux, as measured by the GOES-18 satellite, exceeded the 1000 pfu threshold on multiple occasions at the start and the end of the week.
The 24-hour electron fluence remained normal to moderate.
Solar wind
At the beginning of the week, solar wind parameters reflected the arrival of two interplanetary coronal mass ejections (ICMEs). The first ICME arrived at 10:16 UTC on March 31, marked by a sudden increase in solar wind speed (from about 420 km/s to 445 km/s) and a jump in the interplanetary magnetic field from 8 nT to 11 nT. The second ICME arrived at 17:29 UTC on April 1, causing further enhancements in the magnetic field and solar wind parameters. These ICMEs are possibly associated with CMEs that lifted off the Sun on March 28 at 15:24 UTC and March 27 at 04:23 UTC, respectively.
Solar wind parameters became slightly disturbed again from late on April 3, due to the arrival of a high-speed stream from a negative polarity coronal hole (SIDC Coronal Hole 99). The interplanetary magnetic field reached values up to 15 nT, and the solar wind speed increased to values about 750 km/s. The southward component of the interplanetary magnetic field fluctuated between -11 nT and +10 nT. Solar wind conditions remained slightly elevated through the end of the week under the continued influence of the high-speed stream.
Geomagnetism
At the start of the week, geomagnetic conditions were quiet to unsettled both globally and locally over Belgium. Active levels were reached globally (NOAA Kp: 4;4+) on April 2-3, likely due to an ICME arrival. Late on April 3, minor storm periods were observed both globally and locally (NOAA Kp: 5-; K-Bel: 5), associated with the onset of a high-speed stream. On April 5, conditions briefly reached moderate storm levels globally (Kp: 6-), while minor storm levels (K-Bel: 5) were observed locally.
Noticeable Solar Events
| DAY | BEGIN | MAX | END | LOC | XRAY | OP | 10CM | TYPE | Cat | NOAA |
| 31 | 1016 | 1024 | 1037 | M1.2 | 4048 | |||||
| 01 | 0637 | 0646 | 0653 | M5.6 | 4046 | |||||
| 01 | 2218 | 2231 | 2241 | M2.5 | 4048 | |||||
| 05 | 1954 | 2005 | 2012 | M1.0 | 19 | 4048 |
| LOC: approximate heliographic location | TYPE: radio burst type |
| XRAY: X-ray flare class | Cat: Catania sunspot group number |
| OP: optical flare class | NOAA: NOAA active region number |
| 10CM: peak 10 cm radio flux |
International Sunspot Number by SILSO
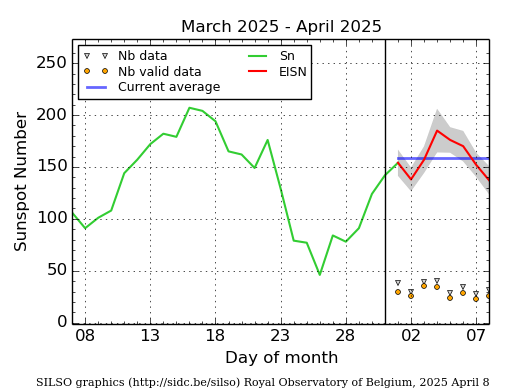
The daily Estimated International Sunspot Number (EISN, red curve with shaded error) derived by a simplified method from real-time data from the worldwide SILSO network. It extends the official Sunspot Number from the full processing of the preceding month (green line), a few days more than one solar rotation. The horizontal blue line shows the current monthly average. The yellow dots give the number of stations that provided valid data. Valid data are used to calculate the EISN. The triangle gives the number of stations providing data. When a triangle and a yellow dot coincide, it means that all the data is used to calculate the EISN of that day.
Geomagnetic Observations in Belgium
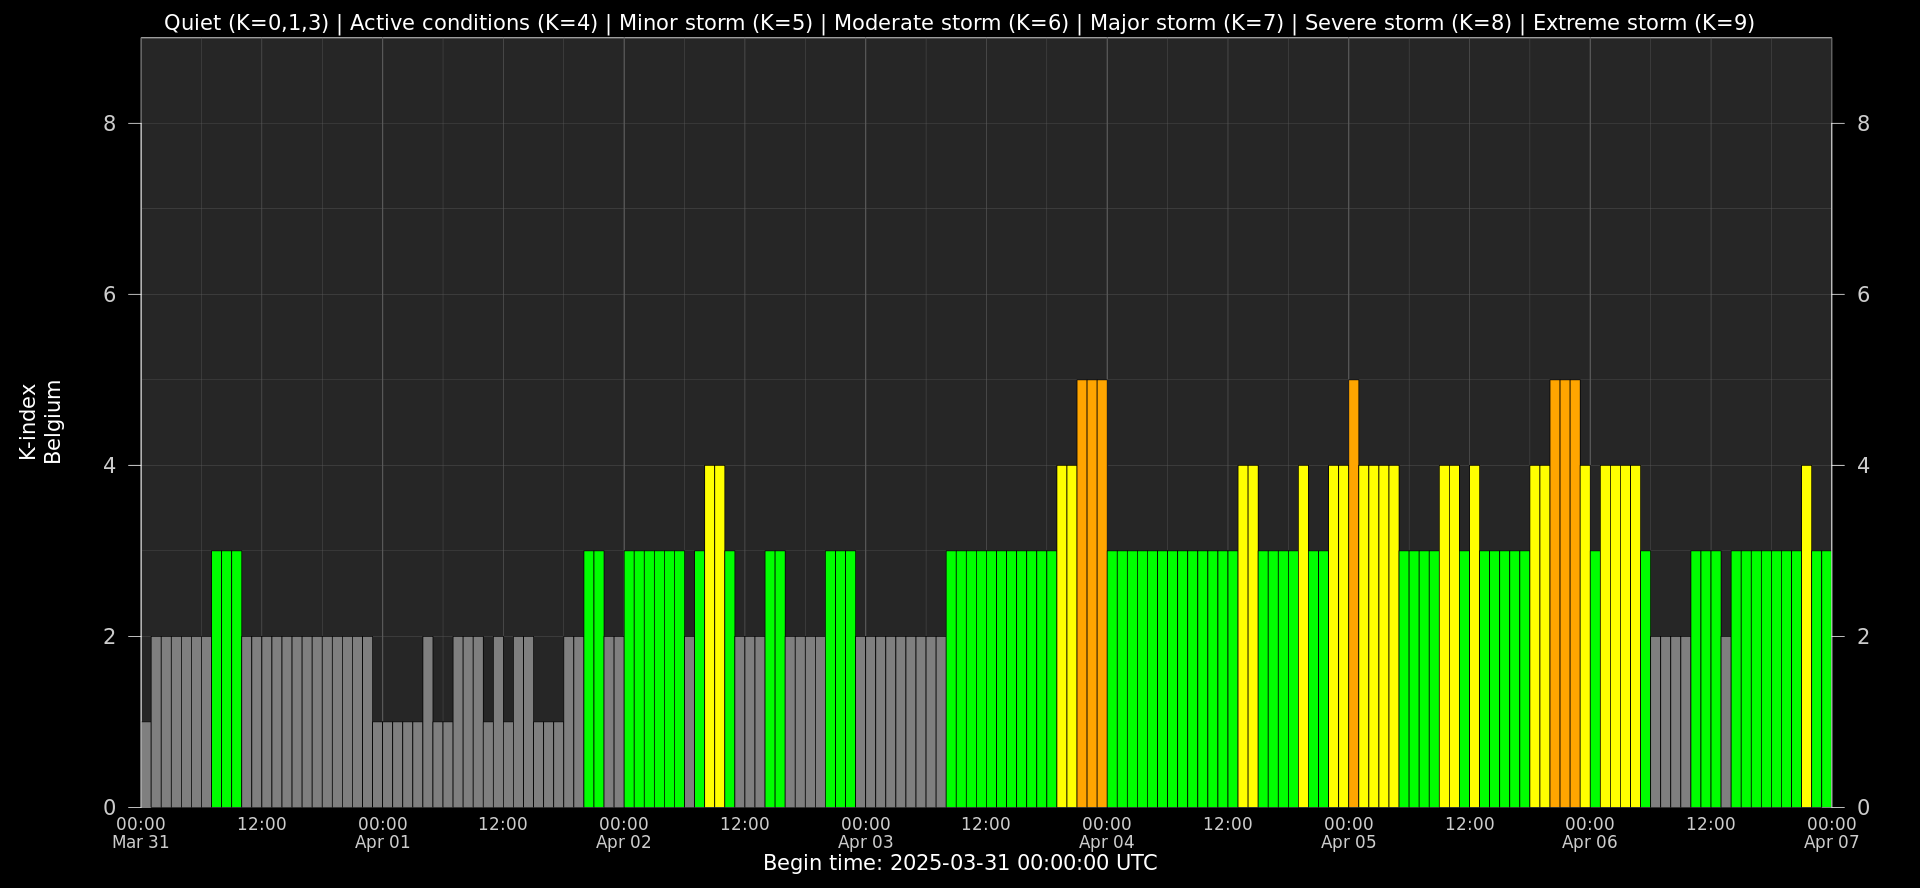
Local K-type magnetic activity index for Belgium based on data from Dourbes (DOU) and Manhay (MAB). Comparing the data from both measurement stations allows to reliably remove outliers from the magnetic data. At the same time the operational service availability is improved: whenever data from one observatory is not available, the single-station index obtained from the other can be used as a fallback system.
Both the two-station index and the single station indices are available here: http://ionosphere.meteo.be/geomagnetism/K_BEL/
PROBA2 Observations
Solar Activity
Solar flare activity fluctuated from low to moderate during the week.
In order to view the activity of this week in more detail, we suggest to go to the following website from which all the daily (normal and difference) movies can be accessed: https://proba2.oma.be/ssa
This page also lists the recorded flaring events.
A weekly overview movie can be found here (SWAP week 784). http://proba2.oma.be/swap/data/mpg/movies/weekly_movies/weekly_movie_2025_03_31.mp4
Details about some of this week's events can be found further below.
If any of the linked movies are unavailable they can be found in the P2SC movie repository here https://proba2.sidc.be/swap/data/mpg/movies/
Tuesday Apr 01
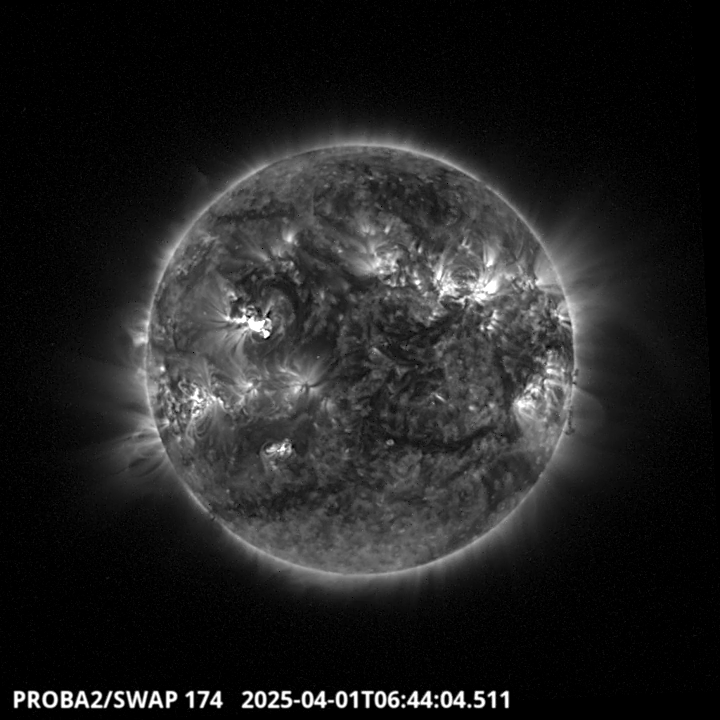
The largest flare of the week, a M5.6 peaking around 6:44 UT, has been produced by the active
region NOAA 4046 located on the North-East part of the solar disk. Find a SWAP movie of the event here. https://proba2.sidc.be/swap/movies/20250401_swap_movie.mp4
The SIDC space weather briefing
The forecaster on duty presented the SIDC briefing that gives an overview of space weather from March 30 to April 6 .
The pdf of the presentation: https://www.stce.be/briefings/20250407_SWbriefing.pdf
Review of Ionospheric Activity
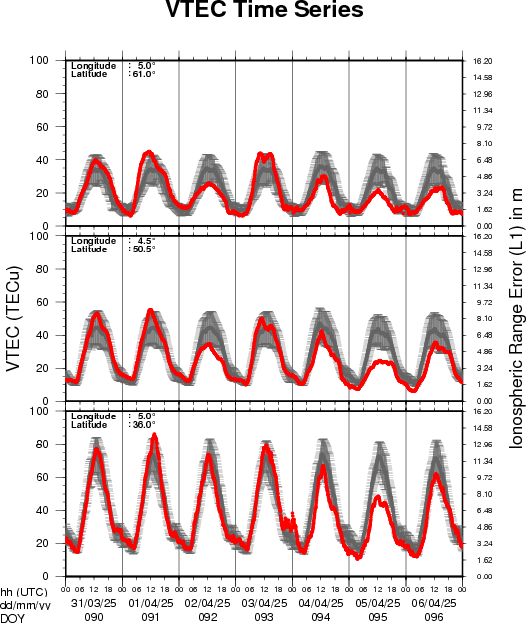

VTEC time series at 3 locations in Europe from 31 Mar 2025 till 6 Apr 2025
The top figure shows the time evolution of the Vertical Total Electron Content (VTEC) (in red) during the last week at three locations:
a) in the northern part of Europe(N 61deg E 5deg)
b) above Brussels(N 50.5deg, E 4.5 deg)
c) in the southern part of Europe(N 36 deg, E 5deg)
This top figure also shows (in grey) the normal ionospheric behaviour expected based on the median VTEC from the 15 previous days.
The time series below shows the VTEC difference (in green) and relative difference (in blue) with respect to the median of the last 15 days in the North, Mid (above Brussels) and South of Europe. It thus illustrates the VTEC deviation from normal quiet behaviour.
The VTEC is expressed in TECu (with TECu=10^16 electrons per square meter) and is directly related to the signal propagation delay due to the ionosphere (in figure: delay on GPS L1 frequency).
The Sun's radiation ionizes the Earth's upper atmosphere, the ionosphere, located from about 60km to 1000km above the Earth's surface.The ionization process in the ionosphere produces ions and free electrons. These electrons perturb the propagation of the GNSS (Global Navigation Satellite System) signals by inducing a so-called ionospheric delay.
See http://stce.be/newsletter/GNSS_final.pdf for some more explanations; for more information, see https://gnss.be/SpaceWeather
Courses, seminars, events
Courses, seminars, presentations and events with the Sun-Space-Earth system and Space Weather as the main theme. We provide occasions to get submerged in our world through educational, informative and instructive activities.
* April 28-30, 2025, STCE Space Weather Introductory Course, Brussels, Belgium - register: https://events.spacepole.be/event/214/
* May 26-27, 2025, STCE Course Space Weather impacts on aviation, online - register: https://events.spacepole.be/event/215/
* Jun 7-9, STCE stand: Dichtbij de Zon, Nerdland Festival, Wachtebeke, Belgium, https://www.nerdlandfestival.be/nl/
* Jun 20, 2025, STCE seminar: The Vigil mission to L5
* Jun 23-25, 2025, STCE Space Weather Introductory Course, Brussels, Belgium - register: https://events.spacepole.be/event/216/
* Sep 15-16, 2025, STCE Course Space Weather impacts on aviation, online - register: https://events.spacepole.be/event/218/
* Nov 17-19, 2025, STCE Space Weather Introductory Course, Brussels, Belgium - register: https://events.spacepole.be/event/217/
To register for a course and check the seminar details, navigate to the STCE Space Weather Education Center: https://www.stce.be/SWEC
If you want your event in the STCE newsletter, contact us: stce_coordination at stce.be

Website: https://www.stce.be/SWEC