- Table of Content
- 1.5 years of EUI...
- 2.Submit an abst...
- 3.JSWSC is seeki...
- 4.Review of sola...
- 5.International ...
- 6.PROBA2 Observa...
- 7.Noticeable Sol...
- 8.Geomagnetic Ob...
- 9.Review of Iono...
- 10.The SIDC Space...
- 11.Upcoming Activ...
2. Submit an abstract to an ESWW 2025 session now!
3. JSWSC is seeking a new Editor-in-Chief
4. Review of solar and geomagnetic activity
5. International Sunspot Number by SILSO
6. PROBA2 Observations
7. Noticeable Solar Events
8. Geomagnetic Observations in Belgium
9. Review of Ionospheric Activity
10. The SIDC Space Weather Briefing
11. Upcoming Activities at the STCE
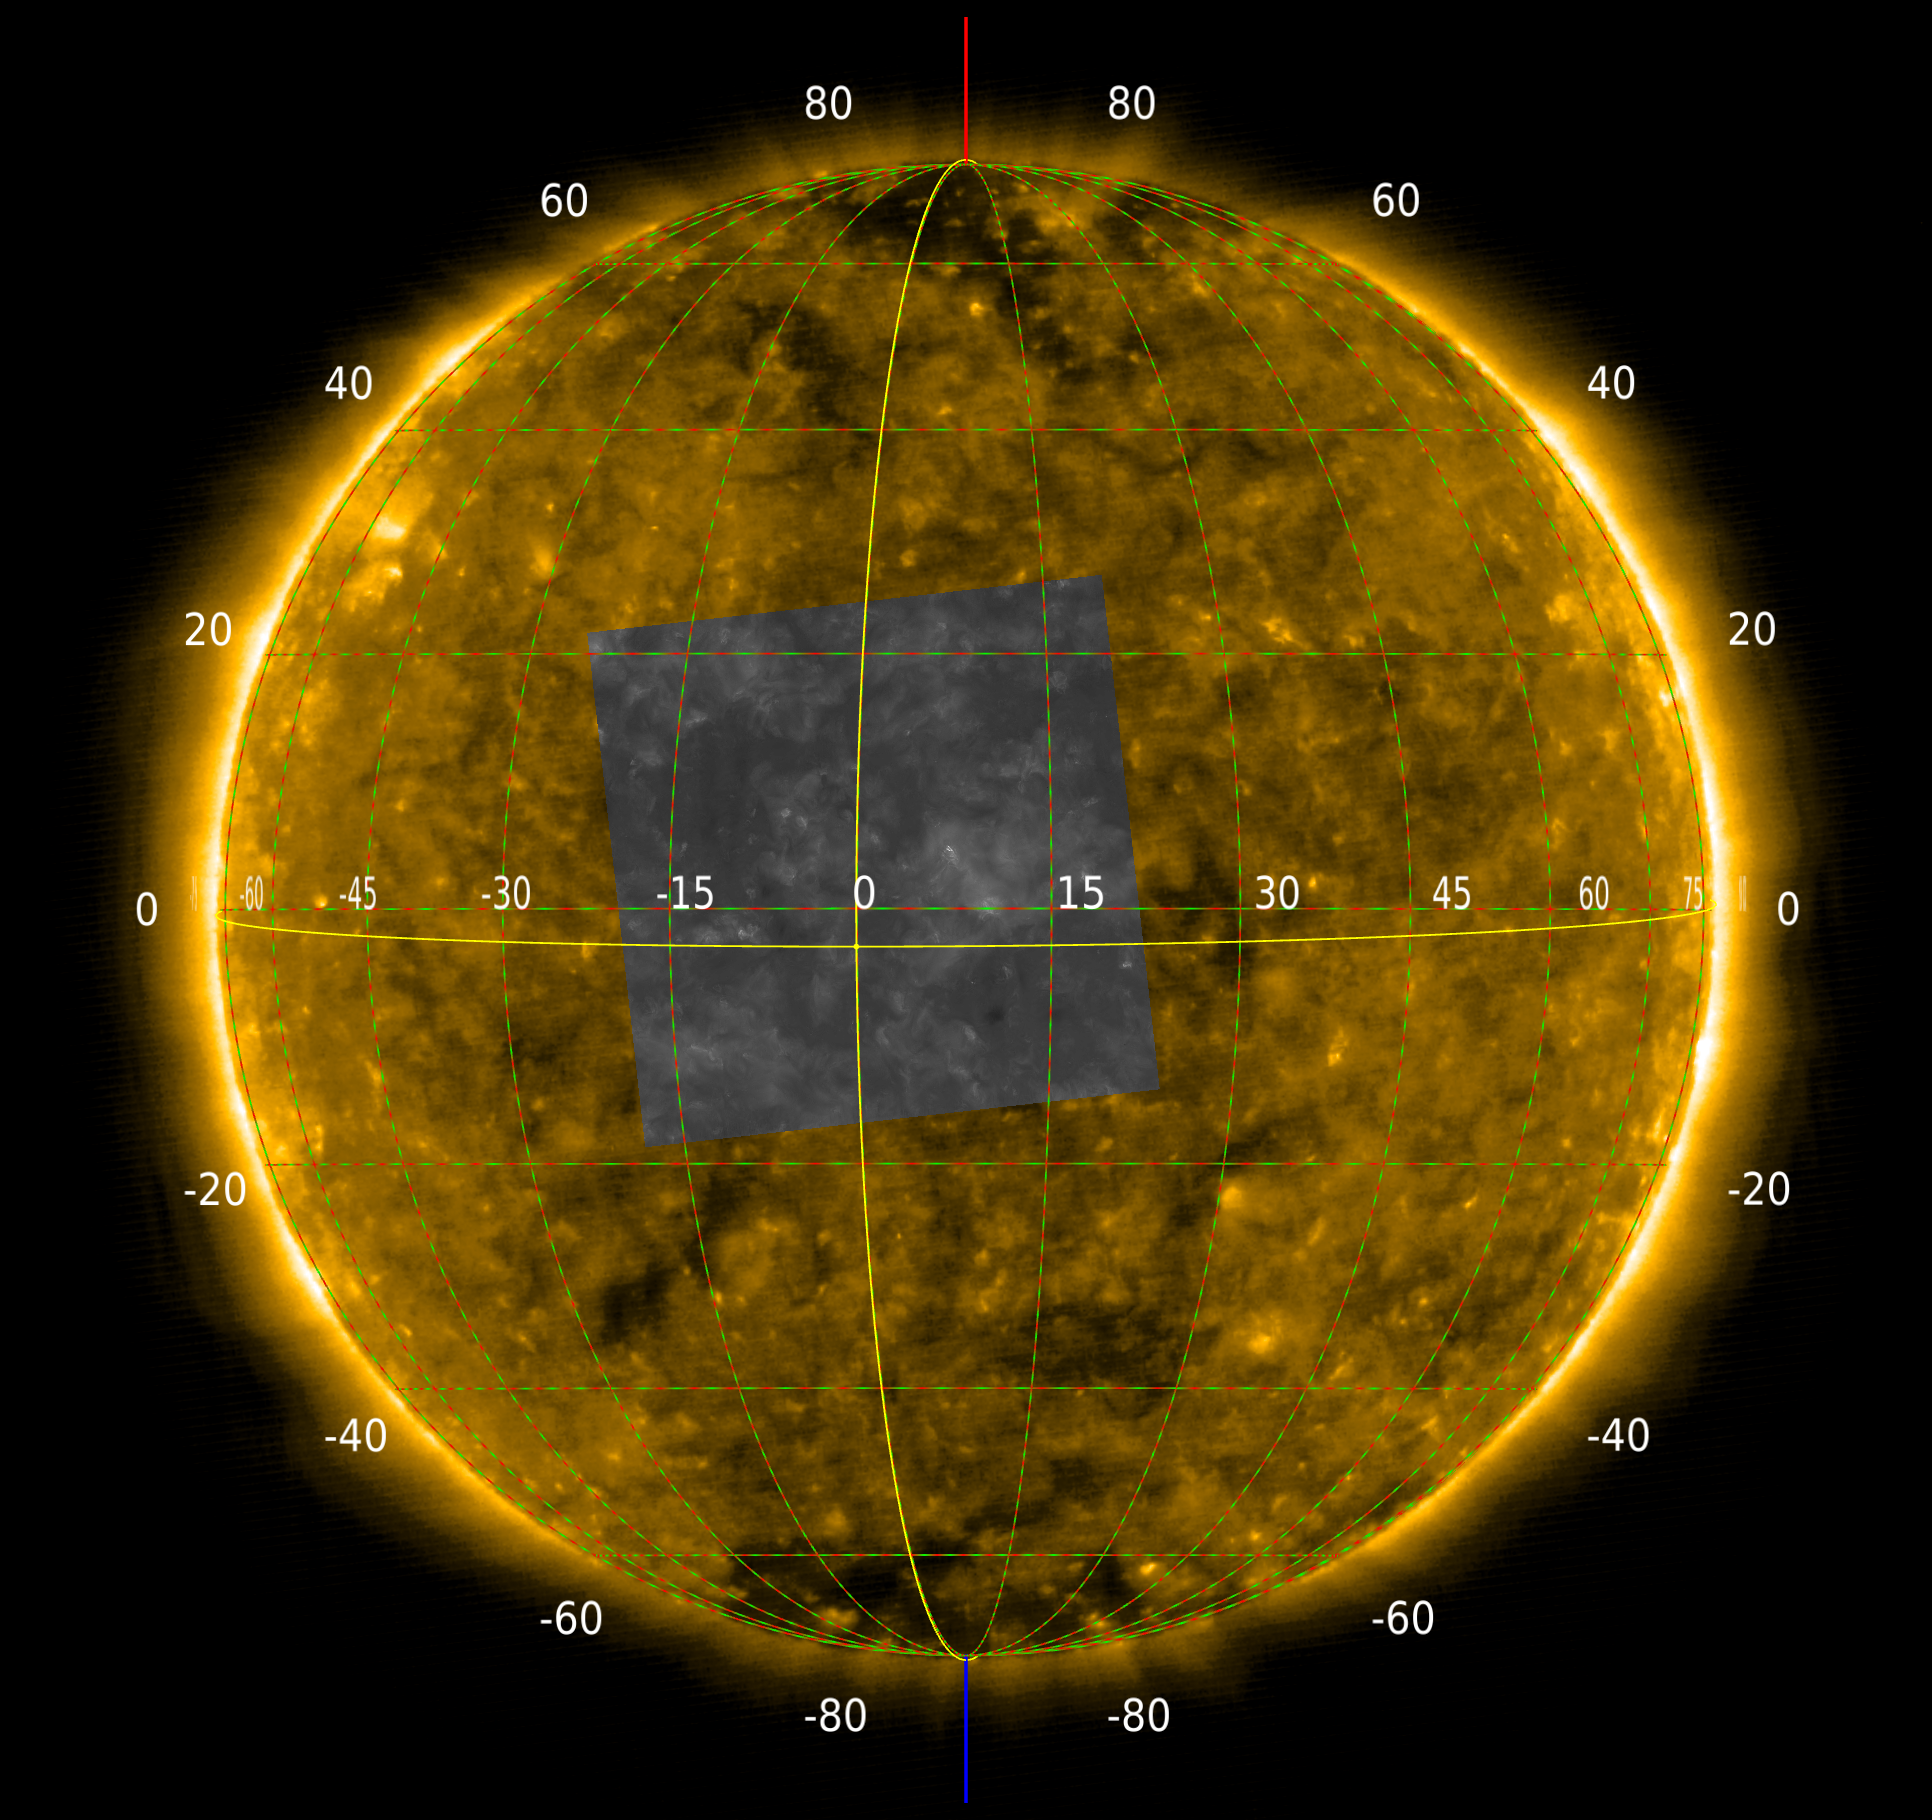
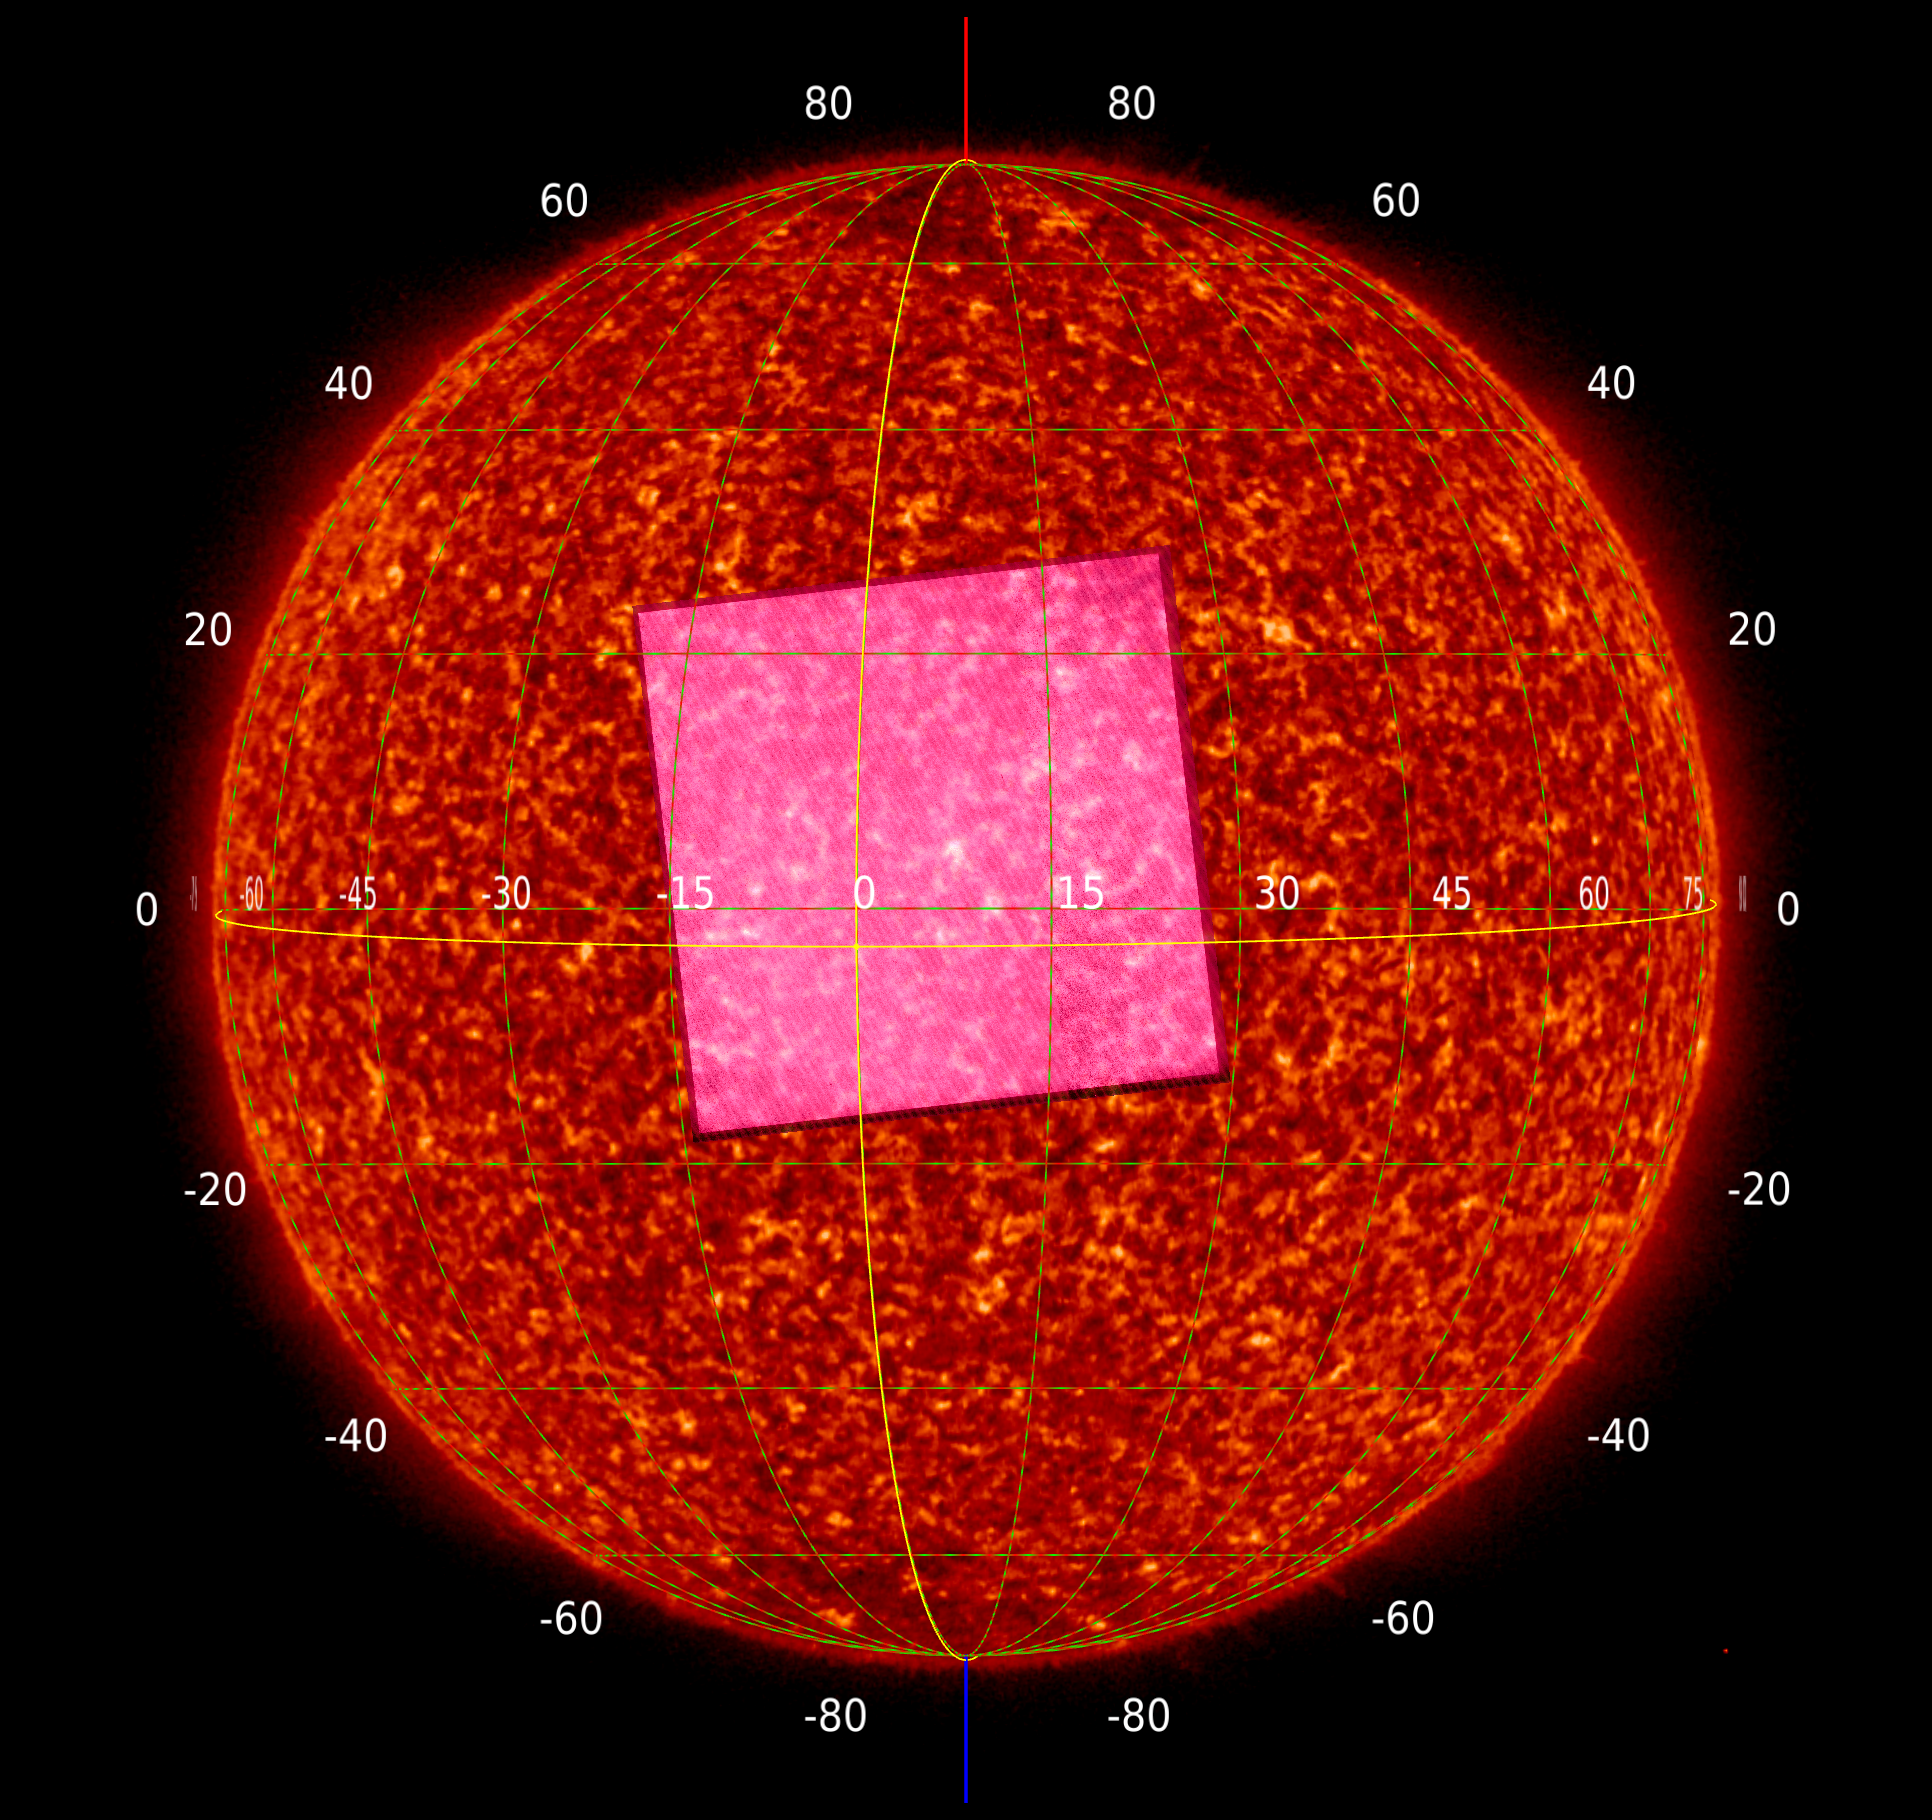
5 years of EUI magic
May 12, 2020- The 3 telescopes of the Extreme Ultraviolet Imager (EUI) onboard Solar Orbiter opened their doors to capture images of the Sun.
May 12, 2025 - Almost 1 million images of the Sun have been made and put in the EUI data treasure chest to be used for groundbreaking research.
5 years ago, on May 12 2020, the Extreme Ultraviolet Imager (EUI) took its very first images of the solar atmosphere. Since then almost a million images have been taken. EUI saw the solar atmosphere at the highest resolution ever and with the biggest field of view ever. EUI observed the smallest flares and jets ever seen, but also the biggest eruption ever. EUI showed the fastest loop oscillations and the fastest time evolution in flares. This was possible because our observing techniques could be tuned to see the finest spatial details at a fast image capturing speed.
At the Royal Observatory of Belgium, David Berghmans, principal investigator of EUI says "Before the launch, we thought we would take a few ten thousand images with each of the three telescopes during the mission lifetime. Now, we have already reached almost one million images! This was possible because the ESA-ground stations were being upgraded and we opted for an extra non-stop program of imaging the full disk of the sun. Another crucial step was to use very short exposure times when capturing solar flares. The built-in flexibility of how the instrument is operated, and in particular the data compression, allows the team to rethink and improve continuously. "
If you want to get a glimpse of the exciting science that was performed with this wealth of data, you can explore the EUI news items here: www.sidc.be/EUI/news
After all this excitement in the past 5 years, EUI is now ready for the next phase on this journey: to leave the ecliptic plane to image the solar poles like no-one has seen them before!
Below the first images taken by EUI's 3 telescopes: the full solar disk images at 17.4 nm (yellow) and 30.4 nm (red) have been taken with the Full Sun imager (FSI). The grey inset was taken with the High Resolution Imager in the EUV (HRIEUV). The pink inset was taken with the High Resolution Imager in Lyman alpha (HRILYA).
Submit an abstract to an ESWW 2025 session now!
The 2025 edition of the European Space Weather Week (ESWW) 2025 will be held in Umea, Sweden from 27th - 31st October in a hybrid format. The overarching theme for ESWW2025 is 'Technological expansion of the Arctic: the new frontiers of space weather'.
The ESWW conference is an excellent opportunity for people from all over the world to gather and discuss the most recent insights in space weather and space climate, and to address the emerging challenges and impacts. Science, observations, data exploitation, data standards and metadata, service development, operational models, engineering and industrial needs are all important aspects of the field that are addressed.
The submission of abstracts to all ESWW2025 sessions is open. All abstracts can be submitted following the instructions on the ESWW webpage: https://esww.eu/calls/call-for-abstracts
Extended deadline: May 22.
If your center would like to present a Live Space Weather Forecast, you can register here before the same deadline: https://esww.eu/calls/call-for-live-space-weather-forecasts
JSWSC is seeking a new Editor-in-Chief
The Journal of Space Weather and Space Climate (JSWSC) seeks a new Editor-in-Chief (EiC) to join its leadership team and help shape the future of this #GoldOpenAccess journal published by EDP Sciences.
Key responsibilities:
- Develop the journal's strategy and scientific profile
- Ensure the quality and integrity of peer review
- Represent JSWSC publicly and liaise with EDP Sciences and E-SWAN
- Oversee Topical Issues and manage the Editorial Board
- Solicit manuscript submissions from the space weather and space climate communities
Requirements:
- Residence or primary affiliation in Europe
- Prior experience as a journal editor (regular or guest)
- Strong scientific communication skills in English
Other info:
- Term: 4 years (renewable)
- Volunteer position - no remuneration
- Applications review starting August 2025
Find more information at https://www.swsc-journal.org/news/360-jswsc-is-seeking-a-new-editor-in-chief
Submit your application (CV + motivation letter) to: pubcom@lists.eswan.eu
Review of solar and geomagnetic activity
WEEK 1271 from 2025 May 05
Solar Active Regions and flares
Solar flaring activity was low but frequent during the past week, with 76 C-class flares detected in total. 58 of those flares were emitted by SIDC sunspot group 469 (NOAA Active Region [AR] 4079, magnetic configuration Beta-Gamma). However it was SIDC sunspot group 492 (NOAA AR 4082, magnetic configuration Beta-Gamma) that produced the brightest flares, two C7 (SIDC Flares 4334 and 4336), both detected on 8 May.
Coronal mass ejections
A Coronal Mass Ejection (CME) was seen in LASCO-C2/SOHO images and was detected by CACTus as launched on 6 May 18:00 UTC. It delivered a glancing blow to Earth's environment on 9 May 07:00 UTC.
Coronal Holes
SIDC Coronal Hole (CH) 111 started crossing the central solar meridian on 5 May. The associated High Speed Stream (HSS) arrived at Earth on 10 May but had a very weak and short-lived effect.
SIDC Coronal Hole (CH) 101 started crossing the central solar meridian on 10 May.
Proton flux levels
The greater than 10 MeV proton flux was at nominal levels during the past week.
Electron fluxes at GEO
The greater-than-2 MeV electron flux was above the 1000 pfu threshold until 9 May and peaked at 16000 pfu on 5 May. It remained below the alert threshold for the rest of the week.
The 24h electron fluence was at moderate levels at the start of the week. On 6 May it increased to high levels and stayed at these levels until 8 May. On 9 May it dropped back to moderate levels and on 11 May it further dropped to normal levels.
Solar wind
At the start of the week the Solar Wind (SW) conditions were affected by the arrival of a High Speed Stream (HSS) that lasted until 7 May. The SW speed peaked at 850 km/s on 6 May, the interplanetary magnetic field (B) varied between 3 and 10 nT and its North-South component (Bz) fluctuated between -8 and 8 nT.
For the rest of the week the SW resembled the slow SW regime, with the SW speed ranging between 400 and 550 km/s. The interplanetary magnetic field (B) varied between 3 and 8 nT and its North-South component (Bz) fluctuated between -7 and 6 nT.
The only exception was a period of several hours on 10 May when the SW speed increased to 550 km/s because of the effect of a weakened HSS. The same day a glancing blow from a CME also influenced the SW magnetic field, as the B increased to 10 nT and the Bz ranged between -10 and 6 nT.
Geomagnetism
The global geomagnetic conditions reached minor storm levels (NOAA Kp 5-) on 5 Mar at 03:00-06:00 UTC and at 15:00-18:00 UTC and for the rest of the day fluctuated between unsettled and active levels (NOAA Kp 3 to 4). The same day the local geomagnetic conditions were quiet to active (K BEL 2-4).
For the days of 6 to 8 May, both global and local conditions were at quiet to unsettled levels (NOAA Kp 1 to 4- and K BEL 1 to 4).
On 10 May there was another geomagnetic disturbance that did not have a major effect to the global conditions as only active levels were observed (NOAA Kp 3 to 4+). However, the local K index raised to minor storm (K BEL 5) between 18:00-21:00 UTC and remained at unsettled to active levels for the rest of the day.
On 11 May both the global and the local geomagnetic conditions dropped to quiet to unsettled levels (NOAA Kp 1+ to 3+, K BEL 2 to 3).
International Sunspot Number by SILSO

The daily Estimated International Sunspot Number (EISN, red curve with shaded error) derived by a simplified method from real-time data from the worldwide SILSO network. It extends the official Sunspot Number from the full processing of the preceding month (green line), a few days more than one solar rotation. The horizontal blue line shows the current monthly average. The yellow dots give the number of stations that provided valid data. Valid data are used to calculate the EISN. The triangle gives the number of stations providing data. When a triangle and a yellow dot coincide, it means that all the data is used to calculate the EISN of that day.
PROBA2 Observations
Solar Activity
Solar flare activity fluctuated from low to moderate during the week.
In order to view the activity of this week in more detail, we suggest to go to the following website from which all the daily (normal and difference) movies can be accessed: https://proba2.oma.be/ssa
This page also lists the recorded flaring events.
A weekly overview movie (SWAP week 789) can be found here: https://proba2.sidc.be/swap/data/mpg/movies/weekly_movies/weekly_movie_2025_05_05.mp4.
Details about some of this week's events can be found further below.
If any of the linked movies are unavailable they can be found in the P2SC movie repository here: https://proba2.oma.be/swap/data/mpg/movies/.
Wednesday May 07
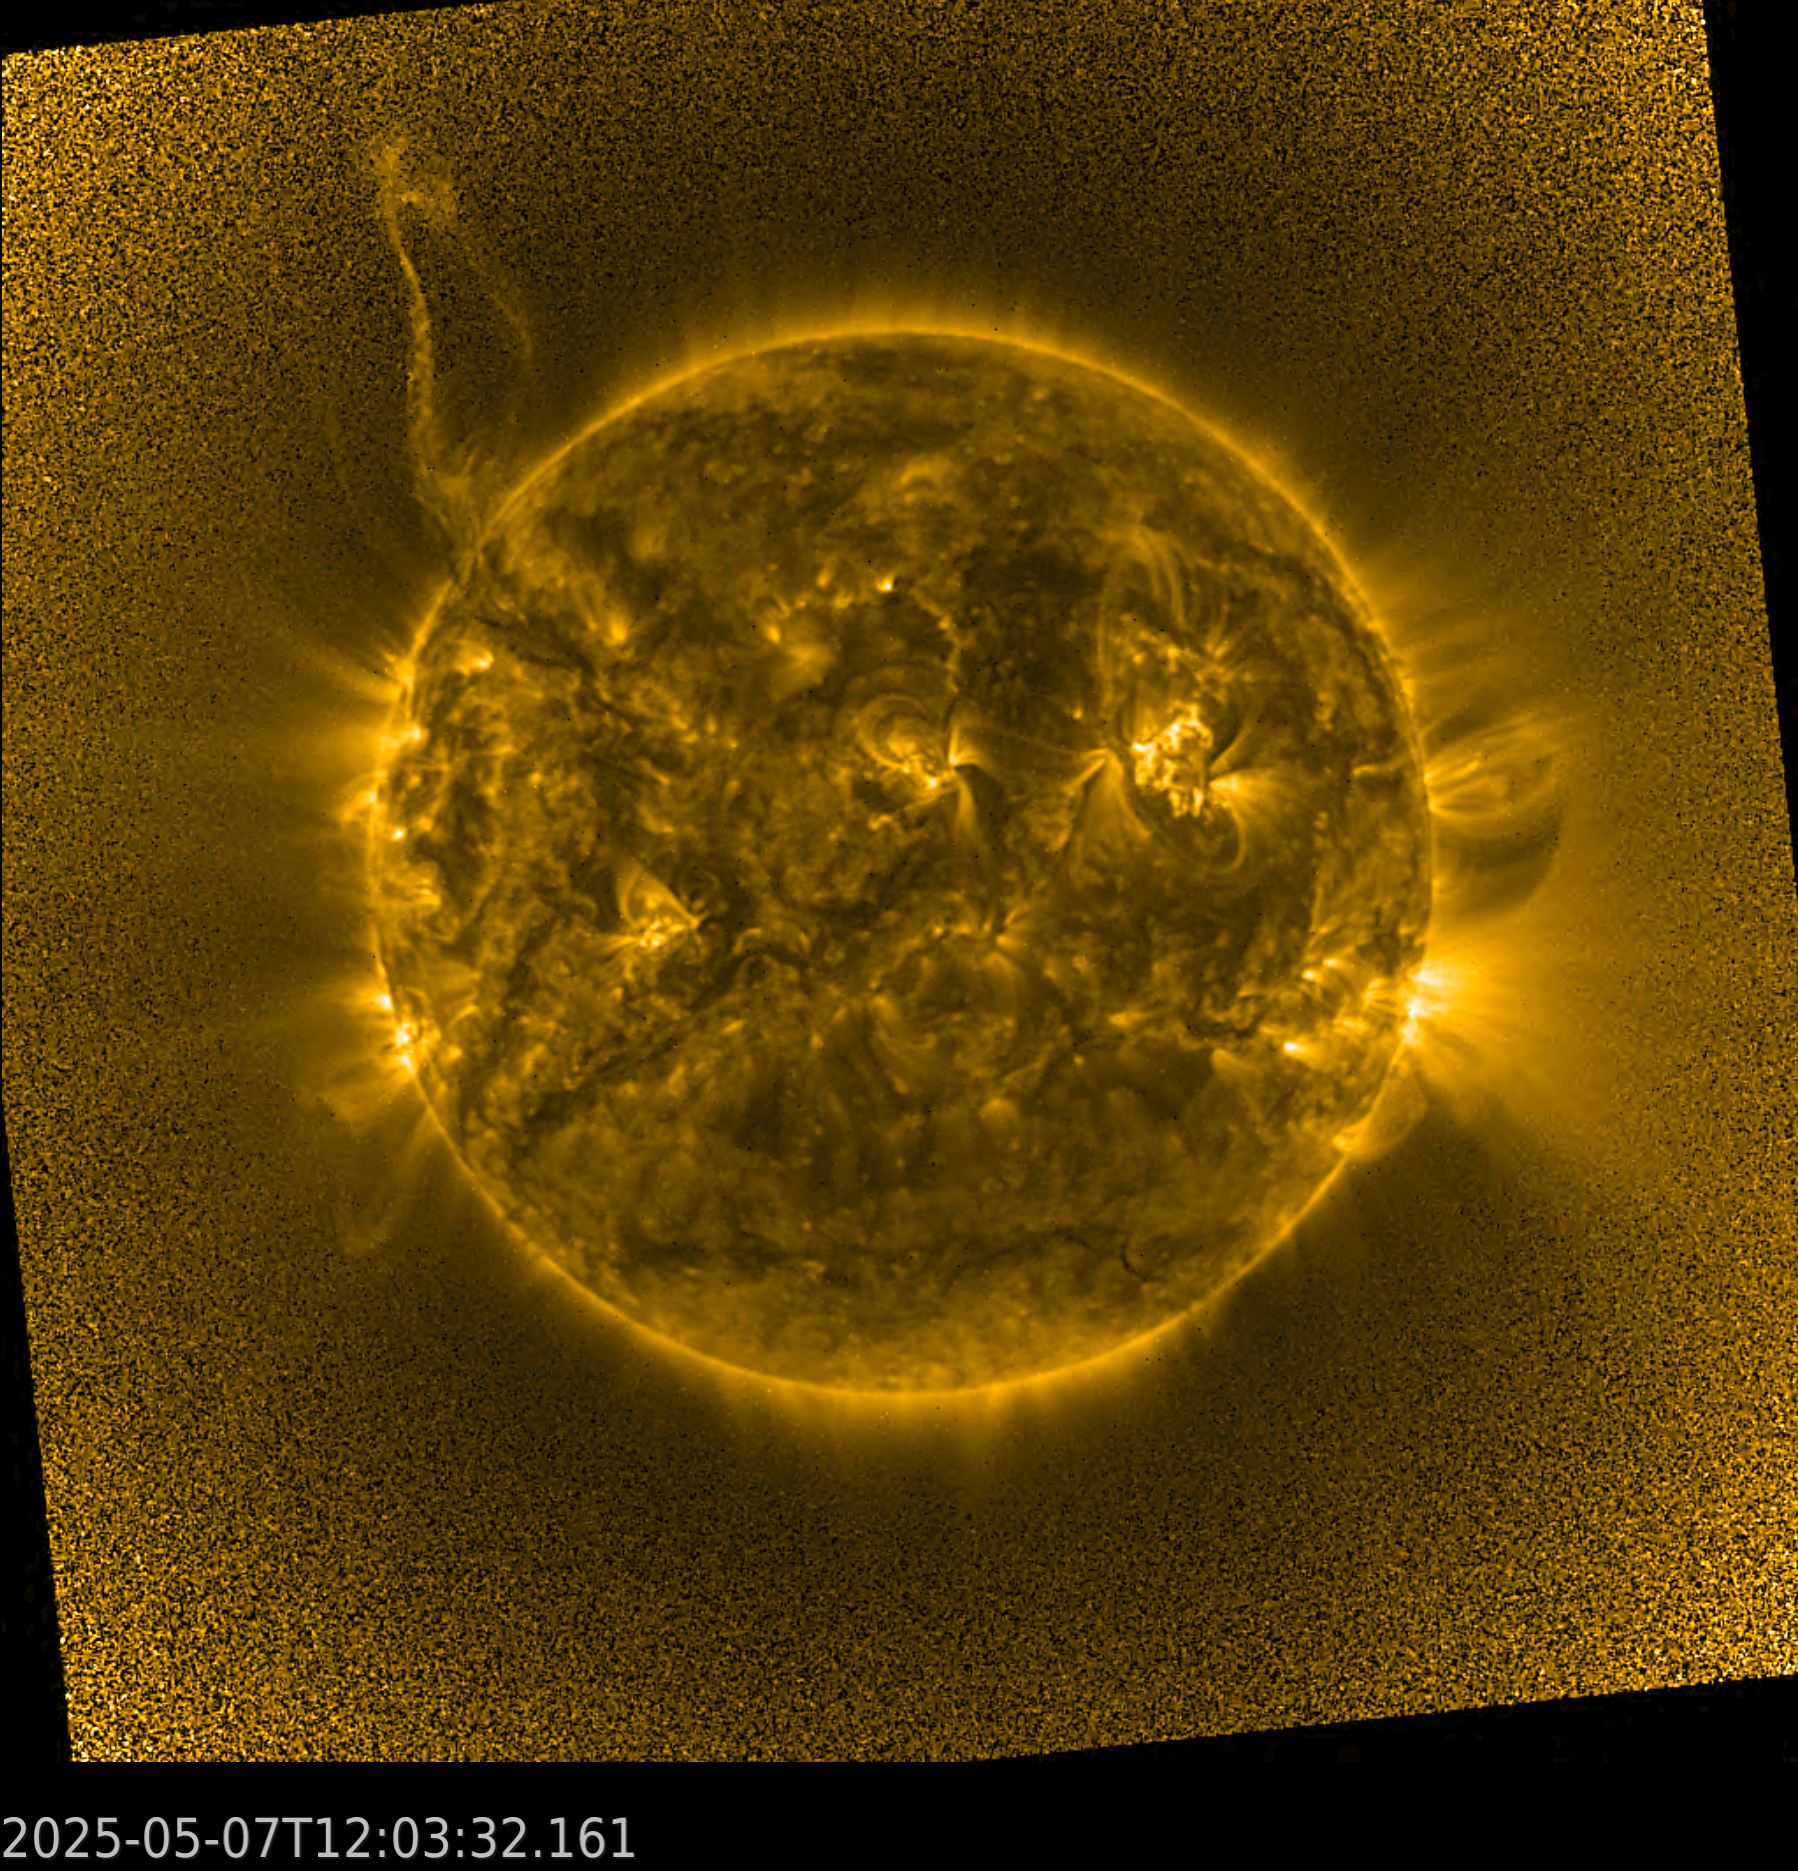
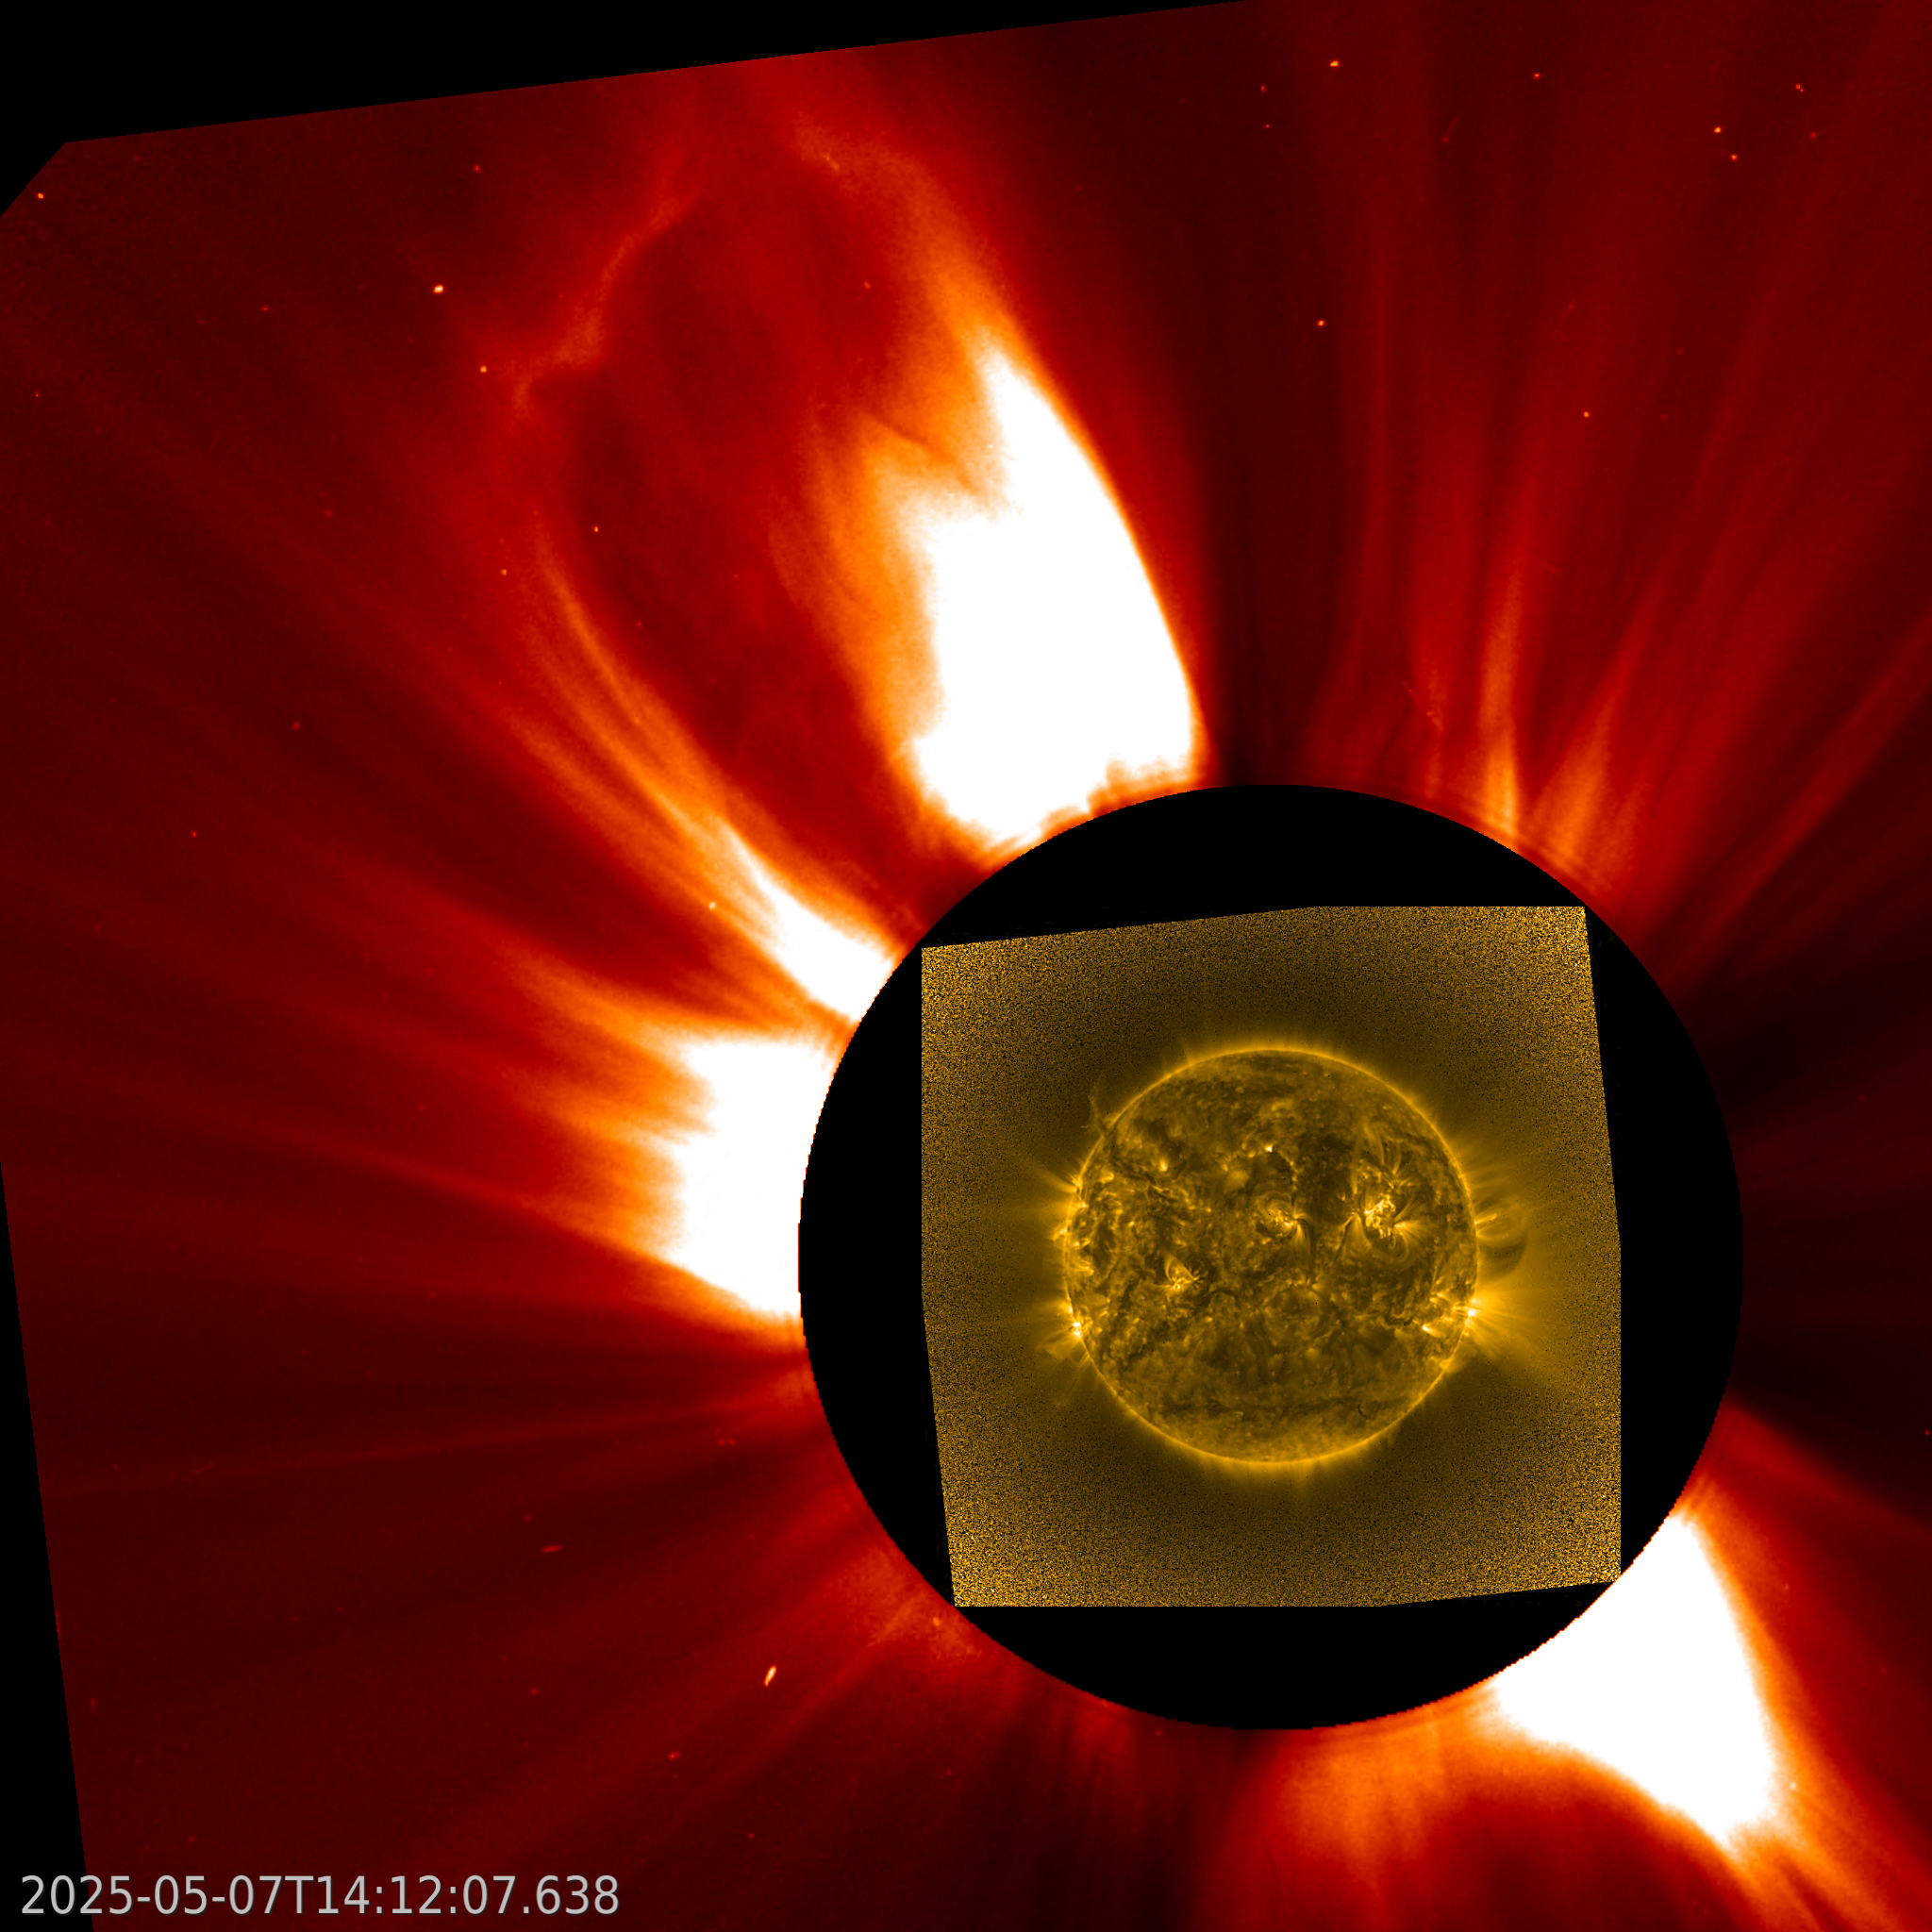
The largest flare of this week was an M1.9, which actually peaked the next day Monday, outside the current reporting period. Apart from many C-class flares throughout the week, on 2025-May-07 there was a large filament eruption which was observed by SWAP at the north-eastern limb of the Sun (top figure). The prominence started lifting off at ~11:00 UT and was later on associated with a coronal mass ejection captured by LASCO-C2 coronagraph onboard SOHO spacecraft (bottom figure).
Find a SWAP movie of the event here: https://proba2.sidc.be/swap/movies/20250507_swap_movie.mp4.
Noticeable Solar Events
| DAY | BEGIN | MAX | END | LOC | XRAY | OP | 10CM | TYPE | Cat | NOAA |
| 11 | 2355 | 0001 | 0006 | M1.9 | 56 | 4079 |
| LOC: approximate heliographic location | TYPE: radio burst type |
| XRAY: X-ray flare class | Cat: Catania sunspot group number |
| OP: optical flare class | NOAA: NOAA active region number |
| 10CM: peak 10 cm radio flux |
Geomagnetic Observations in Belgium

Local K-type magnetic activity index for Belgium based on data from Dourbes (DOU) and Manhay (MAB). Comparing the data from both measurement stations allows to reliably remove outliers from the magnetic data. At the same time the operational service availability is improved: whenever data from one observatory is not available, the single-station index obtained from the other can be used as a fallback system.
Both the two-station index and the single station indices are available here: http://ionosphere.meteo.be/geomagnetism/K_BEL/
Review of Ionospheric Activity


VTEC time series at 3 locations in Europe from 5 May 2025 till 11 May 2025
The top figure shows the time evolution of the Vertical Total Electron Content (VTEC) (in red) during the last week at three locations:
a) in the northern part of Europe(N 61deg E 5deg)
b) above Brussels(N 50.5deg, E 4.5 deg)
c) in the southern part of Europe(N 36 deg, E 5deg)
This top figure also shows (in grey) the normal ionospheric behaviour expected based on the median VTEC from the 15 previous days.
The time series below shows the VTEC difference (in green) and relative difference (in blue) with respect to the median of the last 15 days in the North, Mid (above Brussels) and South of Europe. It thus illustrates the VTEC deviation from normal quiet behaviour.
The VTEC is expressed in TECu (with TECu=10^16 electrons per square meter) and is directly related to the signal propagation delay due to the ionosphere (in figure: delay on GPS L1 frequency).
The Sun's radiation ionizes the Earth's upper atmosphere, the ionosphere, located from about 60km to 1000km above the Earth's surface.The ionization process in the ionosphere produces ions and free electrons. These electrons perturb the propagation of the GNSS (Global Navigation Satellite System) signals by inducing a so-called ionospheric delay.
See http://stce.be/newsletter/GNSS_final.pdf for some more explanations; for more information, see https://gnss.be/SpaceWeather
The SIDC Space Weather Briefing
The forecaster on duty presented the SIDC briefing that gives an overview of space weather from May 4 to 11.
The pdf of the presentation can be found here: https://www.stce.be/briefings/20250512_SWbriefing/pdf
Upcoming Activities at the STCE
Courses, seminars, presentations and events with the Sun-Space-Earth system and Space Weather as the main theme. We provide occasions to get submerged in our world through educational, informative and instructive activities.
* May 16, 2025, Presentation: Solar Physics news, Planetarium, Heizel, Belgium.
* May 22, 2025, school visiting ‘le centre Belge de Météorologie Spatiale’, Brussels, Belgium
* May 26-27, 2025, STCE Course Space Weather impacts on aviation, online - register: https://events.spacepole.be/event/215/
* Jun 7-9, STCE stand: Dichtbij de Zon, Nerdland Festival, Wachtebeke, Belgium, https://www.nerdlandfestival.be/nl/
* Jun 20, 2025, STCE seminar: The Vigil mission to L5
* Jun 23-25, 2025, STCE Space Weather Introductory Course, Brussels, Belgium - register: https://events.spacepole.be/event/216/
* Sep 15-16, 2025, STCE Course Space Weather impacts on aviation, online - register: https://events.spacepole.be/event/218/
* Oct 23-25, ESWW Space Weather Course by Umea University and STCE, Kiruna, Sweden
* Oct 27-31, European Space Weather Week, Umea, Sweden - https://esww.eu/
* Nov 17-19, 2025, STCE Space Weather Introductory Course, Brussels, Belgium - register: https://events.spacepole.be/event/217/
To register for a course and check the seminar details, navigate to the STCE Space Weather Education Center: https://www.stce.be/SWEC
If you want your event in the STCE newsletter, contact us: stce_coordination at stce.be
Website: https://www.stce.be/SWEC