- Table of Content
- 1.Power play wit...
- 2.Spectacular er...
- 3.Review of spac...
- 4.PROBA2 Observa...
- 5.International ...
- 6.Noticeable Sol...
- 7.Geomagnetic Ob...
- 8.The SIDC space...
- 9.Review of Iono...
- 10.Space Weather ...
2. Spectacular eruption of a long filament
3. Review of space weather
4. PROBA2 Observations (12 May 2025 - 18 May 2025)
5. International Sunspot Number by SILSO
6. Noticeable Solar Events
7. Geomagnetic Observations in Belgium
8. The SIDC space weather briefing
9. Review of Ionospheric Activity
10. Space Weather Education Center: courses, seminars and events
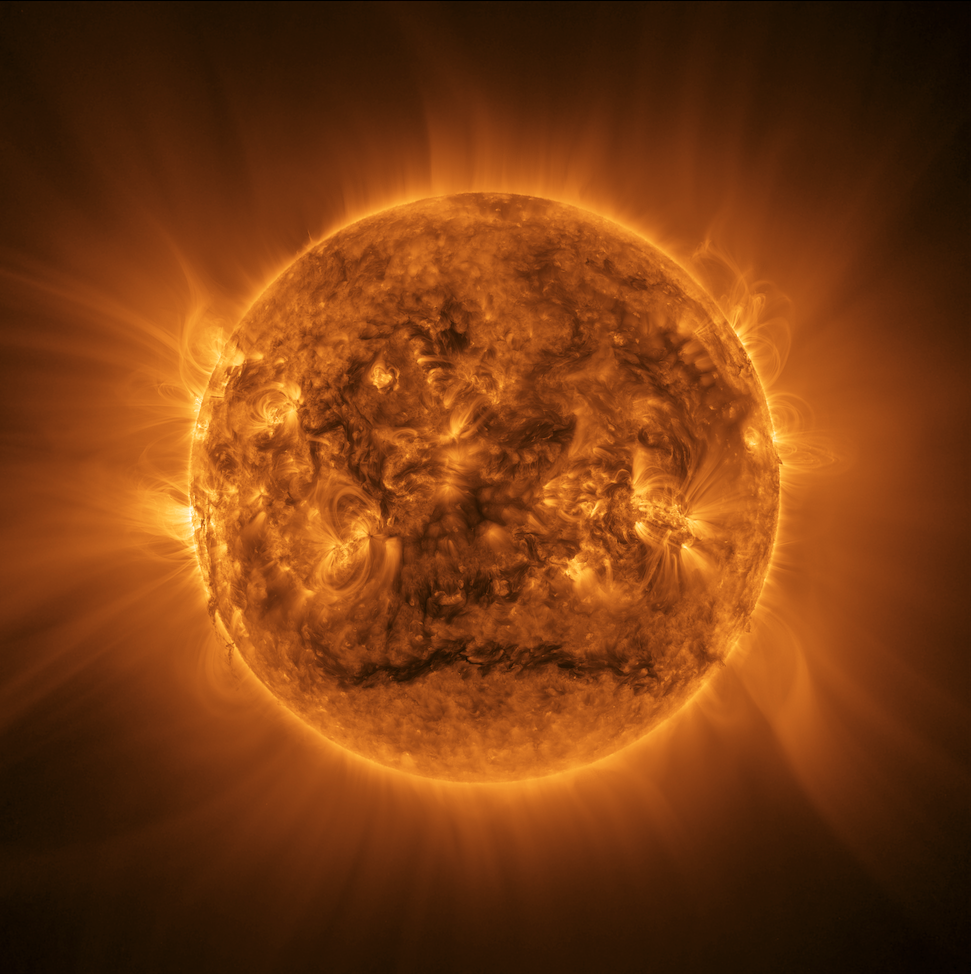
Power play with two space telescopes
Do you remember the highest resolution image of the Sun ever made? https://www.sidc.be/article/patchwork-image-sun
This image, showing the mesmerising details of the solar atmosphere in more detail than had ever been done before, received many enthusiastic reactions. And so we did it again, and now we even combined images from two telescopes!
How did we do this?
The team that operates the instrument EUI onboard the spacecraft Solar Orbiter decided to make a broad view showing the sun and its huge magnetic tentacles stretching out far into space. EUI consists of 2 telescopes that ‘see’ the extreme ultraviolet light from the sun. Its Full Sun Imager (FSI) telescope photographs the solar surroundings, while the High Resolution Imager (HRI EUV) telescope photographs the sun itself. Afterwards, images from the different telescopes have to be combined. This is a software 'tour de force'.
The result is the 2025 mosaic
Click here for the high resolution version: https://stce.be/movies/20250309_HRIEUV-FSI_Mosaic.jpg
The procedure that we followed
1 - Take a background shot of the area around the Sun with the Full Sun Imager FSI.
2 - Split the sun's surface in 25 squares.
3 - Point the 2.5 x 3.0 x 2.5 meter box-shaped satellite Solar Orbiter to square 1, while it is at a distance of around 74,5 million kilometers from Earth (about halfway between Earth and the Sun).
4 - Take pictures with the high resolution telescope HRIEUV.
5 - Repoint the whole satellite to the next square.
6 - Take pictures with the high resolution telescope HRIEUV.
7 - Repeat steps 5 and 6 until all 25 squares are photographed.
8 - Download the data and give it to Emil Kraaikamp, the creator of the EUI-instrument powerhouse software.
9 - Let him do his Emilomagic and merge all images.
10 -The finale: the widest high-resolution image of the Sun ever made is ready and reveals the many details of the corona.
Emil talks with full enthusiasm about the self-developed software: "I start from the background FSI image that I resample into smaller pixels comparable to the pixel-size of the HRIEUV images. The part of the background FSI image with the Sun itself can then be filled with 25 high resolution solar images."
Movie: The making of
click here: https://stce.be/movies/20250309-EUIMosaic_MakingOf.mp4
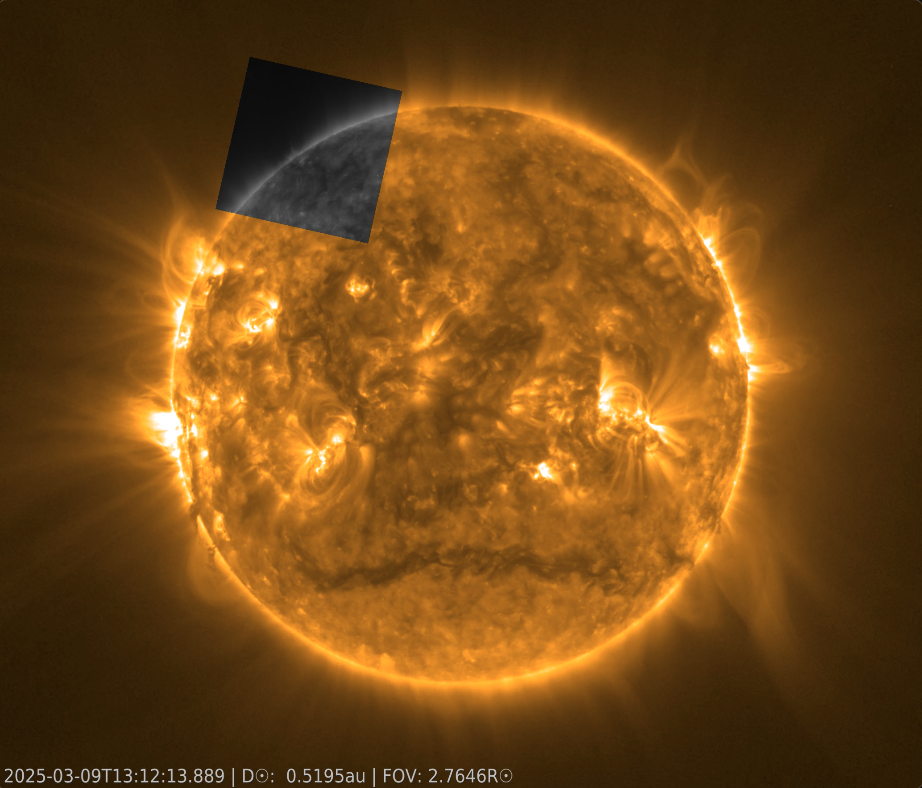
The animation shows the observations made on 9 March 2025, which were used to create this new mosaic. It shows the Sun and its extended corona. A sequence of dark squares rushes over the solar disk. These highlight the 25 spacecraft pointings that were used to record very detailed observations over a smaller field-of-view with HRI. For each of these pointings 6 HRI and 2 FSI images were made, resulting in 200 images to be combined in one mosaic. Careful image processing by Emil Kraaikamp allowed to forge all these puzzle pieces together in one seamless image. True magic.
The magic is to glue the 25 HRIEUV images of the sun to the FSI image of the area around the sun such that you don't see what part of the image is taken by which telescope. A complication comes in because the sun rotates and changes during the photoshoot and the magnetic structures might look a little bit different. The shoot therefore needs to be done in the shortest time possible to keep these changes minimal. Luckily, the mosaic powerhouse software can deal with a quirky photo model. This was already tested and proven during the making of the very first mosaic in 2023.
The 2025 mosaic at Nerdland
The 2025 EUI mosaic will be shown on Nerdland, a science festival in Belgium on June 6,7,8 and 9 on a 6 x 6 meter canvas: https://www.nerdlandfestival.be/nl/programma/duik-mee-in-de-zon
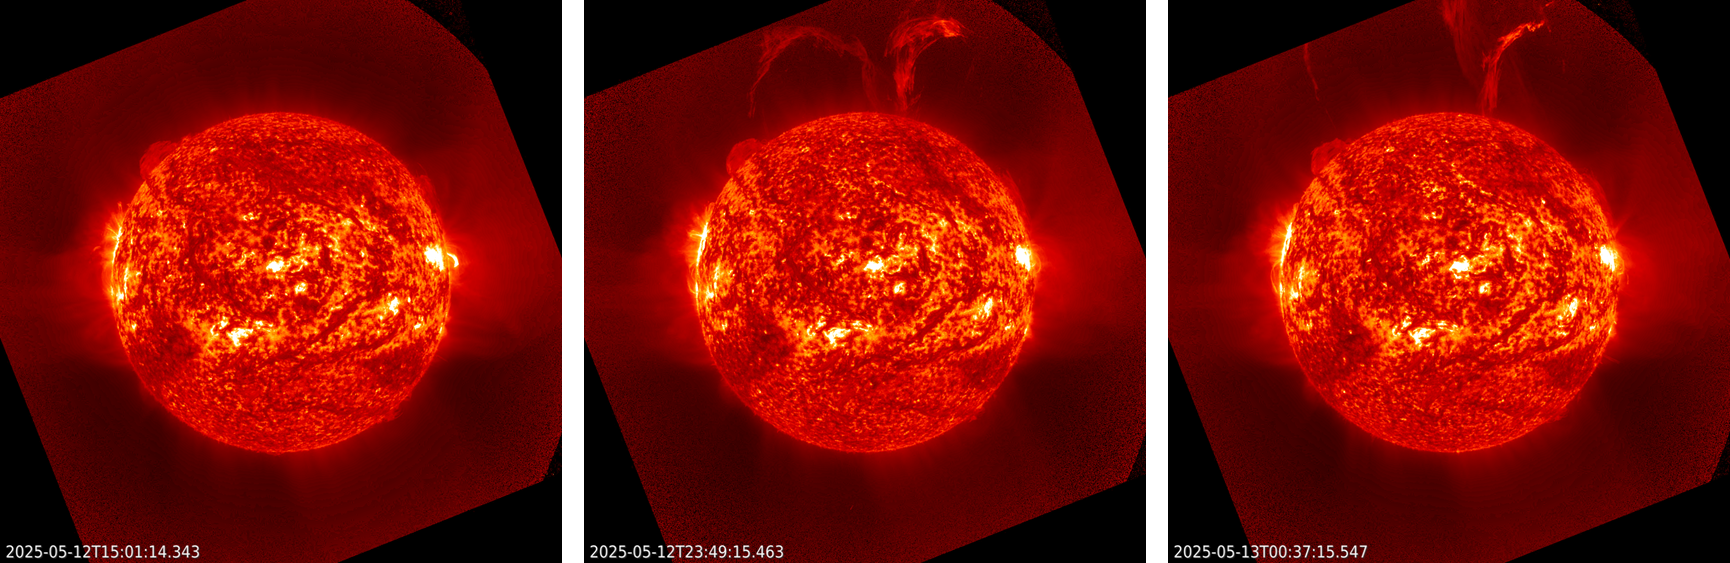
Spectacular eruption of a long filament
It was quite a start of the week! First, on 13 May, there was an X1.2 flare (https://www.stce.be/news/766/welcome.html ) produced by active region SIDC 0494 (NOAA 4086 - https://www.sidc.be/index.php/services/event-chains/sunspots ) near the northwest limb. It was followed a day later by an X2.7 flare (https://www.stce.be/news/767/welcome.html ) from the trailing portion of SIDC 0496 (NOAA 4087) near the northeast solar limb. However, both flares were preceded by an even more impressive eruption. Indeed, late on 12 May, a filament with a length of twice the Earth-Moon distance (!) erupted from the Sun's northern hemisphere. Solar filaments are clouds of charged particles ("plasma") above the solar surface squeezed between regions of opposite magnetic polarity. Being cooler and denser than the plasma underneath and their surroundings, they appear as dark lines when seen on the solar disk, or as bright blobs when seen near the solar limb (then they are called "prominences"). Special filters are required to observe these features, such as in the Hydrogen-alpha (H-alpha) line in the red part of the solar spectrum (656.28 nm), or in some extreme ultraviolet (EUV) passbands such as GOES/SUVI 195 or SUVI 304. In this case, the filament was not so obvious and long in H-alpha as it was in EUV imagery. Underneath is a mosaic showing the evolution of the filament eruption in temperatures around 80.000 degrees (SUVI 304). A clip is available in the online version of this newsitem at https://www.stce.be/news/768/welcome.html , covering the period from 12 May (15:00UTC) until 14 May (12:00UTC). It shows first the filament eruption, followed by the X-class events.
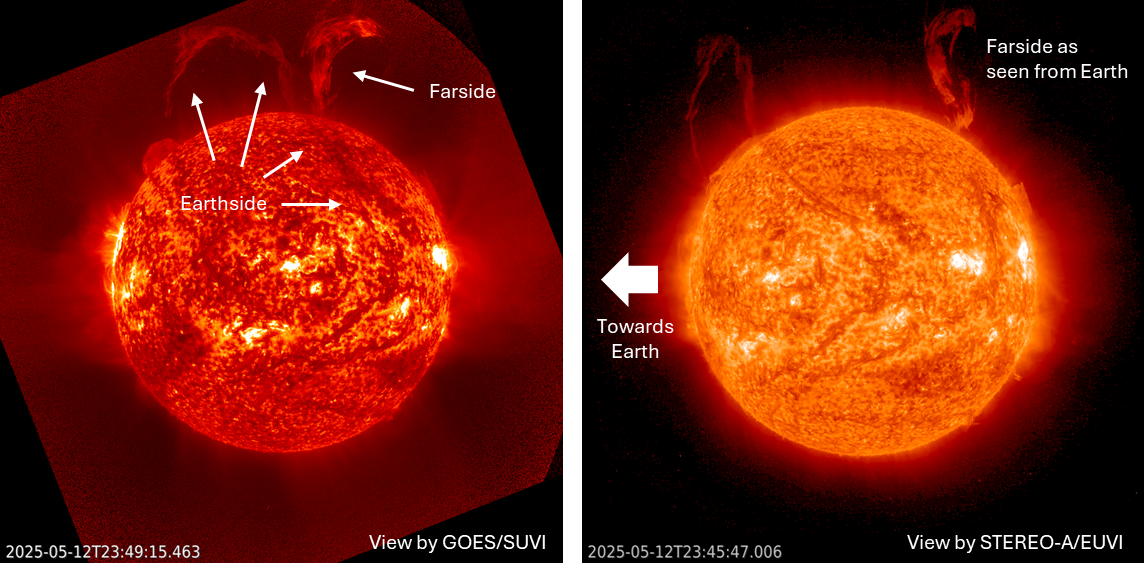
The filament eruption looks more complex than it is, due to another filament that erupted more-or-less in the same line -of-sight as the big filament eruption, but actually originated from the Sun's far side. By using EUVI 304 imagery from the STEREO-A spacecraft, currently preceding the Earth by 36 degrees, the two can be disentangled, as shown in the annotated imagery underneath. A clip with STEREO-A/EUVI 304 imagery covering the same 12 to 14 May period as GOES/SUVI can be found in the online version.
The associated coronal mass ejection (CME) was wide but slow, hiding the much narrower CME from the farside filament eruption. In the imagery underneath the white light coronagraphic imagery from SOHO/LASCO C2 and STEREO-A/COR2 are overlaid on the corresponding EUV imagery by the spacecraft. In particular from the STEREO-A point of view, the CME looked like a textbook example, with a bright leading edge, dark cavity and a bright core (the filament).
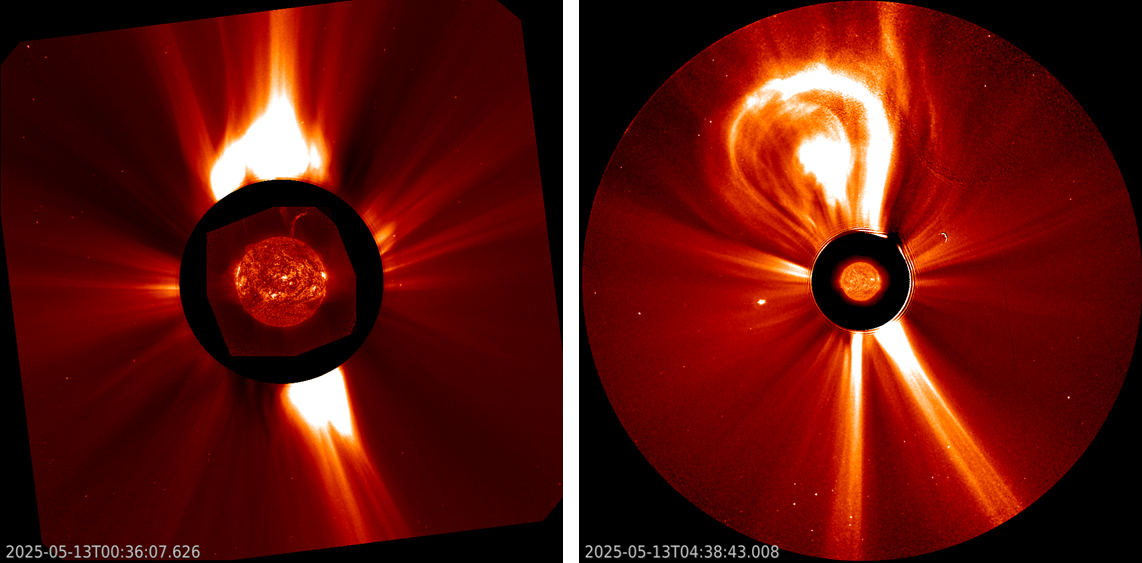
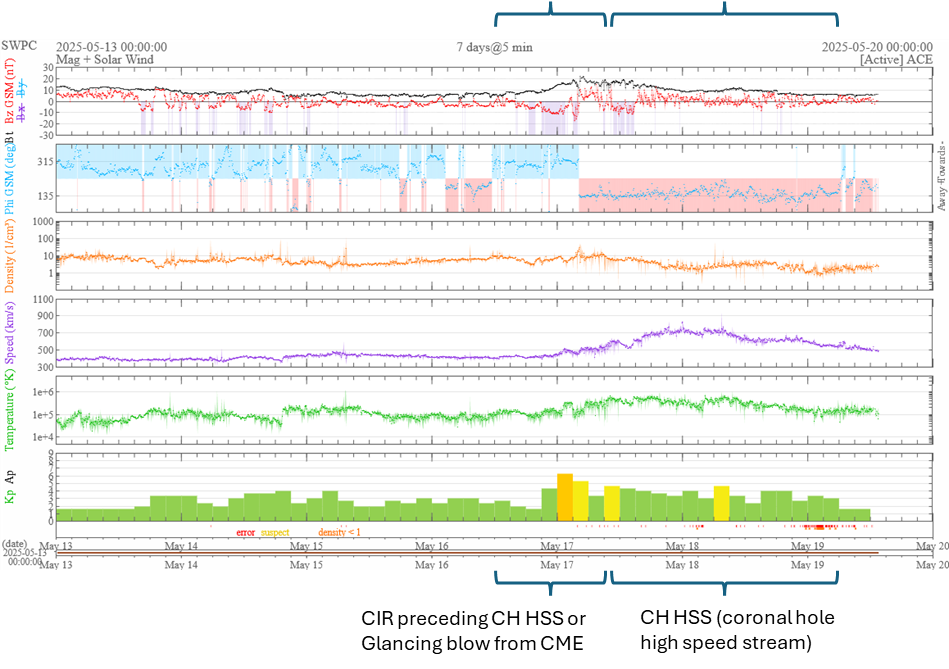
In view of the location of the filament, a glancing blow from the CME to the earth environment was not excluded by the SIDC SWx forecaster (http://www.sidc.be/index.php ). Solar wind data from DSCOVR show indeed a structure late 16 and early 17 May that may be the signature of the CME's glancing blow, but it may also be that this is simply the co-rotating interaction region (see this STCE newsitem at https://www.stce.be/news/269/welcome.html ) that precedes the high speed stream from a coronal hole, i.e. the low density, high speed (730 km/s - purple curve underneath) that can be seen peaking around 18 May. In the latter case the CME from the filament might have completely missed us, or contributed only marginally. Whatever it was, the structure in the solar wind disturbed the Earth's magnetic field quite significantly, and eventually resulted in a moderate geomagnetic storm (Kp = 6+).
Review of space weather
Solar Active Regions (ARs) and flares
Solar flaring activity was high between May 13 and May 16 with two X-class and five M-class flares and low for the rest of the week. In total, six M-class flares were recorded. The strongest flares were an X1.2 (SIDC Flare 4378) and an X2.7 flare (SIDC Flare 4385). The X1.2 flare peaked at 15:38 UTC on May 13 and was associated with SIDC Sunspot Group 494 (NOAA Active Region 4086, magnetic type beta-gamma). The X2.7 flare peaked at 08:25 UTC on May 14 and was associated with SIDC Sunspot Group 496 (NOAA Active Region 4087, magnetic type beta-delta). There was a total of fifteen active regions visible this week. The most complex were SIDC Sunspot Group 494 (NOAA Active Region 4086), SIDC Sunspot Group 496 (NOAA Active Region 4087) and SIDC 469 (NOAA Active Region 4079, magnetic type beta-gamma).
Coronal mass ejections
A few Coronal Mass Ejections (CMEs) were detected during the week. Almost all of them were either events near the west or east limb or back-sided and had no impact on Earth. A faint, slow, full halo CME was observed in LASCO/C2 and C3 coronagraph imagery starting from around 10:30 UTC on May 12. No clear source was identified on the visible disk, suggesting a back-sided event. A wide CME was observed in LASCO/C2 and LASCO/C3 coronagraph imagery starting from around 01:00 UTC on May 13, lifting of the north hemisphere. The CME was most likely associated with a long filament eruption observed in SDO/AIA 304 data around 23:00 UTC on May 12 near the central meridian in mid-latitude north hemisphere. A glancing blow arrival at Earth, associated with this CME was most likely observed starting from 00:00 UTC on May 17.
Coronal Holes
An equatorial, negative polarity coronal hole (SIDC Coronal Hole 104) crossed the central meridian on May 12. An elongated, mid-latitude, positive polarity coronal hole (SIDC Coronal Hole 104) began crossing the central meridian on May 15. An associated high-speed stream arrived at Earth starting from May 18.
Proton flux levels
The greater than 10 MeV proton flux was below 10 pfu. It was enhanced on May 13 due to the X1.2 flare that peaked at 15:38 UTC on May 13, but remained below the 10 pfu threshold.
Electron fluxes at GEO
The greater than 2 MeV electron flux as measured by GOES 18 and GOES 19 was mostly below 1000 pfu. However, the greater than 2 MeV electron flux measured by GOES 18 marginally crossed the 1000 pfu threshold between 20:00 UTC and 21:45 UTC on May 16. The 24-hour electron fluence was nominal.
Solar wind near Earth
The solar wind parameters (ACE and DSCOVR) were enhanced at the beginning of the week, likely under the waning influence of a middle-latitude, positive polarity coronal hole (SIDC Coronal Hole 101) that crossed the central meridian on May 9. The speed increased up to 450 km/s. The interplanetary magnetic field was between 7 nT and 13 nT. The Bz component varied between -8 nT and 10 nT.
A gradual return to the slow solar wind regime followed. The solar wind conditions (ACE and DSCOVR) were enhanced again on May 17, likely due to a glancing blow from the Coronal Mass Ejection (CME) observed near the Sun around 23:00 UTC on May 12 and, successively, due to a high-speed stream from the positive polarity coronal hole (SIDC Coronal Hole 104). The solar wind speed increased from 400 km/s up to values around 750 km/. The interplanetary magnetic field reached values up to 20 nT. The southward component of the interplanetary magnetic field fluctuated between –18 nT and +16 nT. Solar wind conditions remained slightly elevated through the end of the week under the continued influence of the high-speed stream.
Magnetic field of Earth
The global geomagnetic conditions reached moderate storm levels (NOAA Kp 6+ ) between 00:00 and 03:00 UTC on May 17. The geomagnetic storm was most likely the result of a glancing blow, associated with the Coronal Mass Ejection (CME) observed around 23:00 UTC on May 12. Mostly unsettled to active levels, with isolated minor storm intervals (NOAA Kp 3 to 5, K BEL 3 to 5) were observed during the rest of the week.
PROBA2 Observations (12 May 2025 - 18 May 2025)
Solar Activity
Solar flare activity fluctuated from low to high during the week.
In order to view the activity of this week in more detail, we suggest to go to the following website from which all the daily (normal and difference) movies can be accessed: https://proba2.oma.be/ssa
This page also lists the recorded flaring events.
A weekly overview movie can be found here (SWAP week 790). https://proba2.sidc.be/swap/data/mpg/movies/weekly_movies/weekly_movie_2025_05_12.mp4
Details about some of this week's events can be found further below.
If any of the linked movies are unavailable they can be found in the P2SC movie repository here https://proba2.sidc.be/swap/data/mpg/movies/
Wednesday May 14
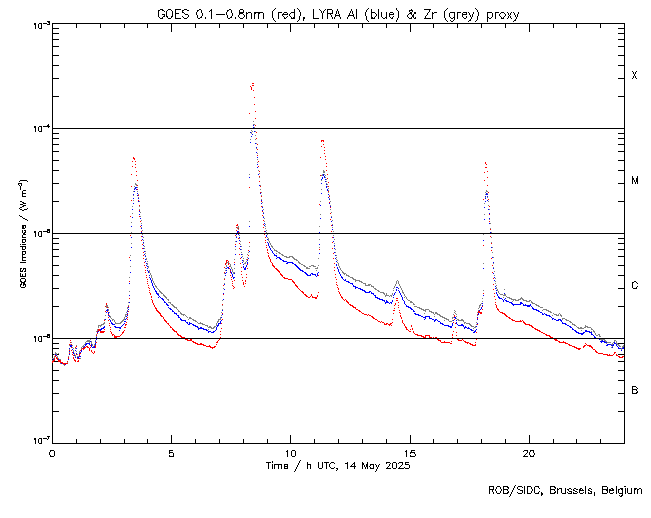
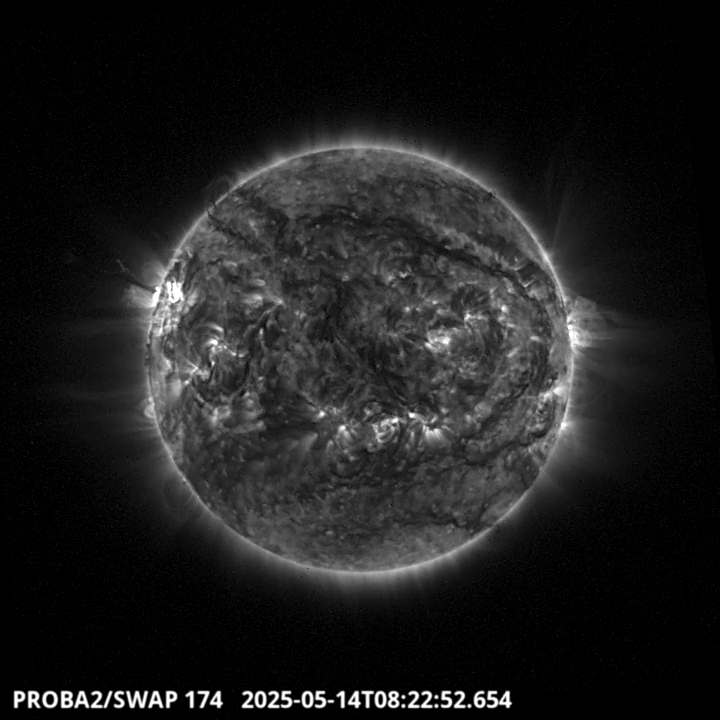
The highest flare of the week is a X2.5 which has been recorded by LYRA and SWAP (see above)
peaking at 8:25 UT. It has been produced by the NOAA active region4087 localized in the North
East part of the solar disc. Find a SWAP movie of the event here. https://proba2.sidc.be/swap/movies/20250514_swap_movie.mp4
International Sunspot Number by SILSO

The daily Estimated International Sunspot Number (EISN, red curve with shaded error) derived by a simplified method from real-time data from the worldwide SILSO network. It extends the official Sunspot Number from the full processing of the preceding month (green line), a few days more than one solar rotation. The horizontal blue line shows the current monthly average. The yellow dots give the number of stations that provided valid data. Valid data are used to calculate the EISN. The triangle gives the number of stations providing data. When a triangle and a yellow dot coincide, it means that all the data is used to calculate the EISN of that day.
Noticeable Solar Events
| DAY | BEGIN | MAX | END | LOC | XRAY | OP | 10CM | TYPE | Cat | NOAA |
| 13 | 1525 | 1538 | 1544 | N7W86 | X1.2 | 1B | III/3II/2 | 64 | 4086 | |
| 14 | 0305 | 0325 | 0335 | M5.3 | II/2 | 69 | 4087 | |||
| 14 | 0736 | 0745 | 0751 | M1.2 | VI/1 | 69 | 4087 | |||
| 14 | 0804 | 0825 | 0831 | N15E68 | X2.7 | 2B | III/2 | 69 | 4087 | |
| 14 | 1104 | 1119 | 1131 | N19E65 | M7.7 | 1 | VI/2III/2 | 69 | 4087 | |
| 14 | 1759 | 1811 | 1818 | M4.7 | III/2 | 69 | 4087 | |||
| 15 | 1708 | 1721 | 1727 | N18E48 | M2.1 | 1F | VI/1 | 69 | 4087 |
| LOC: approximate heliographic location | TYPE: radio burst type |
| XRAY: X-ray flare class | Cat: Catania sunspot group number |
| OP: optical flare class | NOAA: NOAA active region number |
| 10CM: peak 10 cm radio flux |
Geomagnetic Observations in Belgium
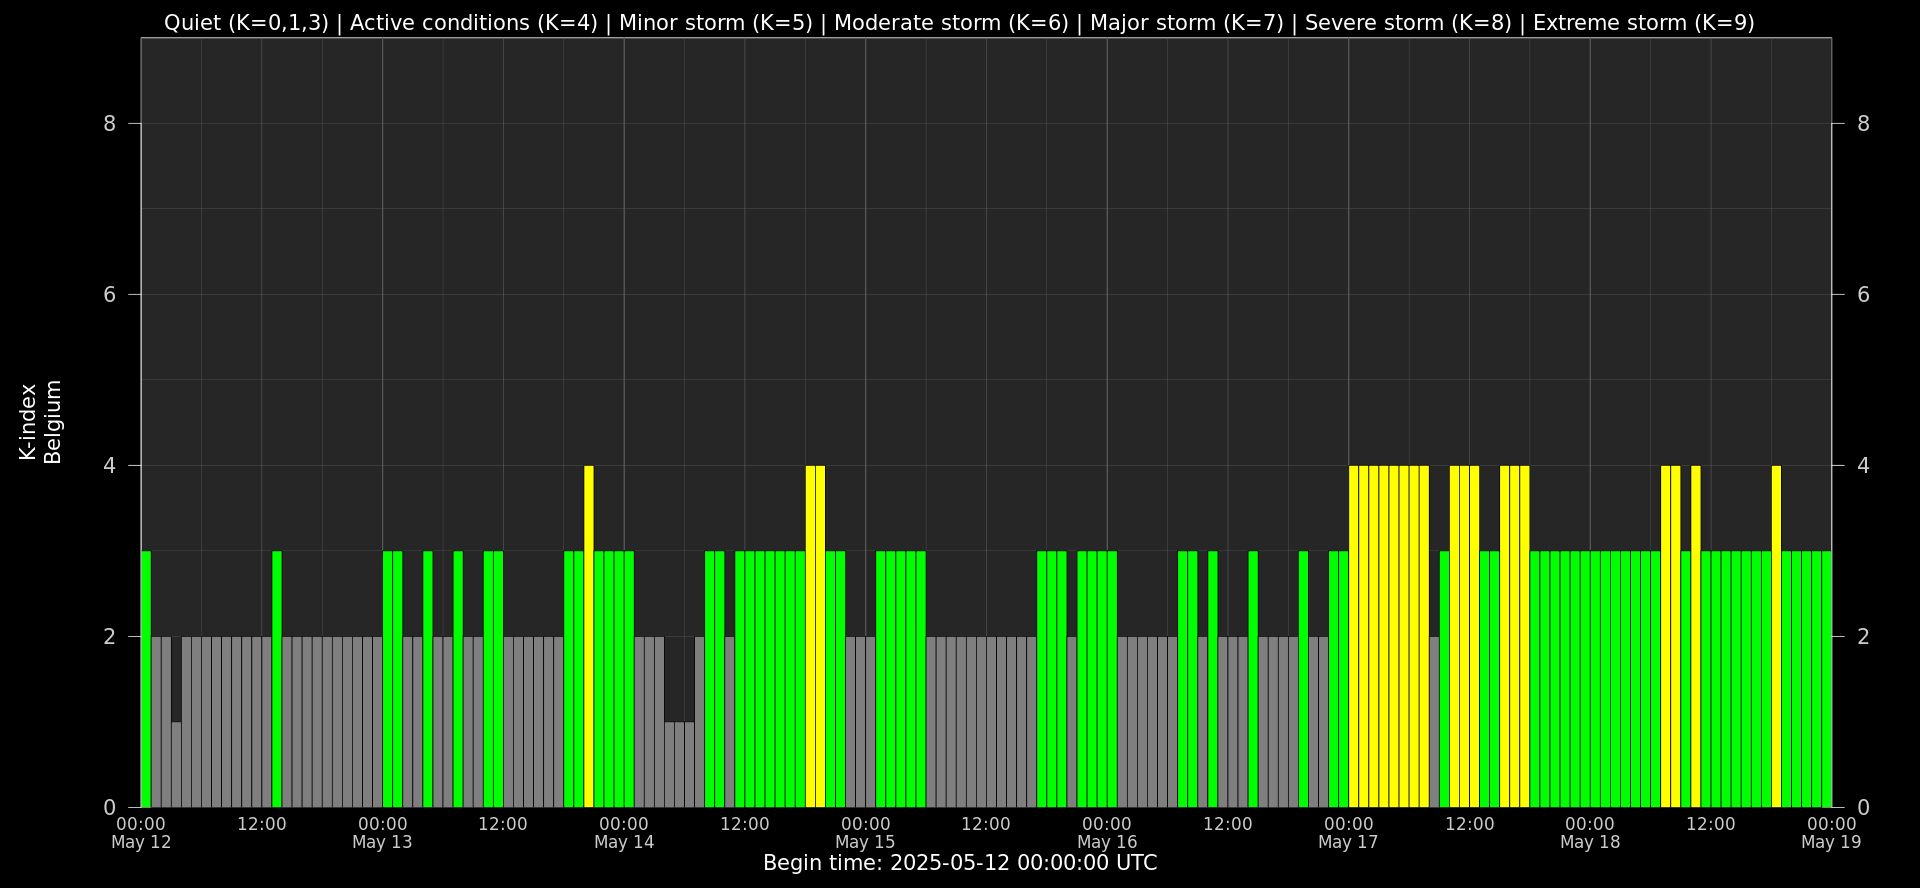
Local K-type magnetic activity index for Belgium based on data from Dourbes (DOU) and Manhay (MAB). Comparing the data from both measurement stations allows to reliably remove outliers from the magnetic data. At the same time the operational service availability is improved: whenever data from one observatory is not available, the single-station index obtained from the other can be used as a fallback system.
Both the two-station index and the single station indices are available here: http://ionosphere.meteo.be/geomagnetism/K_BEL/
The SIDC space weather briefing
The forecaster on duty presented the SIDC briefing that gives an overview of space weather from May 11 to May 18.
The pdf of the presentation: https://www.stce.be/briefings/20250519_SWbriefing.pdf
Review of Ionospheric Activity


VTEC time series at 3 locations in Europe from 12 May 2025 till 18 May 2025
The top figure shows the time evolution of the Vertical Total Electron Content (VTEC) (in red) during the last week at three locations:
a) in the northern part of Europe(N 61deg E 5deg)
b) above Brussels(N 50.5deg, E 4.5 deg)
c) in the southern part of Europe(N 36 deg, E 5deg)
This top figure also shows (in grey) the normal ionospheric behaviour expected based on the median VTEC from the 15 previous days.
The time series below shows the VTEC difference (in green) and relative difference (in blue) with respect to the median of the last 15 days in the North, Mid (above Brussels) and South of Europe. It thus illustrates the VTEC deviation from normal quiet behaviour.
The VTEC is expressed in TECu (with TECu=10^16 electrons per square meter) and is directly related to the signal propagation delay due to the ionosphere (in figure: delay on GPS L1 frequency).
The Sun's radiation ionizes the Earth's upper atmosphere, the ionosphere, located from about 60km to 1000km above the Earth's surface.The ionization process in the ionosphere produces ions and free electrons. These electrons perturb the propagation of the GNSS (Global Navigation Satellite System) signals by inducing a so-called ionospheric delay.
See http://stce.be/newsletter/GNSS_final.pdf for some more explanations; for more information, see https://gnss.be/SpaceWeather
Space Weather Education Center: courses, seminars and events
Courses, seminars, presentations and events with the Sun-Space-Earth system and Space Weather as the main theme. We provide occasions to get submerged in our world through educational, informative and instructive activities.
* May 22, 2025, school visiting 'le centre Belge de Météorologie Spatiale’' Brussels, Belgium
* May 26-27, 2025, STCE Course Space Weather impacts on aviation, online - register: https://events.spacepole.be/event/215/
* Jun 7-9, STCE stand: Dichtbij de Zon, Nerdland Festival, Wachtebeke, Belgium, https://www.nerdlandfestival.be/nl/
* Jun 20, 2025, STCE seminar: The Vigil mission to L5
* Jun 23-25, 2025, STCE Space Weather Introductory Course, Brussels, Belgium - register: https://events.spacepole.be/event/216/
* Sep 15-16, 2025, STCE Course Space Weather impacts on aviation, online - register: https://events.spacepole.be/event/218/
* Oct 23-25, ESWW Space Weather Course by Umea University and STCE, Kiruna, Sweden
* Oct 27-31, European Space Weather Week, Umea, Sweden - https://esww.eu/
* Nov 17-19, 2025, STCE Space Weather Introductory Course, Brussels, Belgium - register: https://events.spacepole.be/event/217/
To register for a course and check the seminar details, navigate to the STCE Space Weather Education Center: https://www.stce.be/SWEC
If you want your event in the STCE newsletter, contact us: stce_coordination at stce.be

Website Space Weather Education Center: https://www.stce.be/SWEC