- Table of Content
- 1.The best of......
- 2.Review of Sola...
- 3.International ...
- 4.PROBA2 Observa...
- 5.Noticeable Sol...
- 6.Geomagnetic Ob...
- 7.Review of Iono...
- 8.The SIDC Space...
- 9.Upcoming Activ...
2. Review of Solar and Geomagnetic Activity
3. International Sunspot Number by SILSO
4. PROBA2 Observations
5. Noticeable Solar Events
6. Geomagnetic Observations in Belgium
7. Review of Ionospheric Activity
8. The SIDC Space Weather Briefing
9. Upcoming Activities at the STCE
The best of... 2024!
A compilation of the most memorable space weather moments of 2024 can be found at the STCE's dedicated solar cycle highlights webpage: https://www.stce.be/highlights Using the versatile Space Weather JHelioviewer (SWHV : https://swhv.oma.be/user_manual/ ) software, a ***MOVIE*** was created containing one or more clips of each event. Usually, images from SDO, GOES, STEREO, and SOHO have been used, occasionally supplemented with imagery from Solar Orbiter, PROBA2, ROB/USET and the GONG/H-alpha network. The movie can be found on YouTube https://www.youtube.com/watch?v=1FSN-mqa7WM, whereas the page with the accompanying information is at https://www.stce.be/news/769/welcome.html
We wish you a happy viewing!
Review of Solar and Geomagnetic Activity
WEEK 1273 from 2025 May 19
Solar Active Regions and flares
Solar flaring activity was low to moderate in the beginning of the week, with one M-class flare on May 19 and another M-class flare on May 21. High flaring activity was observed on May 24-25, with four M-class flares and one X-class flare. In total, six M-class flares and one X-class flare were recorded during the week. The strongest flare was an X1.1 flare peaking at 01:52 UTC on May 25, associated with SIDC Sunspot Group 506 (NOAA Active Region 4098, magnetic type beta-gamma-delta).
There was a total of thirteen active regions (ARs) on the visible disk during the week. The most complex ones, at different times during the week, were SIDC Sunspot Group 496 (NOAA Active Region 4087, magnetic type beta-delta and later beta-gamma); SIDC Sunspot Group 504 (NOAA 4095, magnetic type beta-gamma); SIDC Sunspot Group 505 (NOAA Active Region 4097, magnetic type beta-gamma); and SIDC Sunspot Group 506 (NOAA Active Region 4098, magnetic type beta-gamma-delta).
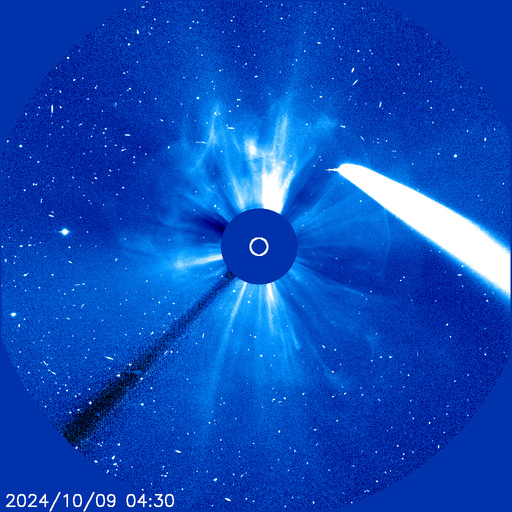
Coronal mass ejections
A few Coronal Mass Ejections (CMEs) were detected during the week but were either events near the west or east limb or backsided and had no impact on Earth. A halo CME (SIDC CME 506) was observed around 17:30 UTC on May 23 in LASCO/C2 and LASCO/C3 coronagraph imagery. A partial halo CME (SIDC CME 507) was observed around 08:30 UTC on May 24 in LASCO/C2 coronagraph imagery. Both events were backsided and did not impact Earth.
A wide CME (SIDC CME 500) was observed in LASCO/C2 and LASCO/C3 coronagraph imagery starting from 00:24 UTC on May 19, lifting off the northwest quadrant. The CME was most likely associated with a long filament eruption observed in SDO/AIA 304 data around 21:48 UTC on May 18 near the central meridian, in the mid-latitude northern hemisphere. It did not impact Earth. A few filament eruptions were observed in SDO/AIA 304 data during the week, but either no associated CME was observed in the available coronagraph imagery, or it was not Earth-directed.
Coronal Holes
Three coronal holes have crossed the central meridian during the last week. The first (SIDC Coronal Hole 104) was an elongated, southern, positive polarity coronal hole that crossed the central meridian on May 15. The second (SIDC Coronal Hole 115) was an equatorial, positive polarity coronal hole that crossed the central meridian on May 22. The third (returning SIDC Coronal Hole 99) was an equatorial, negative polarity coronal hole that crossed the central meridian on May 25.
Proton flux levels
The greater than 10 MeV proton flux was below the 10 pfu threshold throughout the week.
Electron fluxes at GEO
The greater than 2 MeV electron flux as measured by GOES 18 and GOES 19 was above the threshold at different times during the week, following a diurnal variation. The 24-hour electron fluence was mostly at nominal levels throughout the week, reaching moderate levels on May 24.
Solar wind
The solar wind conditions were enhanced at the beginning of the week, under the continuous influence of a high-speed stream from the elongated, southern, positive polarity coronal hole (SIDC Coronal Hole 104) that first crossed the central meridian on May 15. The solar wind speed reached a maximum of 680 km/s, returning to around 380 km/s towards the end of the week. The interplanetary magnetic field was between 5 nT and 11 nT. The Bz component reached a minimum of -7 nT. The interplanetary magnetic field angle phi was mostly in the positive sector.
Geomagnetism
Geomagnetic conditions globally and locally were mostly at unsettled levels (NOAA Kp 3, K BEL 3) in the beginning of the week, with a brief interval of active conditions (NOAA Kp 4, K BEL 4) on May 20-21.
Mostly quiet conditions were observed globally (NOAA Kp 1+ to 2-) for the rest of the week. Mostly quiet conditions, with isolated intervals of unsettled conditions (K BEL 3) on May 22-23, were observed locally for the rest of the week.
International Sunspot Number by SILSO

The daily Estimated International Sunspot Number (EISN, red curve with shaded error) derived by a simplified method from real-time data from the worldwide SILSO network. It extends the official Sunspot Number from the full processing of the preceding month (green line), a few days more than one solar rotation. The horizontal blue line shows the current monthly average. The yellow dots give the number of stations that provided valid data. Valid data are used to calculate the EISN. The triangle gives the number of stations providing data. When a triangle and a yellow dot coincide, it means that all the data is used to calculate the EISN of that day.
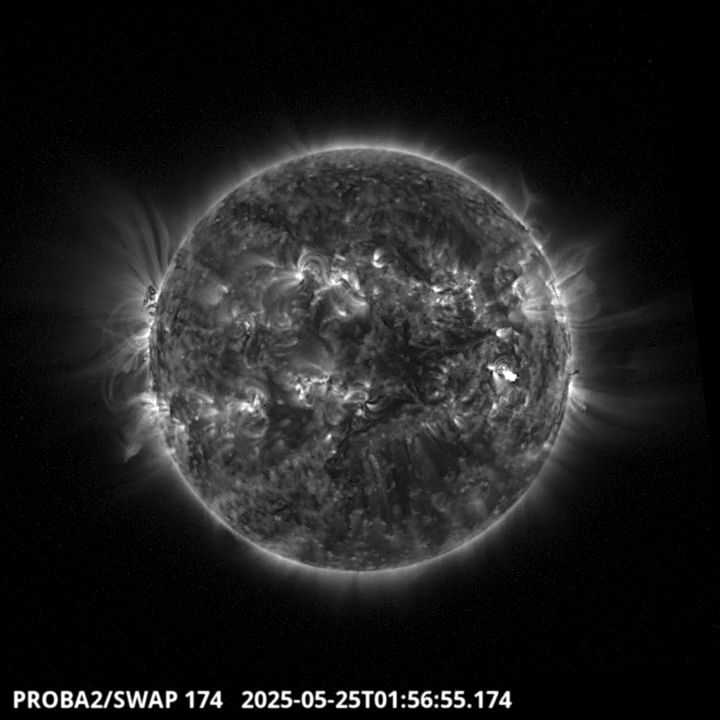
PROBA2 Observations
Solar Activity
Solar flare activity fluctuated from low to high during the week.
In order to view the activity of this week in more detail, we suggest to go to the following website from which all the daily (normal and difference) movies can be accessed: https://proba2.oma.be/ssa
This page also lists the recorded flaring events.
A weekly overview movie (SWAP week 791) can be found here: https://proba2.sidc.be/swap/data/mpg/movies/weekly_movies/weekly_movie_2025_05_19.mp4.
Details about some of this week's events can be found further below.
If any of the linked movies are unavailable they can be found in the P2SC movie repository here: https://proba2.oma.be/swap/data/mpg/movies/.
Sunday May 25
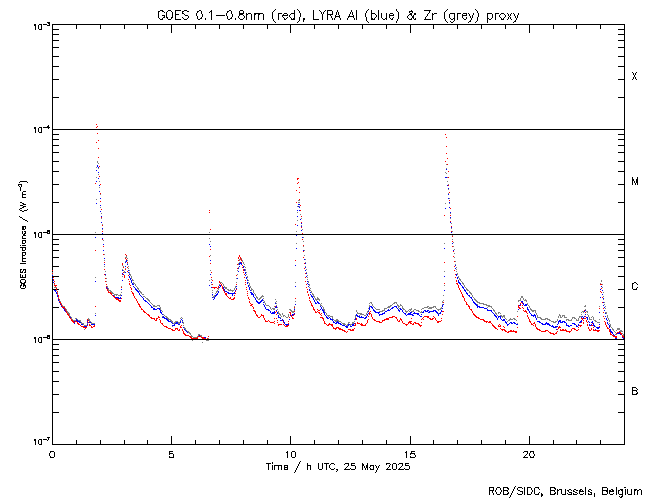
The largest flare of this week was an X1.1, and it was observed by LYRA (top panel) and SWAP (bottom panel). The flare peaked on 2025-Apr-25 at 01:52 UT and occurred in the western hemisphere of the Sun, originating from active region NOAA4098.
Find a SWAP movie of the event here: https://proba2.sidc.be/swap/movies/20250525_swap_movie.mp4.
Noticeable Solar Events
| DAY | BEGIN | MAX | END | LOC | XRAY | OP | 10CM | TYPE | Cat | NOAA |
| 19 | 0813 | 0821 | 0826 | M3.2 | III/2 | |||||
| 21 | 0001 | 0008 | 0010 | N18W21 | M1.2 | SN | 69 | 4087 | ||
| 24 | 2014 | 2023 | 2029 | S5W41 | M2.1 | 1 | 4098 | |||
| 25 | 0146 | 0152 | 0157 | X1.1 | III/2 | 4098 | ||||
| 25 | 0627 | 0635 | 0638 | M1.7 | 4098 | |||||
| 25 | 1005 | 1018 | 1025 | S5W50 | M3.4 | 1N | 4098 | |||
| 25 | 1618 | 1630 | 1636 | S5W54 | M8.9 | 2B | III/1 | 4098 |
| LOC: approximate heliographic location | TYPE: radio burst type |
| XRAY: X-ray flare class | Cat: Catania sunspot group number |
| OP: optical flare class | NOAA: NOAA active region number |
| 10CM: peak 10 cm radio flux |
Geomagnetic Observations in Belgium

Local K-type magnetic activity index for Belgium based on data from Dourbes (DOU) and Manhay (MAB). Comparing the data from both measurement stations allows to reliably remove outliers from the magnetic data. At the same time the operational service availability is improved: whenever data from one observatory is not available, the single-station index obtained from the other can be used as a fallback system.
Both the two-station index and the single station indices are available here: http://ionosphere.meteo.be/geomagnetism/K_BEL/
Review of Ionospheric Activity
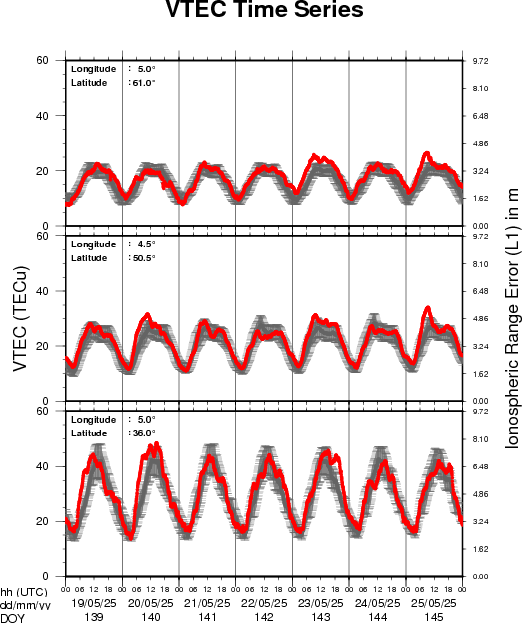

VTEC time series at 3 locations in Europe from 19 May 2025 till 25 May 2025
The top figure shows the time evolution of the Vertical Total Electron Content (VTEC) (in red) during the last week at three locations:
a) in the northern part of Europe(N 61deg E 5deg)
b) above Brussels(N 50.5deg, E 4.5 deg)
c) in the southern part of Europe(N 36 deg, E 5deg)
This top figure also shows (in grey) the normal ionospheric behaviour expected based on the median VTEC from the 15 previous days.
The time series below shows the VTEC difference (in green) and relative difference (in blue) with respect to the median of the last 15 days in the North, Mid (above Brussels) and South of Europe. It thus illustrates the VTEC deviation from normal quiet behaviour.
The VTEC is expressed in TECu (with TECu=10^16 electrons per square meter) and is directly related to the signal propagation delay due to the ionosphere (in figure: delay on GPS L1 frequency).
The Sun's radiation ionizes the Earth's upper atmosphere, the ionosphere, located from about 60km to 1000km above the Earth's surface.The ionization process in the ionosphere produces ions and free electrons. These electrons perturb the propagation of the GNSS (Global Navigation Satellite System) signals by inducing a so-called ionospheric delay.
See http://stce.be/newsletter/GNSS_final.pdf for some more explanations; for more information, see https://gnss.be/SpaceWeather
The SIDC Space Weather Briefing
The forecaster on duty presented the SIDC briefing that gives an overview of space weather from 19 to 24 May.
The pdf of the presentation can be found here: https://www.stce.be/briefings/20250526_SWbriefing.pdf
Upcoming Activities at the STCE
Courses, seminars, presentations and events with the Sun-Space-Earth system and Space Weather as the main theme. We provide occasions to get submerged in our world through educational, informative and instructive activities.
* Jun 7-9, STCE stand: Dichtbij de Zon, Nerdland Festival, Wachtebeke, Belgium, https://www.nerdlandfestival.be/nl/
* Jun 20, 2025, STCE seminar: The Vigil mission to L5
* Jun 23-25, 2025, STCE Space Weather Introductory Course, Brussels, Belgium - register: https://events.spacepole.be/event/216/
* Sep 15-16, 2025, STCE Course Space Weather impacts on aviation, online - register: https://events.spacepole.be/event/218/
* Oct 23-25, ESWW Space Weather Course by Umea University and STCE, Kiruna, Sweden
* Oct 27-31, European Space Weather Week, Umea, Sweden - https://esww.eu/
* Nov 17-19, 2025, STCE Space Weather Introductory Course, Brussels, Belgium - register: https://events.spacepole.be/event/217/
To register for a course and check the seminar details, navigate to the STCE Space Weather Education Center: https://www.stce.be/SWEC
If you want your event in the STCE newsletter, contact us: stce_coordination at stce.be
Website: https://www.stce.be/SWEC