- Table of Content
- 1.Fast CME, seve...
- 2.Dive together ...
- 3.Space Weather ...
- 4.Review of spac...
- 5.PROBA2 Observa...
- 6.International ...
- 7.Noticeable Sol...
- 8.Geomagnetic Ob...
- 9.The SIDC space...
- 10.Review of Iono...
- 11.Trainings, pre...
2. Dive together with us into the Sun
3. Space Weather Training prior to ESWW2025
4. Review of space weather
5. PROBA2 Observations
6. International Sunspot Number by SILSO
7. Noticeable Solar Events
8. Geomagnetic Observations in Belgium
9. The SIDC space weather briefing
10. Review of Ionospheric Activity
11. Trainings, presentations and activities
Fast CME, severe geomagnetic storm
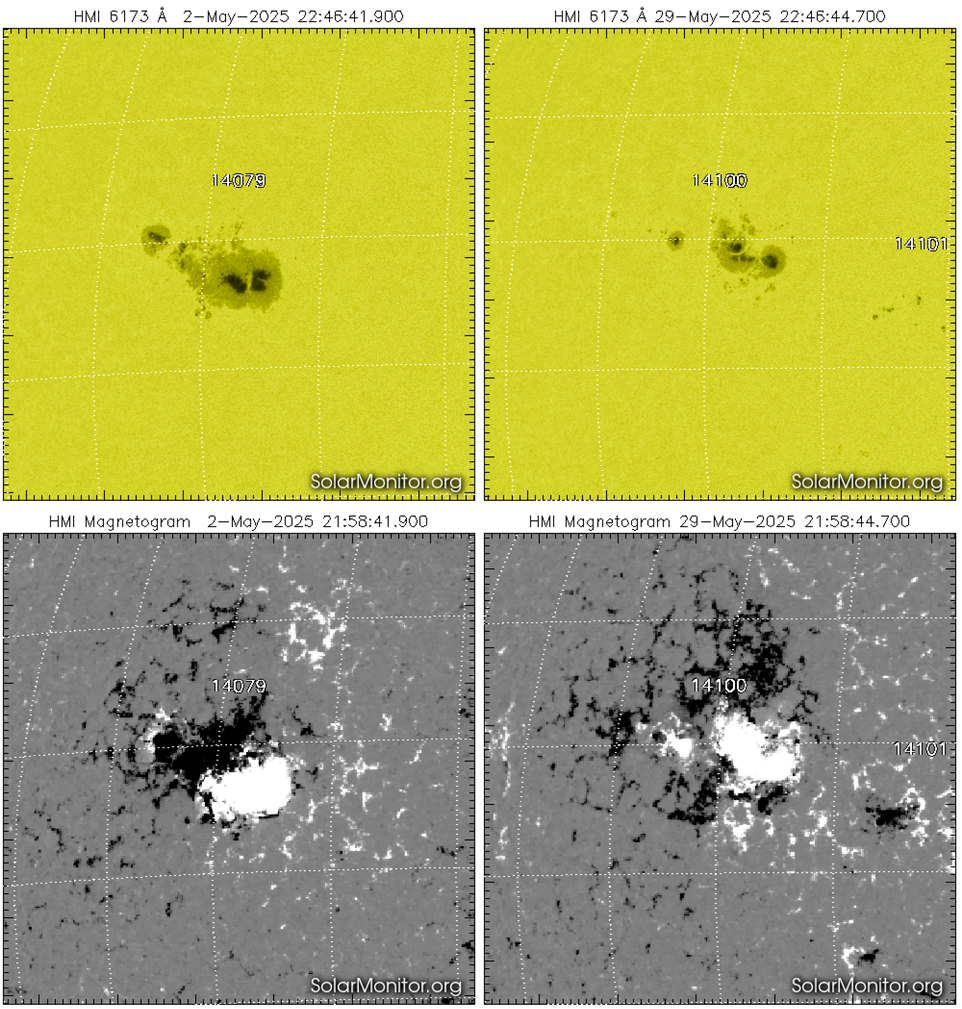
NOAA 4100 (SIDC Sunspot Group 469) is the return of NOAA 4079 that appeared just one solar rotation ago (see the STCE newsitem at https://www.stce.be/news/764/welcome.html ). Despite its huge size and (protected) naked eye visibility, that group produced only a handful of M-class flares. Then, from about 29 May onwards, the large main sunspot of NOAA 4100 started to break down in several smaller sunspots. During this decaying process, the magnetic restructuring caused interaction with small, peripheral sunspots with opposite magnetic polarity. Several M-class flares have been the result, at different locations around the main spot. The white light images underneath (SDO) show the sunspot group early May (NOAA 4079) and late May (NOAA 4100), with a magnetogram showing how that huge sunspot was of the same magnetic polarity (white, "positive", i.e. magnetic field lines leaving the Sun).
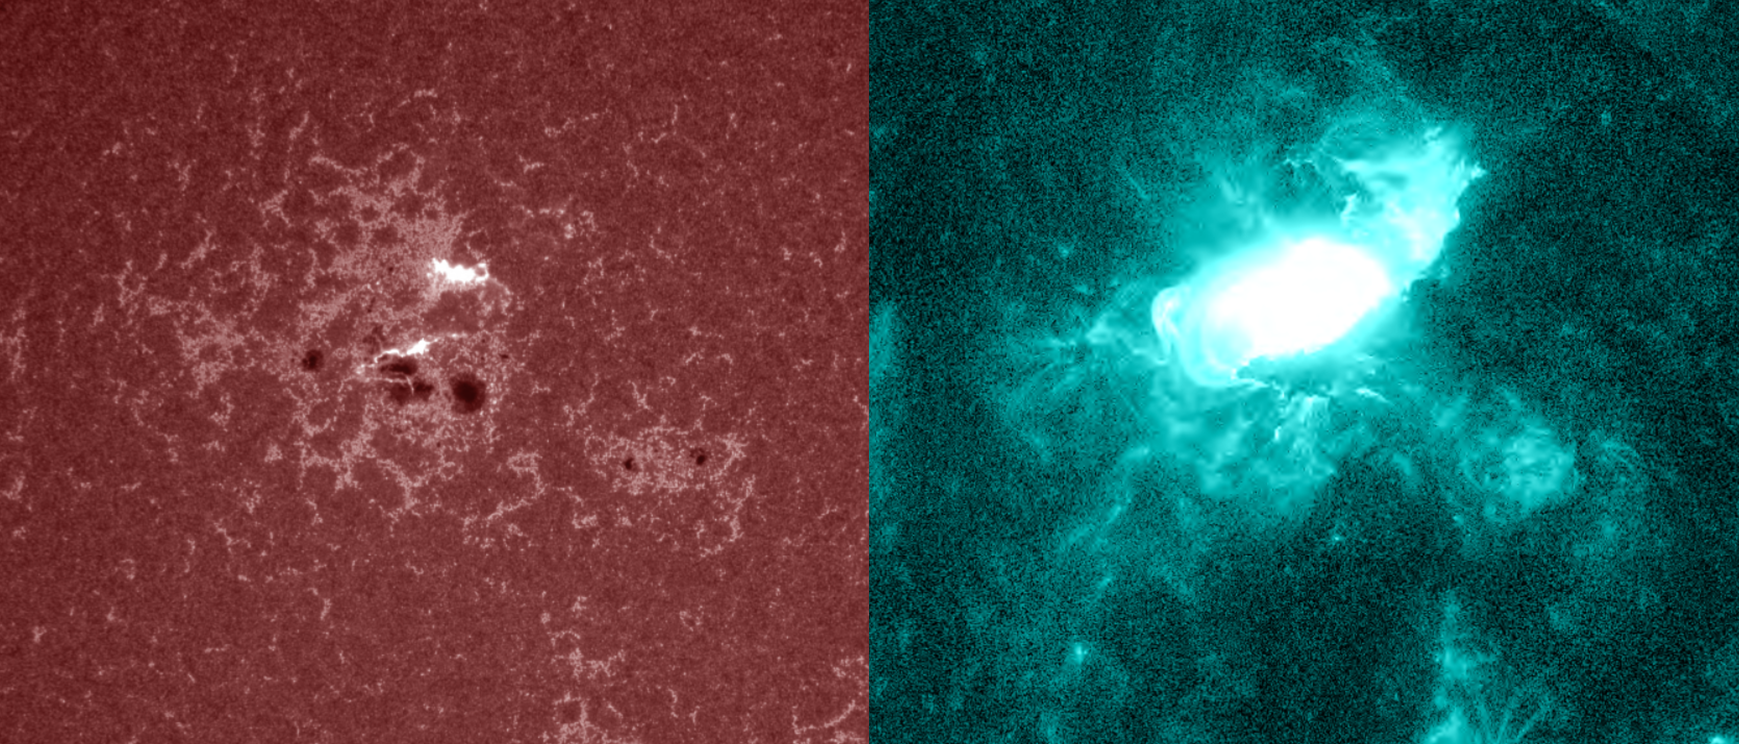
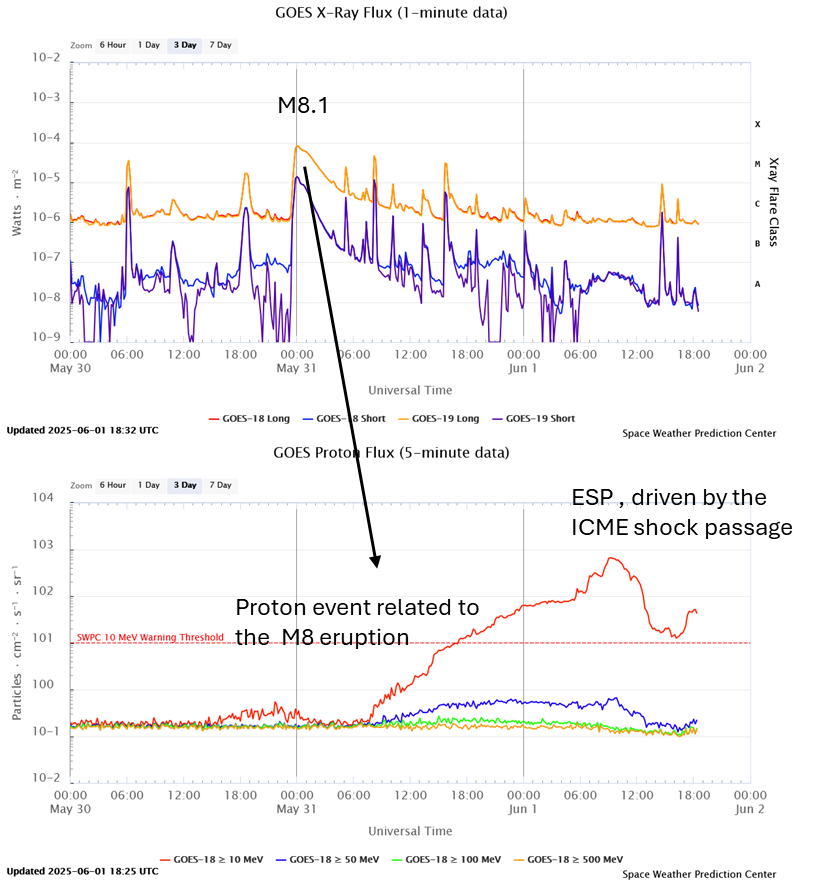
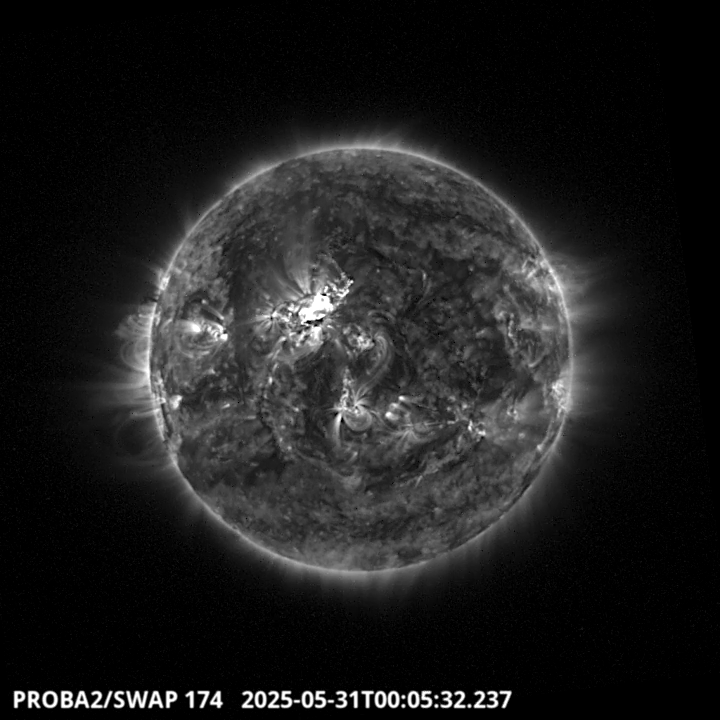
The strongest event was a long duration (2 hours!) M8.1 flare peaking at 00:05UTC on 31 May (GOES). The imagery underneath shows this M-class flare in extreme ultraviolet near the time of its maximum intensity. First on the left there's a SDO/AIA 1700 image which shows well the flare ribbons location with respect to the main spots of NOAA 4100. On the right is an image of the same area but at multimillion degrees (SDO/AIA 131). More clips of this event can be found in the related STCE newsflash at https://www.stce.be/news/771/welcome.html
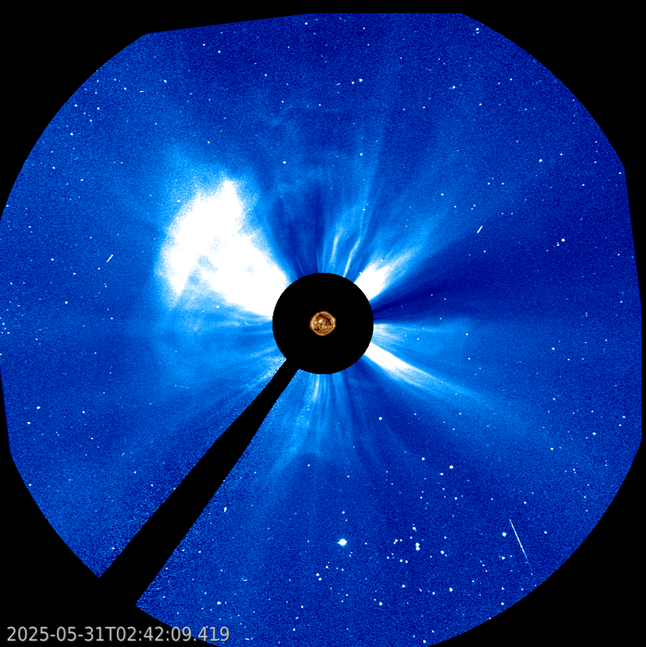
The eruption was also associated with a fast, earth-directed coronal mass ejection (see the SOHO/LASCO C3 image underneath). From the SIDC space weather forecaster's PRESTO messages: "A halo coronal mass ejection (CME) was first detected in SOHO/LASCO-C2 images from 01:36UTC on May 31. This CME was associated with a long duration M8.1 flare peaking on May 31 at 00:05 UTC, which was produced by SIDC Sunspot Group 469 (NOAA Active Region 4100). ... The CME has an estimated speed of over 1300 km/s and is expected to be Earth directed. ..." The arrival of the CME at Earth was expected for around noon on 1 June, and in view of the CME's speed, the duration of the flaring event, and the possible interaction of this CME with a preceding, slower CME ("CME cannibalism"), a moderate to severe geomagnetic storm (i.e. Kp = 6 to 8) was expected.
The interplanetary coronal mass ejection (ICME) associated with the M8 flare arrived after only 29 hours. A strong shock was indeed registered by DSCOVR around 05:25UTC on 1 June (chart underneath), with a significant jump observed in the solar wind speed (yellow curve), temperature (green), and magnetic field strength (white). It is less obvious in solar wind density (orange), maybe because the earth environment was still under the influence of a coronal hole high-speed low-density wind stream. Nonetheless, the solar wind speed jumped from 770 km/s to 970 km/s, and would briefly reach even 1100 km/s around 12 UTC on 1 June. That's an unusual high speed for the solar wind near the earth environment. Bz (red curve; the north-south component of the interplanetary magnetic field) made a few excursions to -20 nT, before turning strongly positive as the core of the ICME passed by.
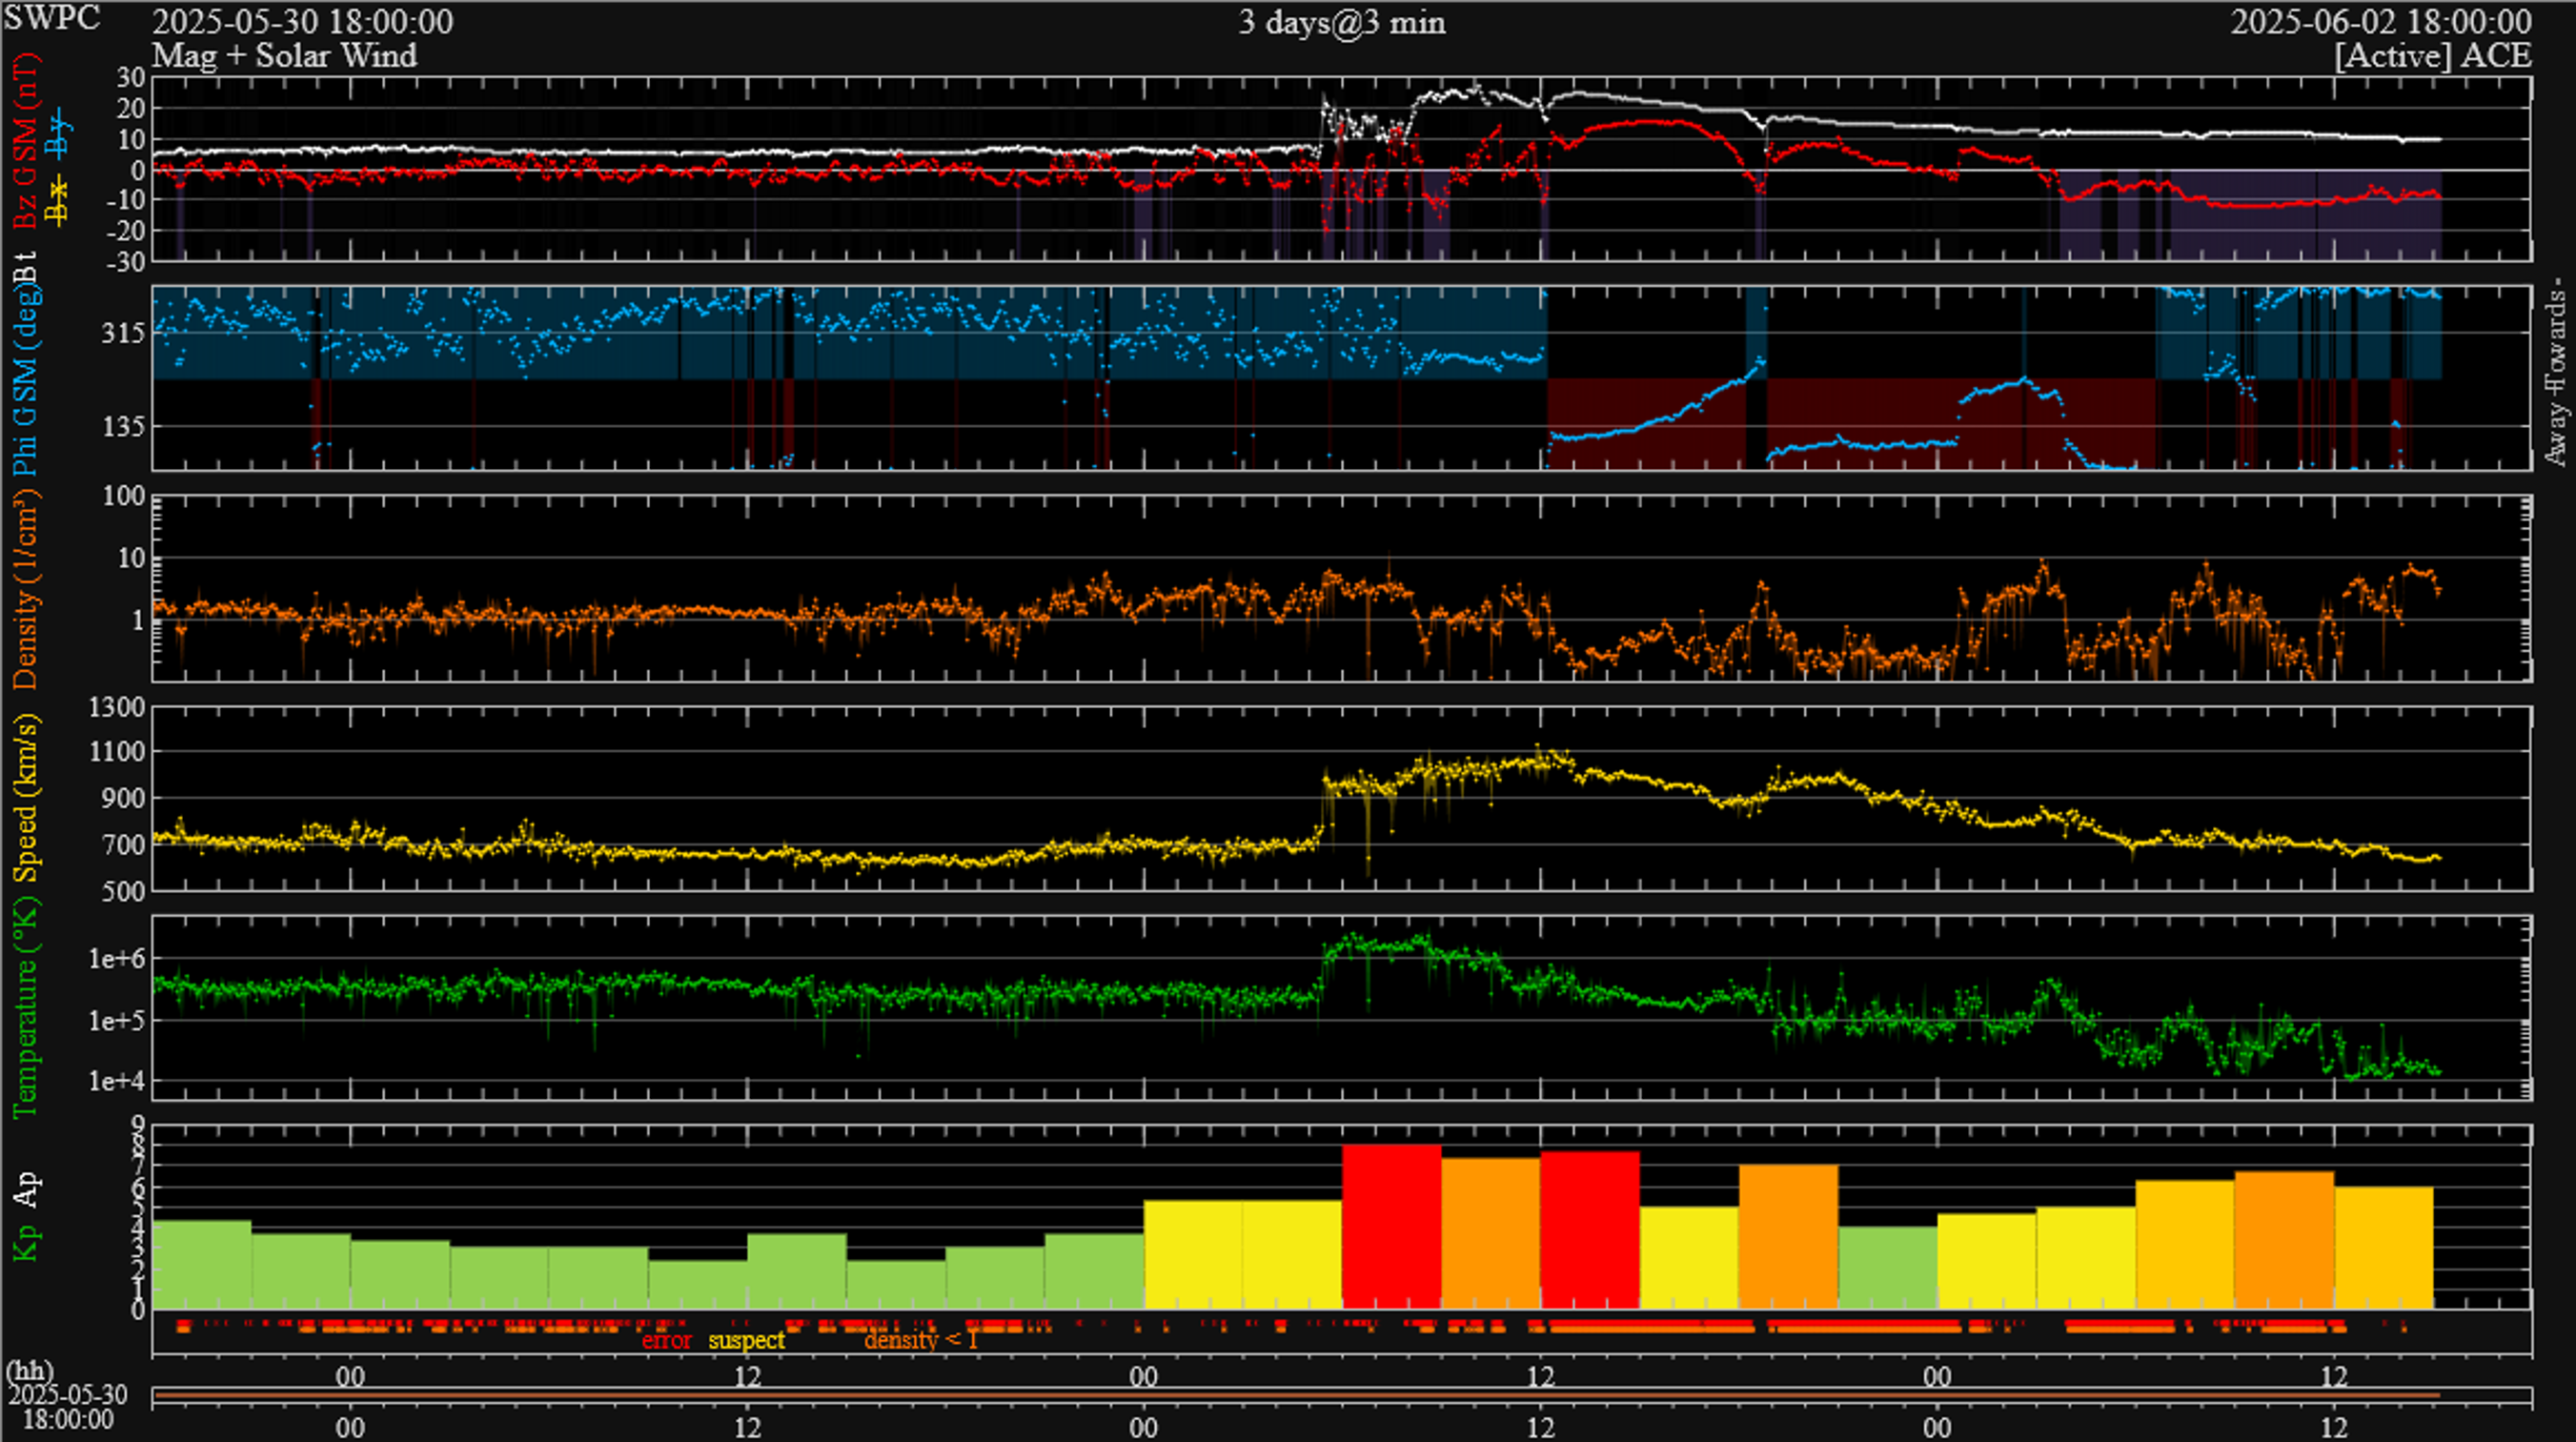
Positive Bz values usually do not favor a strong interaction with the earth's magnetic field. Despite that given, the geomagnetic conditions still reached severe levels between 09 and 15 UTC on 1 June (GFZ/Potsdam preliminary Kp of 8-; NOAA estimated Kp of 8; see chart above). As the earth environment then entered the trailing portion of the ICME, Bz turned negative from early on 2 June, at relatively stable values of -10 nT. Geomagnetic activity became enhanced again, and Kp reached strong levels (Kp = 7). The local K index at Dourbes (K_BEL ; http://ionosphere.meteo.be/geomagnetism/K_BEL/ ) did not exceed moderate levels (K_BEL = 6). Also the Dst index (Disturbance storm time ; https://www.stce.be/educational/classification#geomag ) only reached -120 nT, a meager value compared to the -406 nT of the great May 2024 storm. In the USA, aurora were seen and photographed as far south as California and New Mexico. Also New-Zealand got a glimpse of the show. The storm was over its top by nightfall for Europe, so no (or no spectacular) auroras were observed from the European mid- and southern latitudes.
Of note too is that a moderate proton event (or "Solar Energetic Particle (SEP) event" when also considering heavy ions and other particles) was associated with the eruption early on 31 May. The maximum proton flux was driven by the passing ICME shock, a so-called Energetic Storm Particle event ("ESP event"). The greater than 10 MeV proton flux eventually reached a maximum of 666 pfu at 09:10UTC on 1 June (GOES; see annotated chart underneath). Some degradation of High Frequency communication (3-30 MHz) over the north polar region was reported. The flux of very energetic protons (100 MeV or more) remained mostly at background levels, so no strong impacts e.g. on satellites or for astronauts were observed.
Dive together with us into the Sun
The Belgian science festival Nerdland is the place to be for young and old science nerds. It starts on June 6 and runs until June 9. A huge solar mosaic from the EUI instrument onboard Solar Orbiter will be shown: https://www.nerdlandfestival.be/nl/programma/duik-mee-in-de-zon.
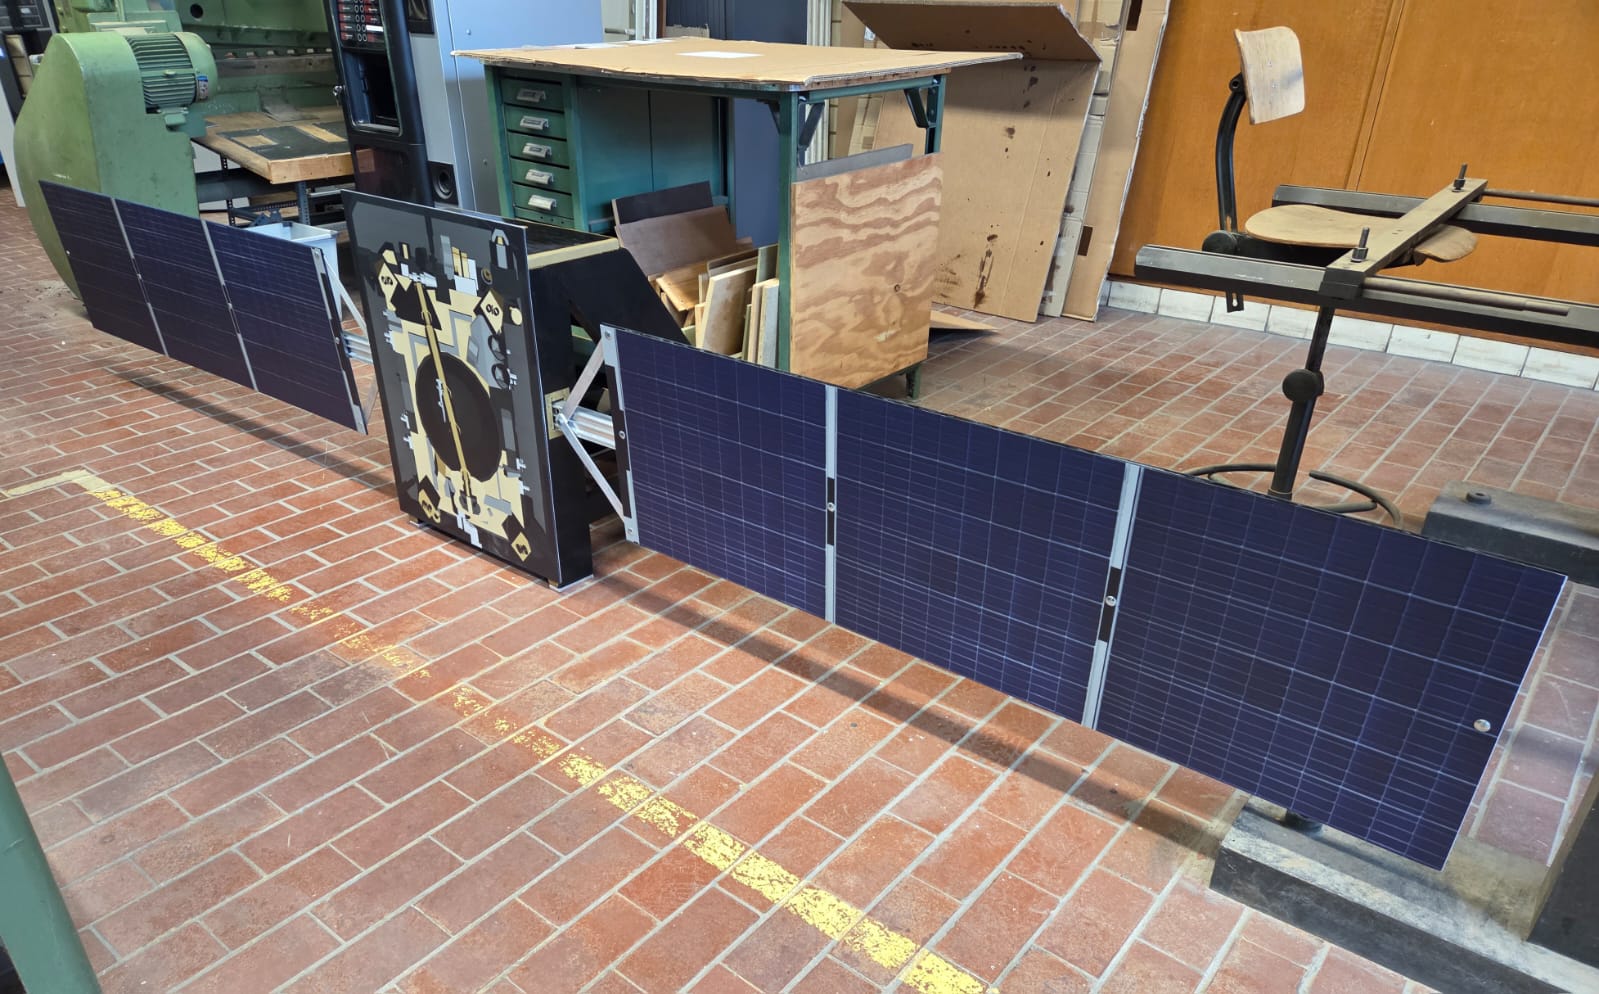
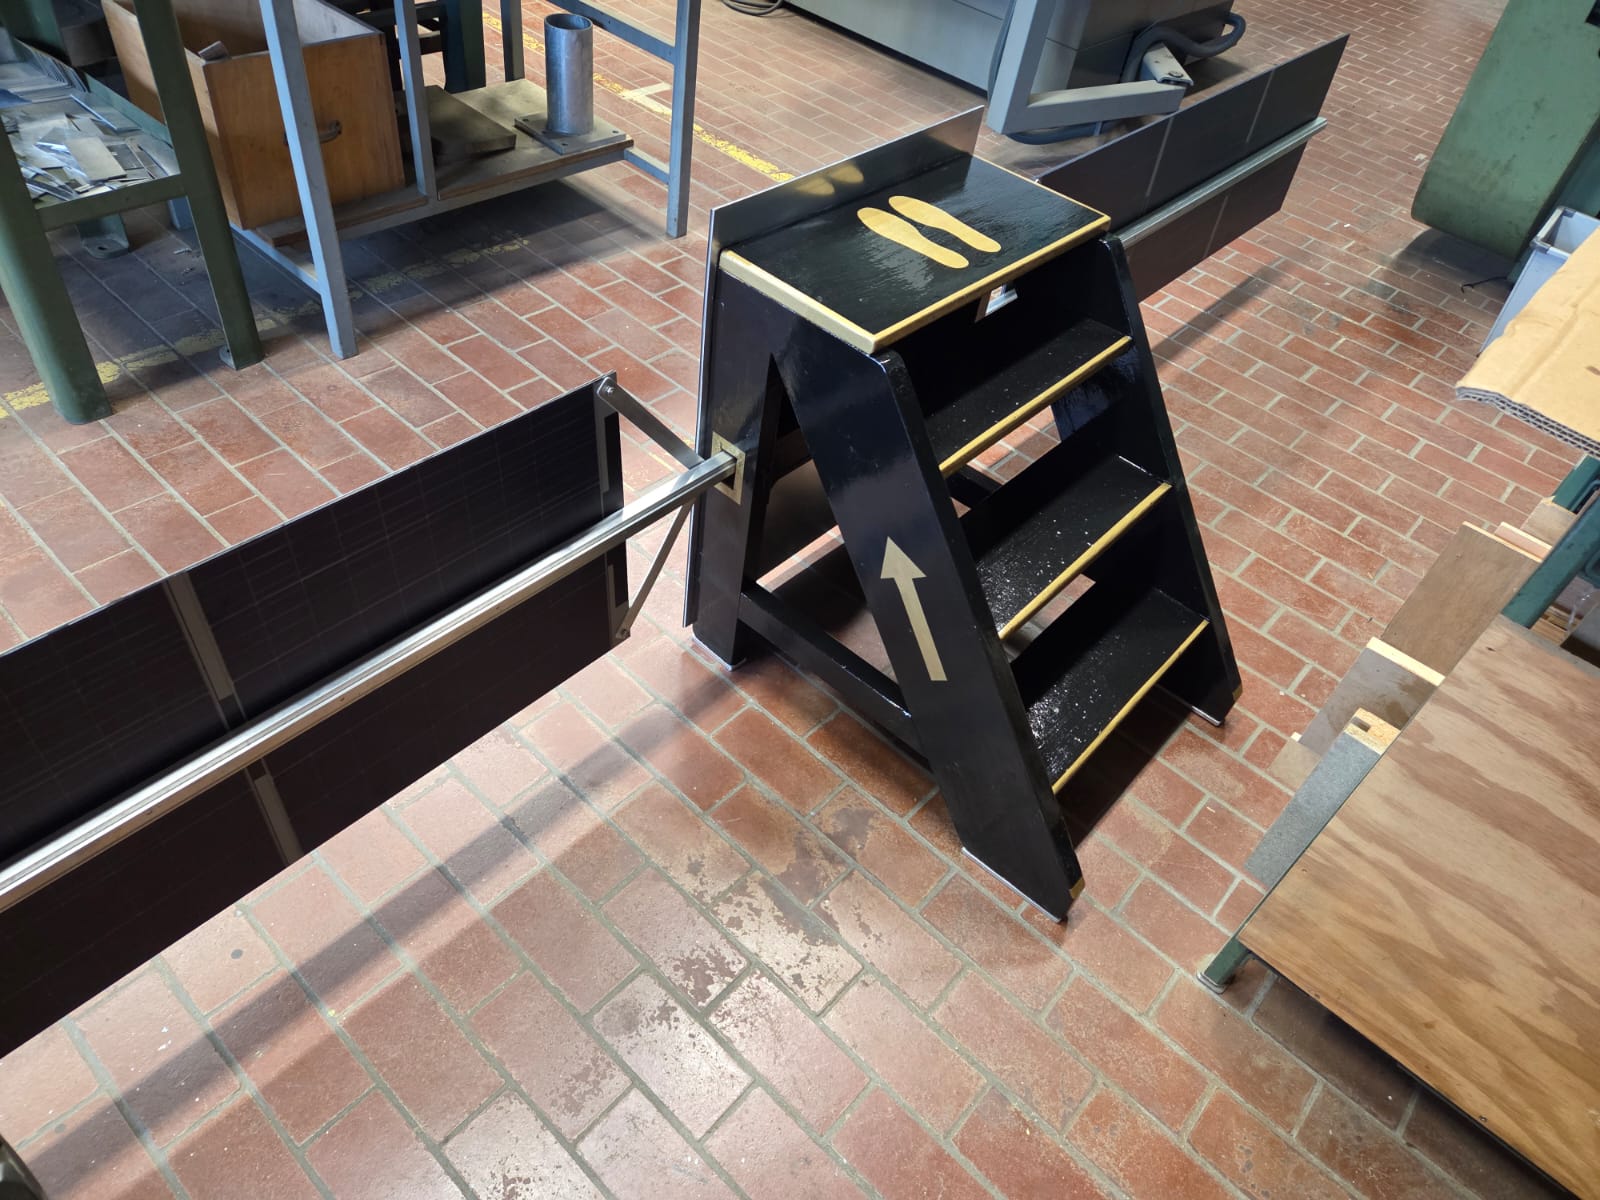
Visitors can come really close to the details of the Sun shown on a huge, 6 x 6 meter canvas. Solar Orbiter will be present and is being prepared for shipping.
Previous week, we already tested how it feels to orbit the sun while taking pictures. Eighteen very young and two adult solar orbiters were approved.
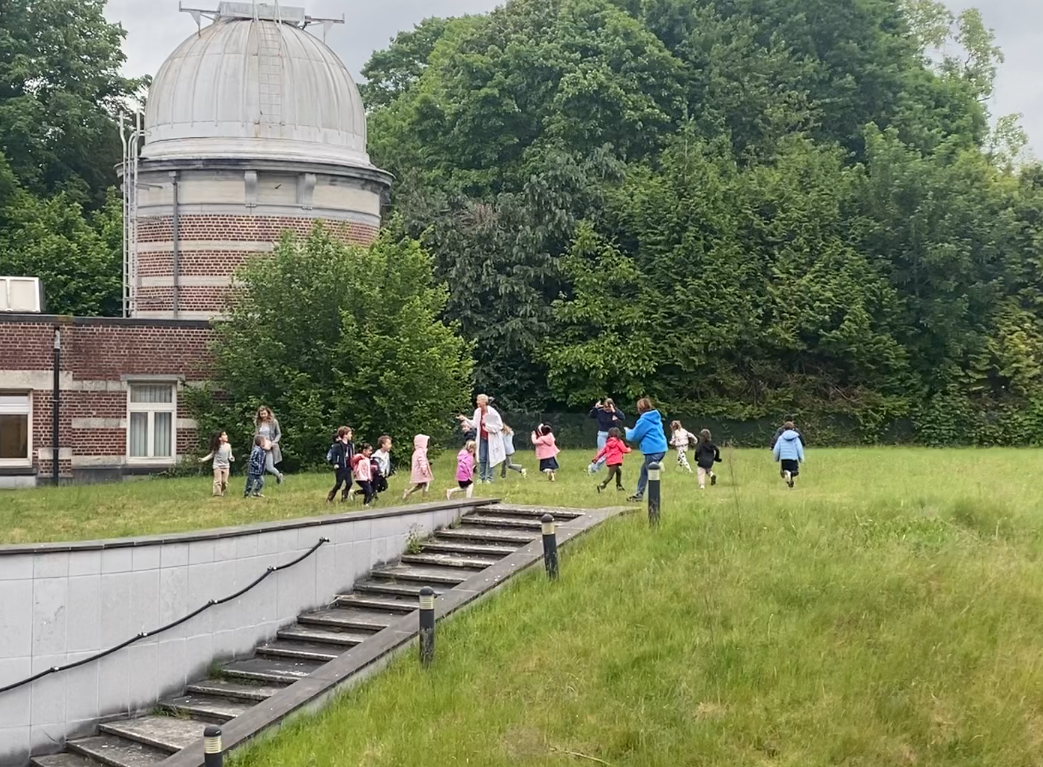
Click here to see the solar orbiters in action: https://stce.be/movies/SolarOrbiters.MOV
On the science festival, visitors can fly together with Solar Orbiter by simply stepping onboard.
Space Weather Training prior to ESWW2025
Apply, apply, as fast as you can for the space weather training in Kiruna, Sweden, 23rd Oct to Sunday 26th: https://esww.eu/school/application
A detailed program will be provided later: https://esww.eu/school/school-programme
All participants will be brought by train from Kiruna to Umea on Sunday 26th.
Review of space weather
Solar Active Regions (ARs) and flares
Solar flaring activity ranged from low to high over the week, with multiple M-class flares recorded. There were 15 numbered regions on disk over the week, but many of this were magnetically simple. At the start of the week on May 26, solar activity was at moderate levels and SIDC Sunspot Group 506 (NOAA Active Region 4098) was responsible for much of the flaring activity, including an M2.9 flare (SIDC flare 4467) with peak time 13:06 UTC on May 26. This region rotated over the west limb on May 27. On May 27 to May 29 solar activity was at low levels but increased again to reach high levels on May 31, due to the multiple M-class flares produced by SIDC sunspot group 469 (NOAA AR 4100). The largest of which was a long duration M8.1 flare (SIDC Flare 4506) peaking on May 31 at 00:05 UTC. This region began to increase in complexity from May 29, and had magnetic type Beta-Gamma-delta by May 31. SIDC sunspot group 490 (NOAA AR 4104) emerged on May 30 and also produced an M1.6 flare (SIDC flare 4498) on this day. SIDC Sunspot group 508 (NOAA Active region 4099) was the other magnetically complex region on disk over the week but only produced C-class flares.
Coronal mass ejections
A halo coronal mass ejection (CME) was detected in SOHO/LASCO-C2 images from 01:36 on May 31. This CME was associated with the long duration M8.1 flare (SIDC Flare 4506) peaking on May 31 at 00:05 UTC, which was produced by SIDC Sunspot Group 469 (NOAA Active Region 4100). This event was associated with a Type II radio emission and was predicted to impact Earth on June 01.
Coronal Holes
An extended negative polarity equatorial coronal hole connecting to the northern polar coronal hole (combined SIDC Coronal Hole 116 and 112) began to transit the central meridian on May 26.
Proton flux levels
The greater than 10 MeV proton flux as measured by GOES 18 was at background levels at the start of the week but started to increase gradually from 07:30 UTC on May 31 and passed the 10 pfu threshold at 17:10 UTC on May 31. This increase is likely associated with M8.1 flare (SIDC Flare 4506). The flux continued to increase and from 05:30 UTC June 01 crossed the 100 pfu threshold. The proton flux reached a maximum of 666 pfu at 09:10 UTC June 01, before decreasing slightly later on June 01.
Electron fluxes at GEO
The greater than 2 MeV electron flux measured by GOES 19 was near the 1000 pfu threshold on May 26 before reducing to nominal levels between May 27 and May 29. The electron flux then began to increase and exceeded the 1000 pfu threshold on May 30 and 31, due to the influence of the high-speed stream. The flux then dropped sharply from early on June 01, due to the disturbance caused by the ICME arrival and were at nominal levels by the end of June 01.
Solar wind
The solar wind parameters reflected a general slow solar wind regime on May 26 and most of May 27.
A high-speed stream associated with the small equatorial coronal hole, which cross the central meridian on May 25, arrived at Earth late on May 27. The solar wind speed increased from 400 km/s to 640 km/s around 02:50 UTC May 28.
The interplanetary magnetic field phi angle switched to the negative sector from 13:20 UTC May 27.
The solar wind speed started to decline again on May 28, before a second high speed steam arrived on May 29 associated with the extended negative polarity coronal hole (combined SIDC Coronal Hole 116 and 112) that began to transit the central meridian on May 26. At this time, the solar wind speed increased from 380 km/s to values above 700 km/s and remained around 700 km/s between May 29 and May 31. The interplanetary magnetic field increased around 00:00 UTC May 29, due to the high-speed stream arrival and had a maximum value of 24 nT. The Bz component reached a minimum value of -24 nT at this time. The magnetic field strength then reduced to stabilise around 6nT on May 30 and May 31.
On June 01, a strong shock was registered at 05:27UTC, when the solar wind speed jumped from 770 km/s to 980 km/s, indicating the arrival of an ICME associated with the observed halo CME of May 31. The total interplanetary magnetic field values increased from 6nT to 26nT and Bz reached -24nT. The solar wind speed continued to gradually increase and was above 1000 km/s for much of June 01.
Geomagnetism
Geomagnetic conditions were at quiet to unsettled levels on May 26 and reached active conditions on May 27 and 28 due to the first High Speed Stream (HSS) arrival. Major storm levels were then reached globally (Kp 7-) between 00:00 UTC and 03:00 UTC on May 29, due to the arrival of the second stronger HSS. The geomagnetic conditions then reduced to active to moderate storm conditions on May 30 and 31, while Earth remained under the HSS influence. On June 01, severe storm conditions were reached globally (Kp 8), between 06:00 to 09:00 UTC and (Kp 8-), between 12:00 to 15:00 UTC on June 01. This was due to the ICME arrival of the halo CME. Locally only moderate storm conditions were observed (K Bel 6) at this time.
PROBA2 Observations
Solar Activity
Solar flare activity fluctuated from low to moderate during the week.
In order to view the activity of this week in more detail, we suggest to go to the following website from which all the daily (normal and difference) movies can be accessed: https://proba2.oma.be/ssa
This page also lists the recorded flaring events.
A weekly overview movie (SWAP week 792) can be found here: https://proba2.sidc.be/swap/data/mpg/movies/weekly_movies/weekly_movie_2025_05_26.mp4.
Details about some of this week's events can be found further below.
If any of the linked movies are unavailable they can be found in the P2SC movie repository here: https://proba2.oma.be/swap/data/mpg/movies/.
Friday-Saturday May 30-31
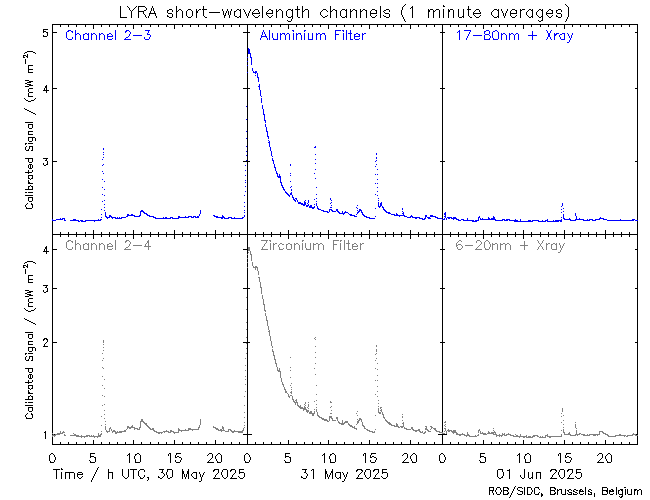
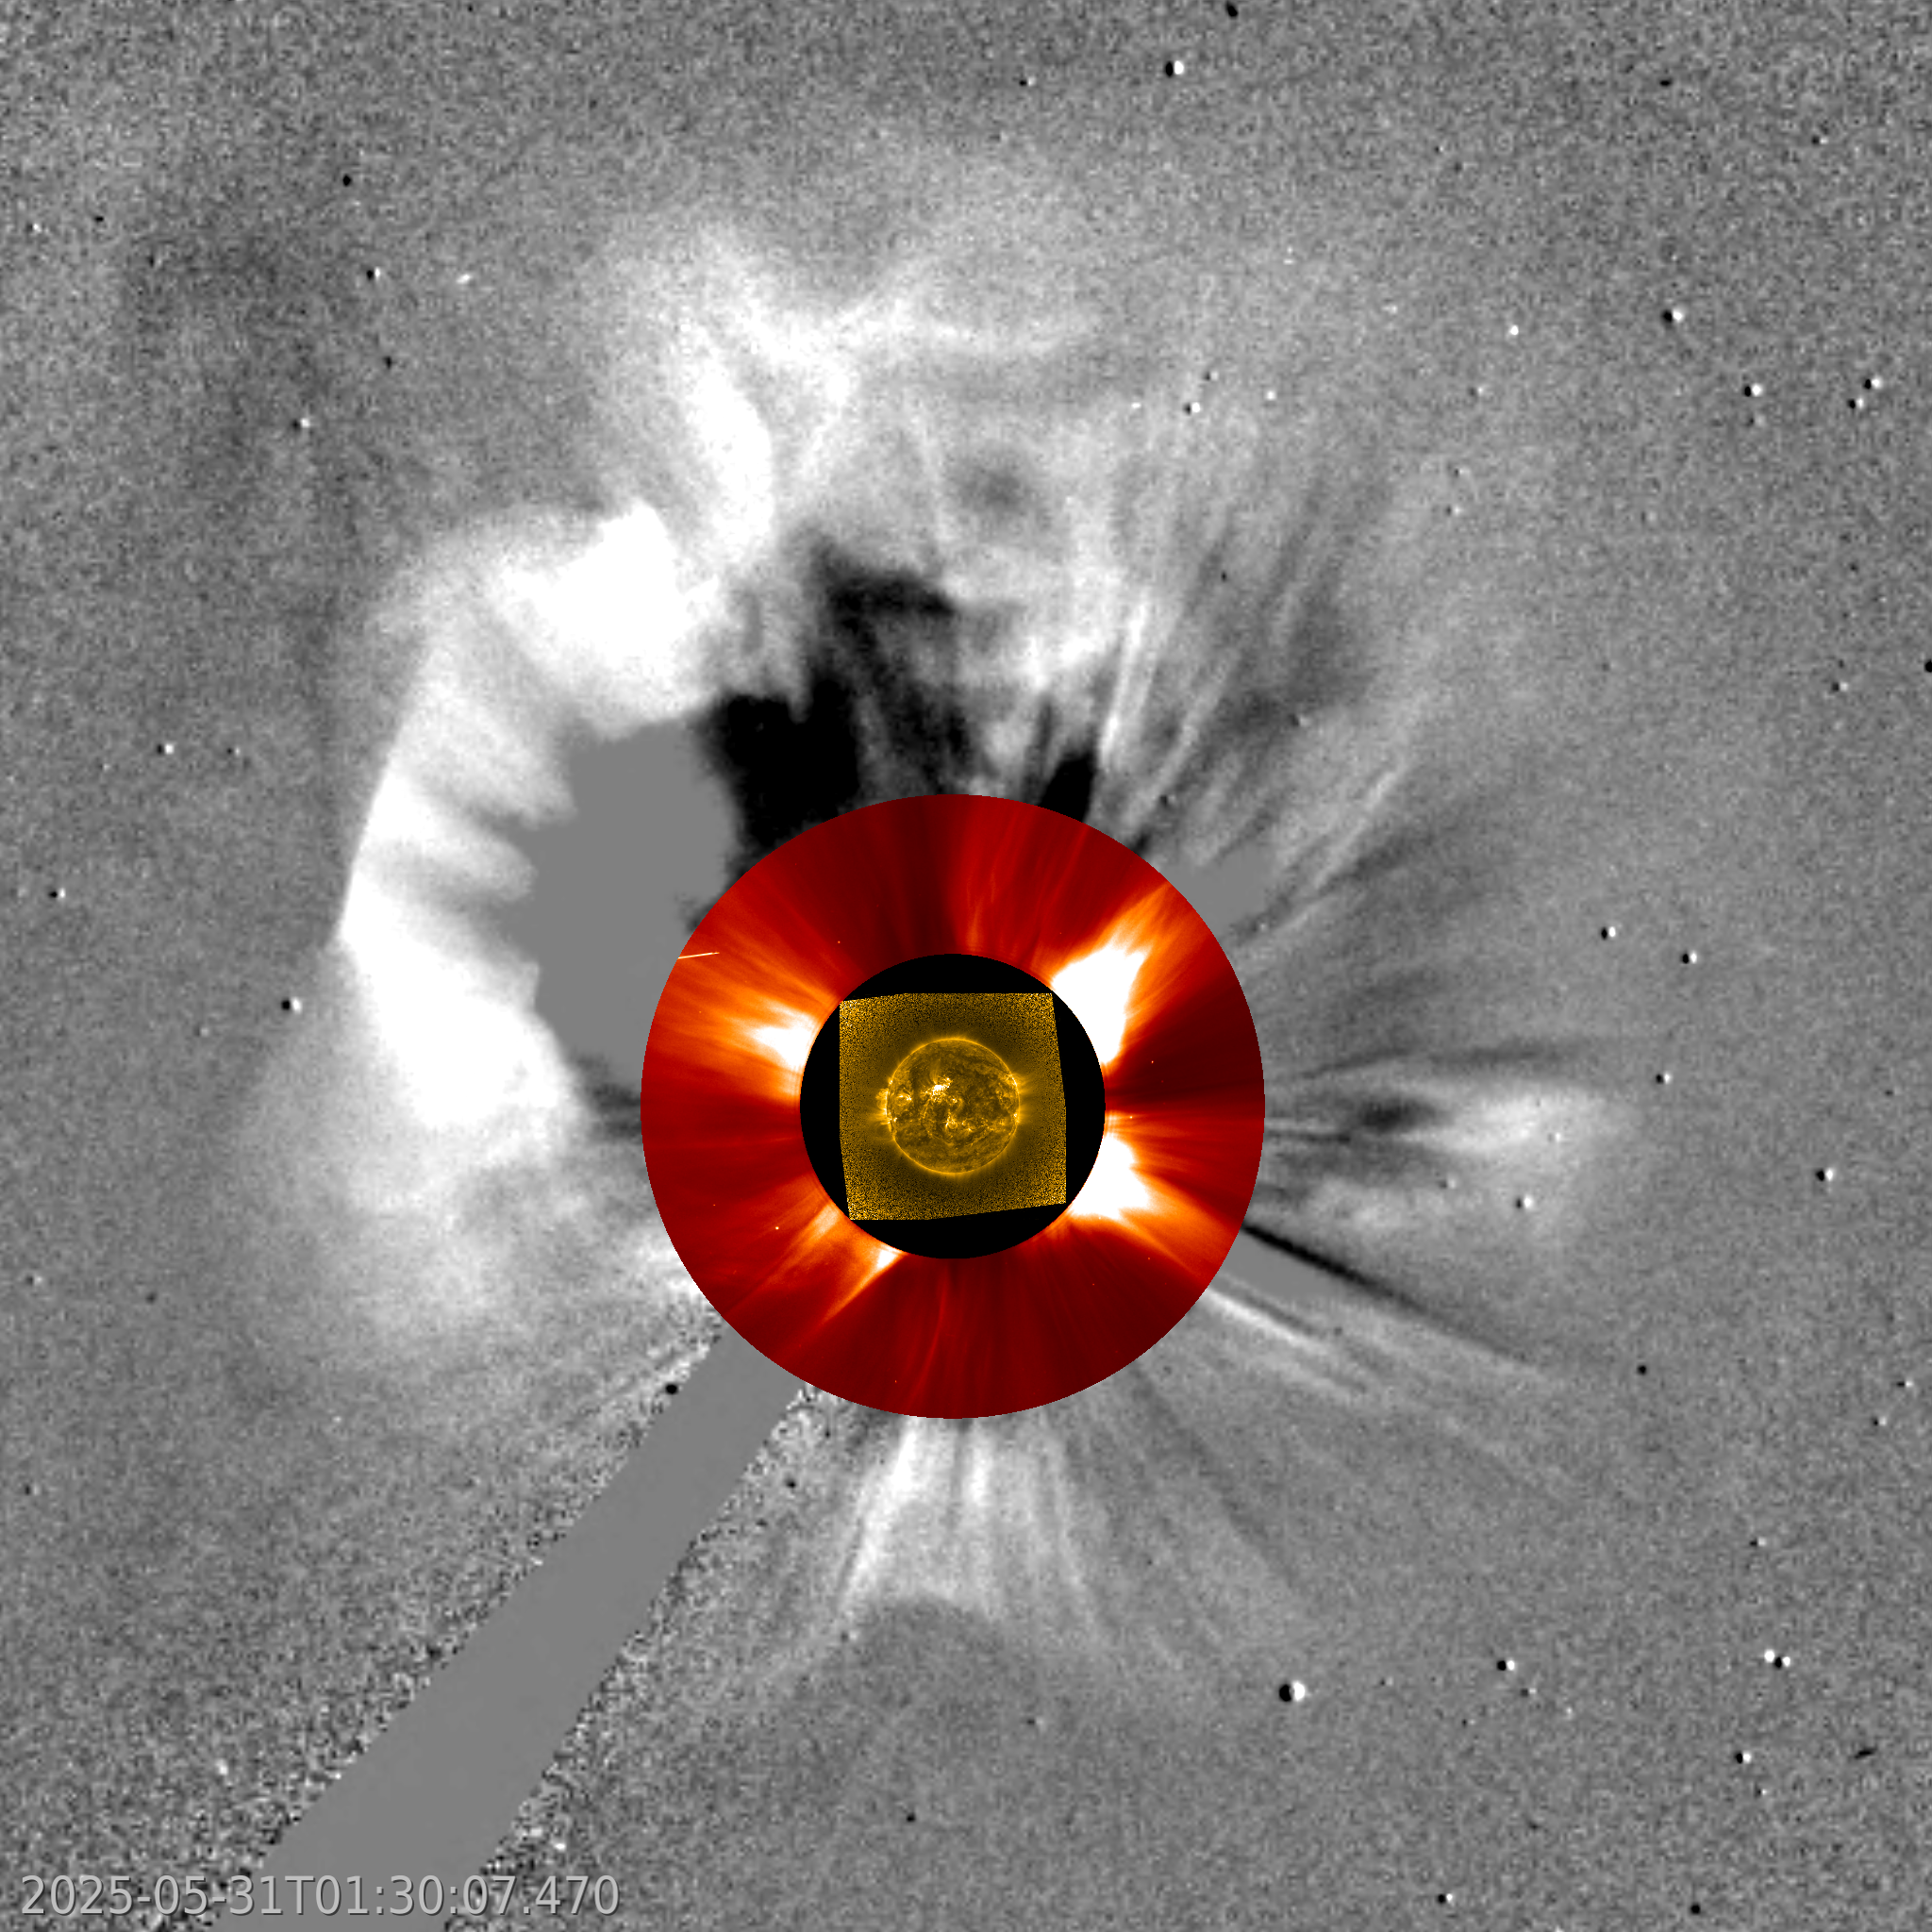
The largest flare of this week was an M8.1, and it was observed by LYRA (top panel) and SWAP (middle panel). The flare started on 2025-May-30 at 23:31 and it peaked the next day at 00:05 UT. It occurred close to the central meridian of the Sun, originating from active region NOAA4100 (SIDC sunspot group 469). This large duration flare was also associated with a very fast full halo CME (~1500 km/s), as well as a large dimming on disk. The CME was Earth-directed (see bottom panel, LASCO-C2 and C3 images with SWAP in the center), and it was observed as an ICME as early as 05:30 UT on June 1.
Find a SWAP movie of the event starting here (https://proba2.sidc.be/swap/movies/20250530_swap_movie.mp4) and continuing here (https://proba2.sidc.be/swap/movies/20250531_swap_movie.mp4). For an uninterrupted view of the event, see the weekly SWAP video here: https://proba2.sidc.be/swap/data/mpg/movies/weekly_movies/weekly_movie_2025_05_26.mp4.
International Sunspot Number by SILSO
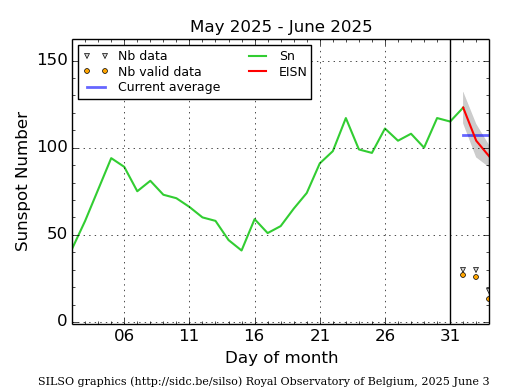
The daily Estimated International Sunspot Number (EISN, red curve with shaded error) derived by a simplified method from real-time data from the worldwide SILSO network. It extends the official Sunspot Number from the full processing of the preceding month (green line), a few days more than one solar rotation. The horizontal blue line shows the current monthly average. The yellow dots give the number of stations that provided valid data. Valid data are used to calculate the EISN. The triangle gives the number of stations providing data. When a triangle and a yellow dot coincide, it means that all the data is used to calculate the EISN of that day.
Noticeable Solar Events
| DAY | BEGIN | MAX | END | LOC | XRAY | OP | 10CM | TYPE | Cat | NOAA |
| 26 | 1250 | 1306 | 1315 | S5W67 | M2.9 | 2N | 83 | 4098 | ||
| 26 | 1327 | 1337 | 1344 | N11E70 | M1.4 | 1F | III/2II/2 | 4100 | ||
| 30 | 0556 | 0613 | 0619 | N6E55 | M3.4 | SF | VI/2II/2 | 87 | 4100 | |
| 30 | 1822 | 1839 | 1854 | N6E46 | M1.6 | S | 4104 | |||
| 30 | 2331 | 0005 | 0132 | M8.1 | 87 | 4100 | ||||
| 31 | 0512 | 0518 | 0520 | N11E5 | M2.4 | S | III/3 | 87 | 4100 | |
| 31 | 0808 | 0818 | 0823 | N11E5 | M4.5 | 1N | III/3 | 87 | 4100 | |
| 31 | 1536 | 1549 | 1557 | N6E3 | M2.9 | 2B | VI/2IV/1 | 87 | 4100 | |
| 31 | 0349 | 0356 | 0404 | M1.0 | III/1 | 87 | 4100 |
| LOC: approximate heliographic location | TYPE: radio burst type |
| XRAY: X-ray flare class | Cat: Catania sunspot group number |
| OP: optical flare class | NOAA: NOAA active region number |
| 10CM: peak 10 cm radio flux |
Geomagnetic Observations in Belgium
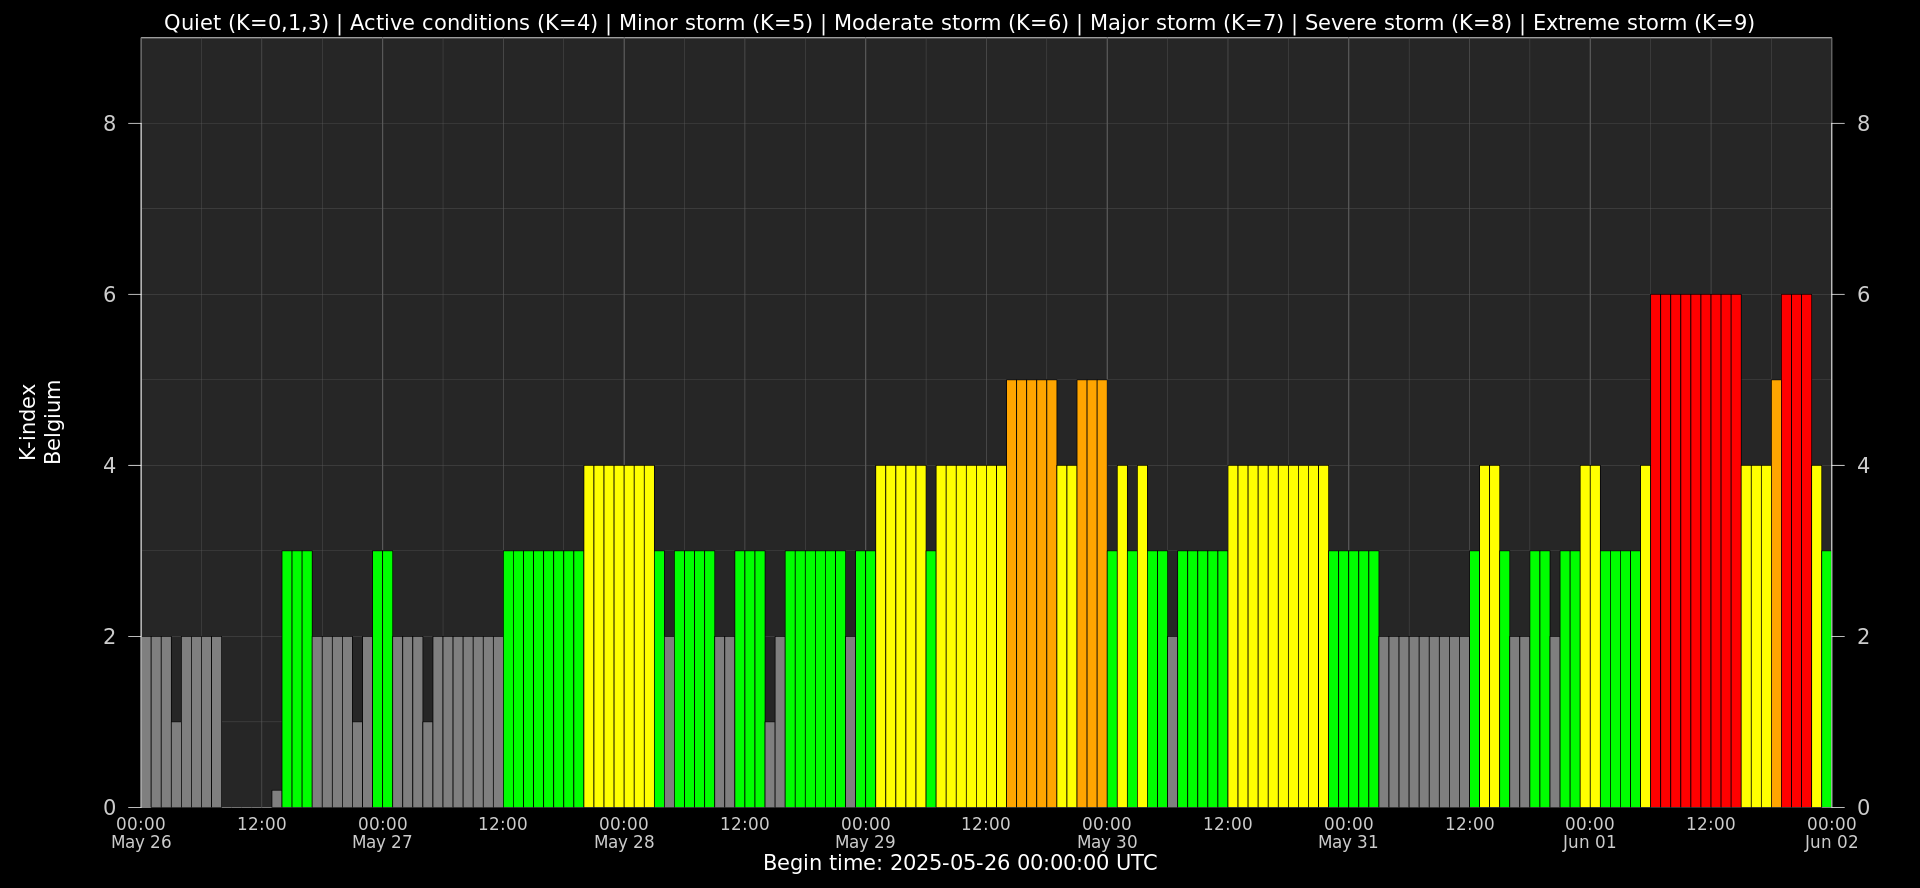
Local K-type magnetic activity index for Belgium based on data from Dourbes (DOU) and Manhay (MAB). Comparing the data from both measurement stations allows to reliably remove outliers from the magnetic data. At the same time the operational service availability is improved: whenever data from one observatory is not available, the single-station index obtained from the other can be used as a fallback system.
Both the two-station index and the single station indices are available here: http://ionosphere.meteo.be/geomagnetism/K_BEL/
The SIDC space weather briefing
The forecaster on duty presented the SIDC briefing that gives an overview of space weather from May 26 to June 1.
The pdf of the presentation can be found here: https://www.stce.be/briefings/20250602_SWbriefing.pdf
Review of Ionospheric Activity
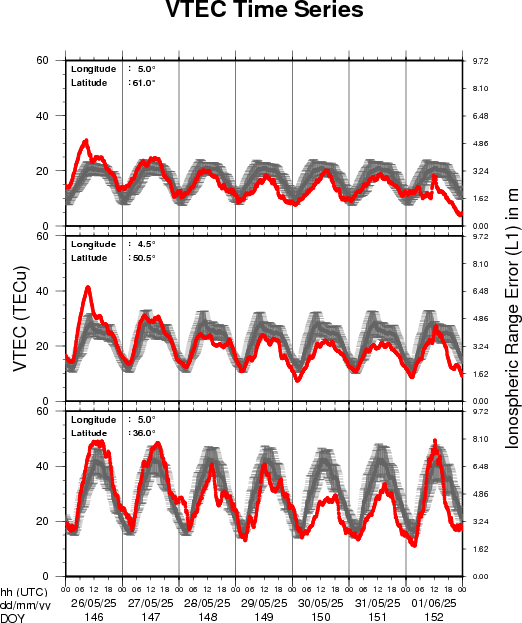
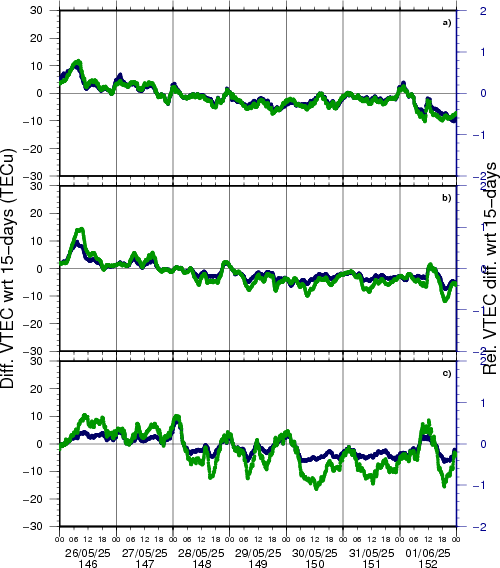
VTEC time series at 3 locations in Europe from 26 May 2025 till 1 Jun 2025
The top figure shows the time evolution of the Vertical Total Electron Content (VTEC) (in red) during the last week at three locations:
a) in the northern part of Europe(N 61deg E 5deg)
b) above Brussels(N 50.5deg, E 4.5 deg)
c) in the southern part of Europe(N 36 deg, E 5deg)
This top figure also shows (in grey) the normal ionospheric behaviour expected based on the median VTEC from the 15 previous days.
The time series below shows the VTEC difference (in green) and relative difference (in blue) with respect to the median of the last 15 days in the North, Mid (above Brussels) and South of Europe. It thus illustrates the VTEC deviation from normal quiet behaviour.
The VTEC is expressed in TECu (with TECu=10^16 electrons per square meter) and is directly related to the signal propagation delay due to the ionosphere (in figure: delay on GPS L1 frequency).
The Sun's radiation ionizes the Earth's upper atmosphere, the ionosphere, located from about 60km to 1000km above the Earth's surface.The ionization process in the ionosphere produces ions and free electrons. These electrons perturb the propagation of the GNSS (Global Navigation Satellite System) signals by inducing a so-called ionospheric delay.
See http://stce.be/newsletter/GNSS_final.pdf for some more explanations; for more information, see https://gnss.be/SpaceWeather
Trainings, presentations and activities
Courses, seminars, presentations and events with the Sun-Space-Earth system and Space Weather as the main theme. We provide occasions to get submerged in our world through educational, informative and instructive activities.
* Jun 7-9, STCE stand: Dichtbij de Zon, Nerdland Festival, Wachtebeke, Belgium, https://www.nerdlandfestival.be/nl/
* Jun 20, 2025, STCE seminar: The Vigil mission to L5
* Jun 23-25, 2025, STCE Space Weather Introductory Course, Brussels, Belgium - register: https://events.spacepole.be/event/216/
* Oct 23-25, ESWW Space Weather Course by Umea University and STCE, Kiruna, Sweden
* Oct 27-31, European Space Weather Week, Umea, Sweden - https://esww.eu/
* Nov 17-19, 2025, STCE Space Weather Introductory Course, Brussels, Belgium - register: https://events.spacepole.be/event/217/
To register for a course and check the seminar details, navigate to the STCE Space Weather Education Center: https://www.stce.be/SWEC
If you want your event in the STCE newsletter, contact us: stce_coordination at stce.be
Website: https://www.stce.be/SWEC