- Table of Content
- 1.First view of ...
- 2.Review of Sola...
- 3.International ...
- 4.Noticeable Sol...
- 5.Geomagnetic Ob...
- 6.Review of Iono...
- 7.The SIDC Space...
- 8.Trainings, pre...
2. Review of Solar and Geomagnetic Activity
3. International Sunspot Number by SILSO
4. Noticeable Solar Events
5. Geomagnetic Observations in Belgium
6. Review of Ionospheric Activity
7. The SIDC Space Weather Briefing
8. Trainings, presentations and activities at the STCE
First view of the solar poles with EUI
Thanks to a push from planet Venus earlier this year, the orbit of the Solar Orbiter spacecraft was tilted. A century ago mankind raced to explore the poles of the Earth, now Solar Orbiter made its way to the poles of the Sun. For the very first time the solar poles have been imaged!
All images of the Sun up till now were taken from the ecliptic, the plane in which Earth and the other planets orbit around the Sun. Our view of the Sun has always been a side view, centered around the solar equator. Now that Solar Orbiter has a tilted orbit, currently at an angle of 17 degrees, we get to see the Sun more from the top.
In March of this year the Extreme Ultraviolet Imager (EUI), a set of telescopes onboard Solar Orbiter that are operated from the Royal Observatory of Belgium, took the very first images of the south pole. Read the ESA News about these observations here: https://www.esa.int/Science_Exploration/Space_Science/Solar_Orbiter/Solar_Orbiter_gets_world-first_views_of_the_Sun_s_poles
New: a sneak preview of the solar north pole
After the southern passage, Solar Orbiter continued its expedition to the solar north pole. The images of this flight have just arrived!
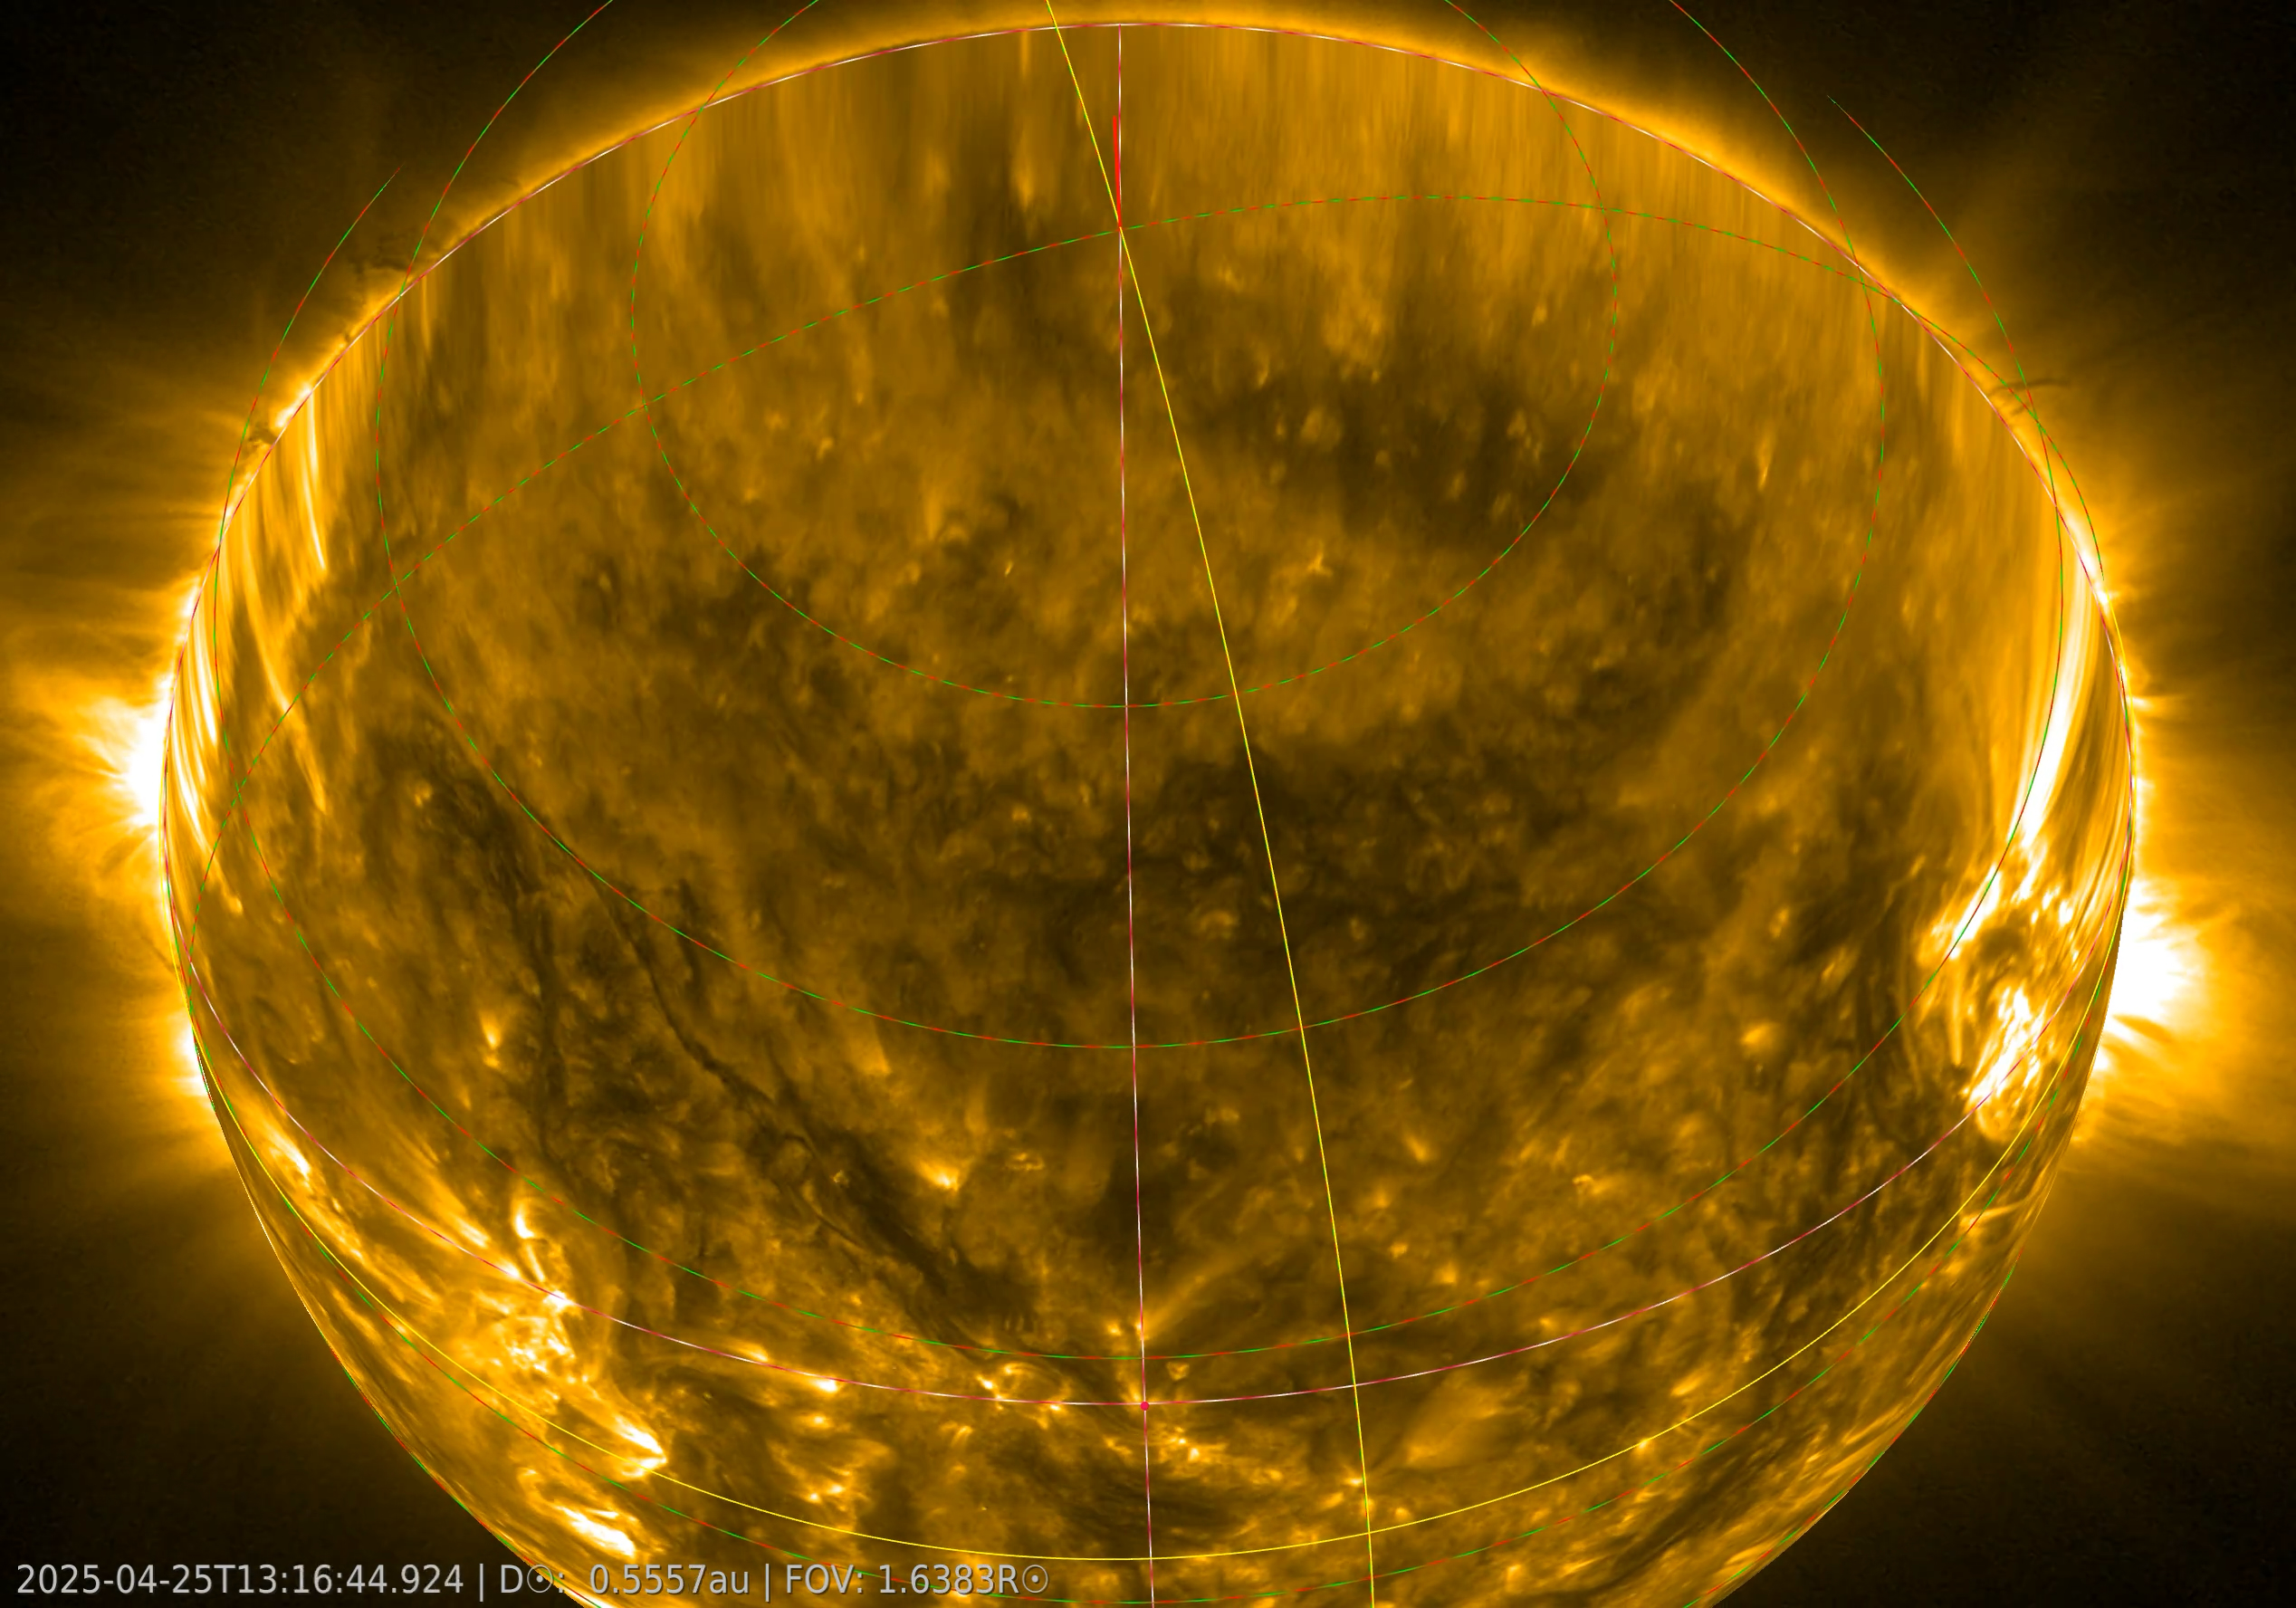
This movie shows Solar Orbiter's tilted view and zoom in to the Sun's north pole. Solar Orbiter used its Extreme Ultraviolet Imager (EUI) instrument to take these images between 25 and 29 April. The dashed red-green lines show the solar latitudes and longitudes (Stonyhurst grid), while the solid yellow lines show the centre of Earth's view. (ESA and NASA/Solar Orbiter/EUI Team, D. Berghmans/Royal Observatory of Belgium).
Find the movie here: https://stce.be/movies/EUIsolarNorthPole.mp4
At the Royal Observatory of Belgium, scientists waited impatiently for the first images of the solar poles. Cis Verbeeck, EUI project manager, explains: "From these polar observations we expect a better understanding of how the Sun's magnetic field changes and creates the solar activity cycle. Together with measurements of the solar wind coming from the poles, this will improve our space weather predictions."
Review of Solar and Geomagnetic Activity
Solar Active Regions and flares
Solar flaring activity was moderate at the beginning of the week, then decreased to low levels through mid-week, and remained low until the end of the period. Over the course of the week, a total of four M-class and fifty-four C-class flares were recorded. A total of ten numbered active regions (ARs) were observed on the visible solar disc. The largest and most magnetically complex regions were SIDC Sunspot Group 469 (NOAA AR 4100; magnetic type beta-gamma), which rotated off the visible disc by June 07; and SIDC Sunspot Group 513 (NOAA AR 4105; magnetic type beta-gamma), which rotated over the southeast limb on June 03. These two regions were the primary drivers of the flaring activity throughout the week. The largest flare was an M3.3 flare (SIDC Flare 4531), peaking at 11:18 UTC on June 02, and associated with SIDC Sunspot Group 469.
Coronal mass ejections
Several Coronal Mass Ejections (CMEs) were detected in the available coronagraph imagery over the past week. Of these, two were determined to be potentially Earth-directed, while the others were not expected to have any significant impact at Earth.
A slow coronal mass ejection (SIDC CME 514) was observed in LASCO/C2 coronagraph data starting at 07:48 UTC on June 03. The CME was directed primarily toward the northeast from Earth's perspective and was associated with a large filament eruption occurring in the northern and northeastern regions near the solar disc center around 00:50 UTC on June 03. The CME was expected to mostly miss Earth, with a slight chance for a glancing blow around June 07. An associated ICME was indeed detected in the solar wind at 00:15 UTC on June 07.
A faint coronal mass ejection (SIDC CME 515) was detected in LASCO/C2 data beginning at 11:12 UTC on June 06, also directed toward the northeast. The glancing blow arrival at Earth was expected around June 09.
On June 08 at 01:36 UTC, wide coronal mass ejection (SIDC CME 516) was observed in LASCO/C2 data, associated with a large coronal dimming near N10E40. This CME was slow (estimated speed below 300 km/s) and no or little impact at Earth is expected.
Later on June 08, halo CME (SIDC CME 517) was detected in LASCO/C2 coronagraph data starting at 07:36 UTC, associated to a filament eruption behind the southwest limb. Due to its origin behind the limb, no impact at Earth is expected.
Coronal Holes
Three coronal holes were observed crossing the central meridian over the course of the week. A mid-latitude, negative polarity coronal hole (SIDC Coronal Hole 111) began transiting the central meridian on June 02, with the associated high-speed stream (HSS) likely influencing near-Earth solar wind conditions toward the end of the week.
A small positive polarity coronal hole (SIDC Coronal Hole 117) crossed the central meridian in the northern hemisphere on June 05. Another small, low-latitude negative polarity coronal hole (SIDC Coronal Hole 118) began to pass the central meridian on June 08.
Proton flux levels
The greater than 10 MeV proton flux, as measured by GOES-18, was elevated at the start of the week but remained below the 10 pfu threshold throughout the period.
The proton levels gradually decreased and returned to nominal values by the end of the week.
Electron fluxes at GEO
The greater than 2 MeV electron flux, as measured by GOES-19, exceeded the 1000 pfu threshold through most of the week (June 02-07). The 24-hour electron fluence remained at normal to moderate levels throughout the reporting period.
Solar wind
At the beginning of the week, solar wind parameters were slightly disturbed under the ongoing ICME influence associated with the CME that lifted off the Sun on May 31 (SIDC CME 513). The interplanetary magnetic field reached values up to 15 nT, while the solar wind speed decreased from around 850 km/s to 550 km/s. The southward component of the magnetic field was predominantly negative, with a minimum of -12 nT.
From June 04, solar wind parameters became slightly disturbed again, probably due to the mild arrival of a high-speed stream (HSS). The magnetic field reached values up to 15 nT, and the solar wind speed increased to approximately 800 km/s. The southward component of the magnetic field fluctuated between -11 nT and 10 nT.
After returning to slow solar wind conditions, solar wind parameters became disturbed once more around 00:14 UTC on June 07, with interplanetary magnetic field reaching up to 16 nT. This is likely associated with the ICME arrival of a SIDC CME 514, first detected in SOHO/LASCO-C2 imagery early on June 03. Solar wind conditions remained slightly elevated until the end of the week, due to the ongoing ICME influence, possibly combined with high-speed stream influence associated with a negative polarity coronal hole (SIDC CH 111).
Geomagnetism
At the beginning of the week, geomagnetic conditions reached major storm levels globally (Kp = 7) between 03:00 and 06:00 UTC on June 03, due to the ongoing ICME influence associated with the CME from May 31 (SIDC CME 513). Moderate storm conditions were observed locally over Belgium (K-Bel = 6).
Conditions temporarily decreased to unsettled levels, before increasing again to minor storm levels globally (Kp = 5, 5+) between 12:00 and 18:00 UTC on June 04, and locally (K-Bel = 5) between 15:00 and 18:00 UTC, likely due to the impact of a high-speed stream. By June 06, geomagnetic conditions had decreased to quiet to unsettled levels globally and locally.
At the end of the week, minor storm conditions reoccurred globally (Kp = 5-) between 18:00 and 21:00 UTC on June 07, following ICME arrival of June 3 CME (SIDC CME 514). Active conditions were observed locally over Belgium during this period.
International Sunspot Number by SILSO
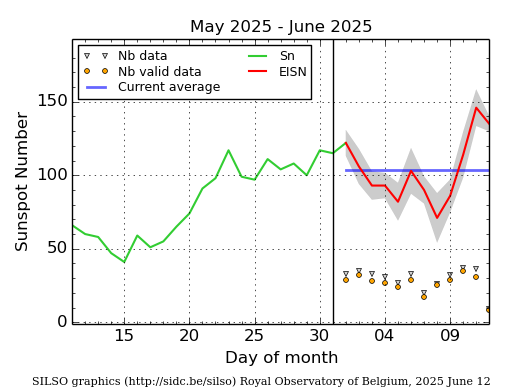
The daily Estimated International Sunspot Number (EISN, red curve with shaded error) derived by a simplified method from real-time data from the worldwide SILSO network. It extends the official Sunspot Number from the full processing of the preceding month (green line), a few days more than one solar rotation. The horizontal blue line shows the current monthly average. The yellow dots give the number of stations that provided valid data. Valid data are used to calculate the EISN. The triangle gives the number of stations providing data. When a triangle and a yellow dot coincide, it means that all the data is used to calculate the EISN of that day.
Noticeable Solar Events
| DAY | BEGIN | MAX | END | LOC | XRAY | OP | 10CM | TYPE | Cat | NOAA |
| 02 | 1059 | 1118 | 1139 | N12W19 | M3.3 | 2 | 87 | 4100 | ||
| 02 | 2135 | 2142 | 2146 | M1.1 | 87 | 4100 | ||||
| 03 | 1252 | 1303 | 1312 | M1.4 | III/2 | 4105 | ||||
| 04 | 2306 | 2328 | 2339 | M1.1 | 87 | 4100 |
| LOC: approximate heliographic location | TYPE: radio burst type |
| XRAY: X-ray flare class | Cat: Catania sunspot group number |
| OP: optical flare class | NOAA: NOAA active region number |
| 10CM: peak 10 cm radio flux |
Geomagnetic Observations in Belgium
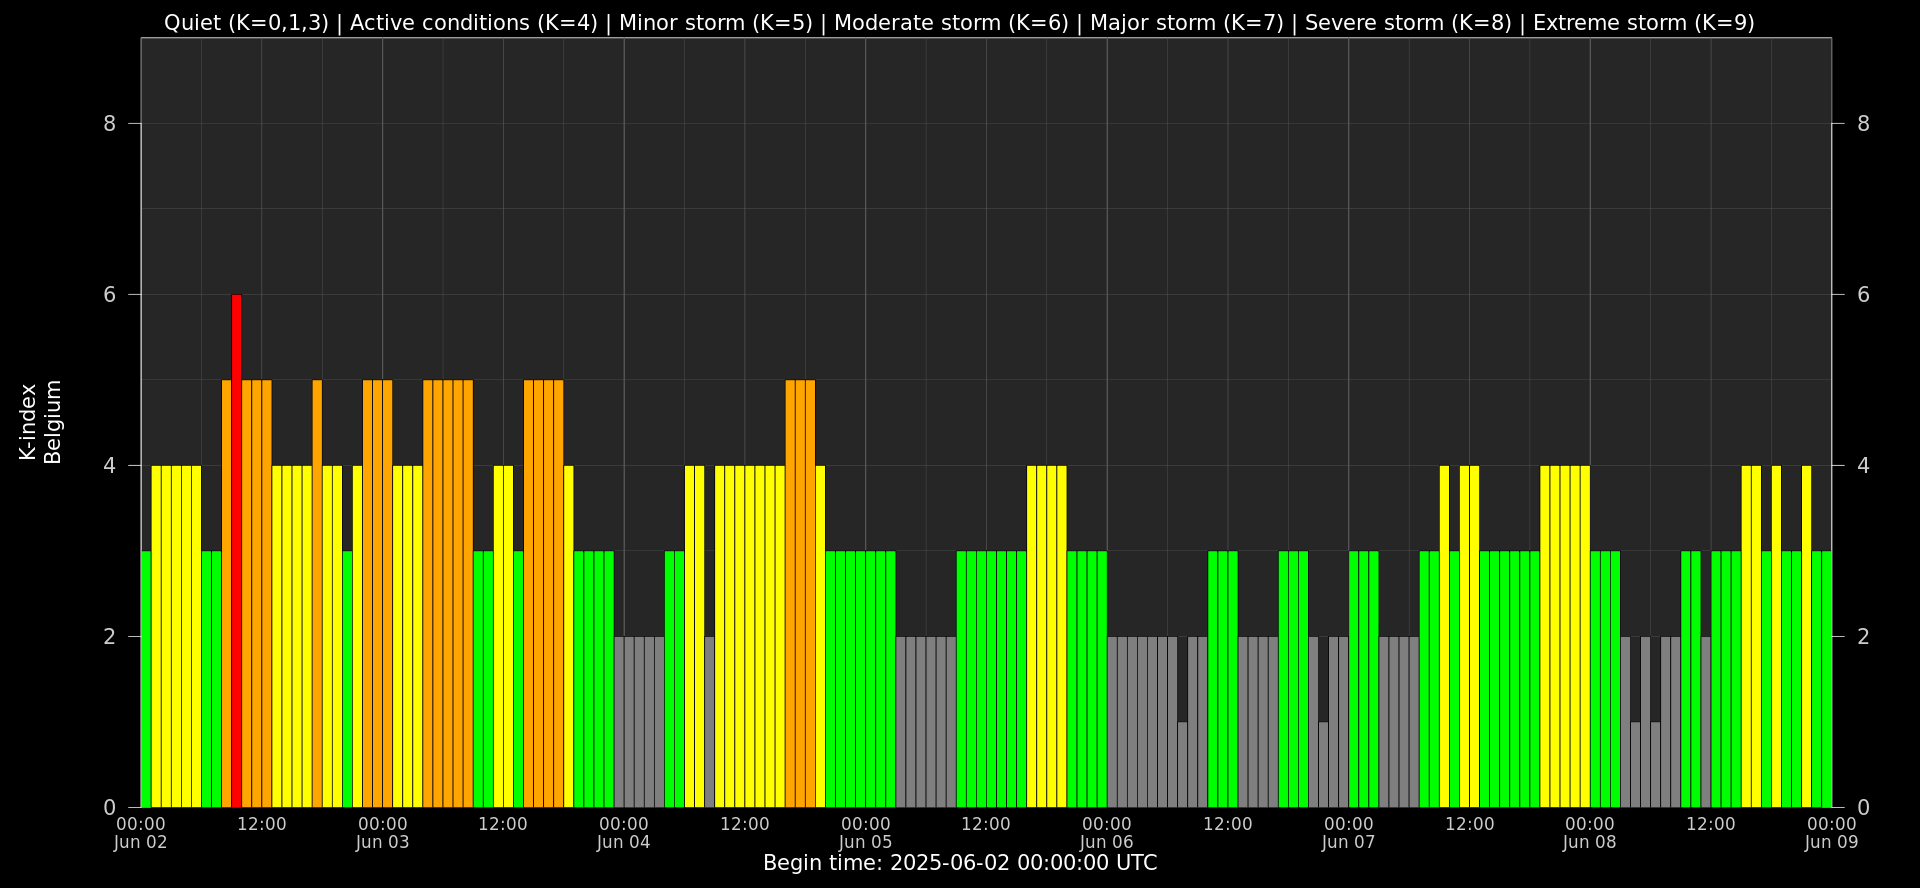
Local K-type magnetic activity index for Belgium based on data from Dourbes (DOU) and Manhay (MAB). Comparing the data from both measurement stations allows to reliably remove outliers from the magnetic data. At the same time the operational service availability is improved: whenever data from one observatory is not available, the single-station index obtained from the other can be used as a fallback system.
Both the two-station index and the single station indices are available here: http://ionosphere.meteo.be/geomagnetism/K_BEL/
Review of Ionospheric Activity

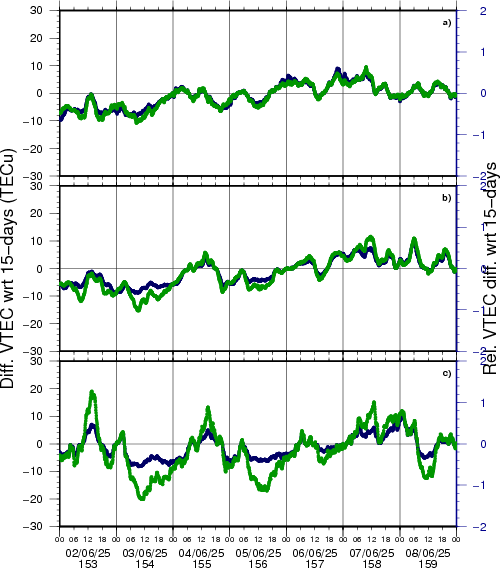
VTEC time series at 3 locations in Europe from 2 Jun 2025 till 8 Jun 2025
The top figure shows the time evolution of the Vertical Total Electron Content (VTEC) (in red) during the last week at three locations:
a) in the northern part of Europe(N 61deg E 5deg)
b) above Brussels(N 50.5deg, E 4.5 deg)
c) in the southern part of Europe(N 36 deg, E 5deg)
This top figure also shows (in grey) the normal ionospheric behaviour expected based on the median VTEC from the 15 previous days.
The time series below shows the VTEC difference (in green) and relative difference (in blue) with respect to the median of the last 15 days in the North, Mid (above Brussels) and South of Europe. It thus illustrates the VTEC deviation from normal quiet behaviour.
The VTEC is expressed in TECu (with TECu=10^16 electrons per square meter) and is directly related to the signal propagation delay due to the ionosphere (in figure: delay on GPS L1 frequency).
The Sun's radiation ionizes the Earth's upper atmosphere, the ionosphere, located from about 60km to 1000km above the Earth's surface.The ionization process in the ionosphere produces ions and free electrons. These electrons perturb the propagation of the GNSS (Global Navigation Satellite System) signals by inducing a so-called ionospheric delay.
See http://stce.be/newsletter/GNSS_final.pdf for some more explanations; for more information, see https://gnss.be/SpaceWeather
The SIDC Space Weather Briefing
The forecaster on duty presented the SIDC briefing that gives an overview of space weather from 2 to 8 June.
The pdf of the presentation can be found here: https://www.stce.be/briefings/20250609_SWbriefing.pdf

Trainings, presentations and activities at the STCE
Courses, seminars, presentations and events with the Sun-Space-Earth system and Space Weather as the main theme. We provide occasions to get submerged in our world through educational, informative and instructive activities.
* Jun 20, 2025, STCE seminar: The Vigil mission to L5
* Jun 23-25, 2025, STCE Space Weather Introductory Course, Brussels, Belgium - register: https://events.spacepole.be/event/216/
* Oct 23-25, ESWW Space Weather Course by Umea University and STCE, Kiruna, Sweden
* Oct 27-31, European Space Weather Week, Umea, Sweden - https://esww.eu/
* Nov 17-19, 2025, STCE Space Weather Introductory Course, Brussels, Belgium - register: https://events.spacepole.be/event/217/
To register for a course and check the seminar details, navigate to the STCE Space Weather Education Center: https://www.stce.be/SWEC
If you want your event in the STCE newsletter, contact us: stce_coordination at stce.be
Website: https://www.stce.be/SWEC