- Table of Content
- 1.Proba-3's firs...
- 2.ESWW2025 space...
- 3.Review of spac...
- 4.PROBA2 Observa...
- 5.International ...
- 6.Noticeable Sol...
- 7.Geomagnetic Ob...
- 8.The SIDC Space...
- 9.Review of Iono...
- 10.STCE Courses a...
2. ESWW2025 space weather training
3. Review of space weather
4. PROBA2 Observations
5. International Sunspot Number by SILSO
6. Noticeable Solar Events
7. Geomagnetic Observations in Belgium
8. The SIDC Space Weather Briefing
9. Review of Ionospheric Activity
10. STCE Courses and seminars
Proba-3's first solar eclipse image
A solar eclipse on demand in space
This is the image of the duo-satellite Proba-3 making solar eclipses, released by the European Space Agency, ESA.
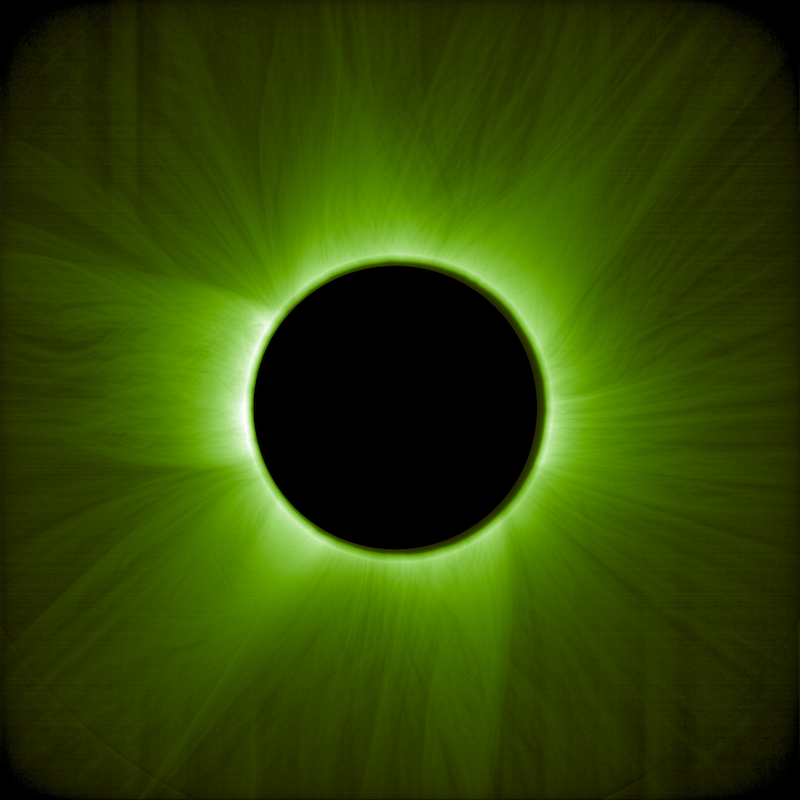
In this image taken on 23 May 2025, we see the corona. The sun itself was hidden behind one satellite and thus not visible. The instrument ASPIICS on the other satellite took the image. ASPIICS stands for Association of Spacecraft for Polarimetric and Imaging Investigation of the Corona of the Sun.
The image was taken by the instrument ASPIICS on Proba-3. The raw image, once transmitted to Earth, was processed by scientists at the Royal Observatory of Belgium. It is this image that ESA now released.
Andrei Zhukov, the principal investigator of ASPIICS: 'To make this image, we used all our scientific knowledge about how the instrument works. To do this, we have to learn to know the entire instrument with parts spread across the two satellites, inside and out, from lens aperture, internal systems, to every pixel of the image sensor. We had to understand how each of those parts reacted.'
Many meetings, tests and discussions preceded it. But the result is worth it.
Andrei Zhukov: 'Then again, we are talking about two satellites. We had to pool all our knowledge. What we see here is the result of scientific teamwork. I am very proud of this world first.'
Fantastic research is in sight
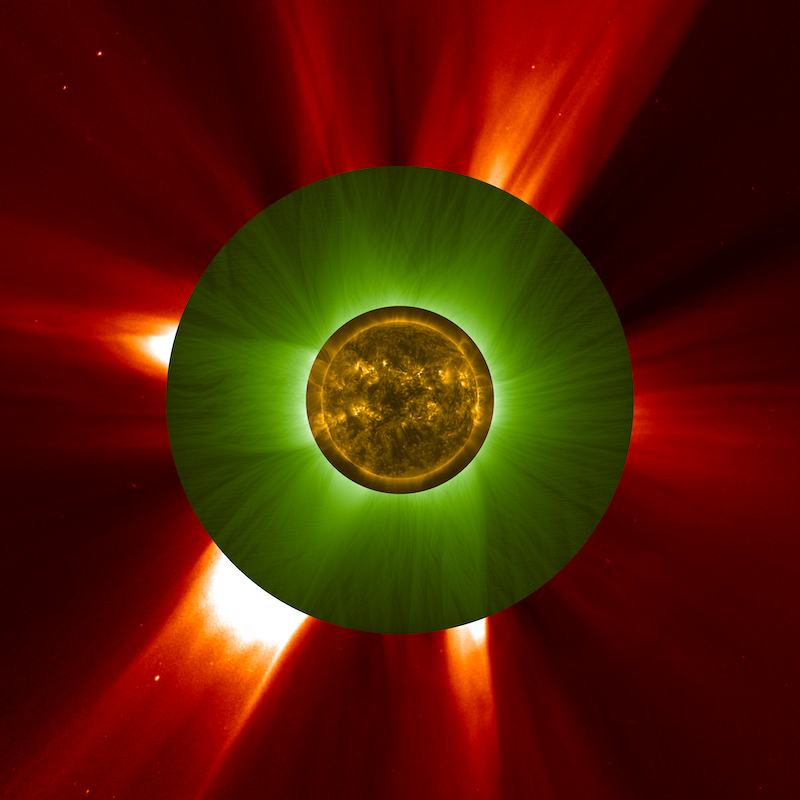
This image is a fantastic reward and heralds the beginning of a scientific voyage of discovery into the solar atmosphere, the birthplace of space weather. As we can see, it perfectly fits in the gap between images from the coronagraph LASCO aboard SOHO and the EUV imager SWAP aboard PROBA2.
The idea of making solar eclipses in space by flying two satellites in formation dates back to 2003. Andrei became principal investigator of ASPIICS in 2013.
Image 1, full resolution: https://stce.be/images/wb_wow.png
Caption: The Sun's inner corona appears greenish in this image taken on 23 May 2025 by the ASPIICS coronagraph aboard Proba-3, ESA's formation-flying mission capable of creating artificial total solar eclipses in orbit.
This image, captured in the visible light spectrum, shows the solar corona similarly to how a human eye would see it during an eclipse through a green filter. The hair-like structures were revealed using a specialised image processing algorithm. Credit: ESA/Proba-3/ASPIICS/WOW algorithm
Image 2, full resolution: https://stce.be/images/wb_wow_lasco_swap.png
Caption: The ASPIICS coronagraph aboard ESA's formation-flying Proba-3 mission is able to observe the Sun's corona in the gap between the fields of view of solar extreme-ultraviolet imagers and conventional coronagraphs, making it uniquely suited for studies of the inner solar corona.
This image is a combination of observations made on 23 May 2025 by three different European instruments aboard different missions: the Sun's disc (artificially coloured in yellow), as captured by an extreme-ultraviolet telescope (SWAP) aboard PROBA2; the outer corona (in red) observed by the LASCO C2 coronagraph aboard SOHO; and the inner corona (in green), imaged in detail by Proba-3's ASPIICS coronagraph, filling the gap. Credit: ESA/NASA/Proba-2/Proba-3/SOHO/SWAP/ASPIICS/LASCO C2/WOW algorithm
ESA's press release: https://www.esa.int/Enabling_Support/Space_Engineering_Technology/Proba-3/Proba-3_s_first_artificial_solar_eclipse
ESWW2025 space weather training
You can apply for the space weather training in Kiruna, prior to the European Space Weather Week in Umea, Sweden.
Deadline is July 7.
Don't miss it: https://esww.eu/training/school-programme
Review of space weather
Solar Active Regions (ARs) and flares
Solar flaring activity varied from low, with multiple C-class flares, to moderate, with M-class flares during the week. SIDC Sunspot Group 513 (NOAA AR 4105) was the most active, producing C-class flares and several M-class flares, including an M6.8 flare on June 14 at 23:01 UTC and an M2.2 flare on June 15 at 07:56 UTC. SIDC Sunspot Group 523 (NOAA AR 4114) became increasingly complex (Beta-Gamma-Delta) and produced significant flares, including an M8.4 flare on June 15 at 18:07 UTC. C-class flares were produced by SIDC Sunspot Group 51 (NOAA AR 4107), SIDC Sunspot Group 520 (NOAA AR 4110), SIDC Sunspot Group 522 (NOAA AR 4115), SIDC Sunspot Group 524 (NOAA AR 4113), and SIDC Sunspot Group 525 (NOAA AR 4116). Associated with the M2.2 flare on June 15 at 07:56 UTC, both Type IV and Type II radio emissions were detected, typically indicating the presence of a coronal mass ejection (CME) and pointing to the potential for solar energetic particle storms.
Coronal mass ejections
Multiple narrow outflows were observed in SOHO LASCO/C2 coronagraph imagery. The most notable Coronal Mass Ejection (CME) occurred on June 15 around 08:00 UTC, associated with the M2.2 flare from SIDC Sunspot Group 513 (NOAA AR 4105) and accompanied by Type II and Type IV radio emissions. While this CME was not identified as clearly Earth-directed, it may nonetheless deliver a glancing blow to Earth. No other clear Earth-directed CMEs were detected in the available data.
Coronal Holes
SIDC Coronal Hole 104, a large mid-latitude southern coronal hole of positive polarity, crossed the central meridian on June 12 and was the primary source of a high-speed solar wind stream (HSS) that influenced Earth in the second half of the week.
Proton flux levels
The greater-than-10 MeV proton flux, as measured by GOES, remained at background levels throughout the week. No solar energetic particle (SEP) events were detected and no significant proton enhancements are anticipated in the near term.
Electron fluxes at GEO
The greater-than-2 MeV electron flux remained mostly below the 1000 pfu alert threshold with very brief periods above. The 24-hour electron fluence was at normal to moderate levels. No significant electron enhancements occurred.
Solar wind
Solar wind parameters suggested that Earth was under the combined influence of a high-speed stream (HSS) associated with SIDC Coronal Hole 118 (an equatorial coronal hole that crossed the central meridian on June 8) and the glancing arrival of a weak interplanetary coronal mass ejection (ICME), likely SIDC CME 516 (observed as a slow, wide eruption on June 8, directed primarily toward the northeast and linked to a small filament eruption in the northeastern quadrant of the solar disk, visible in LASCO/C2 coronagraph data starting at 01:36 UTC on June 8). The solar wind speed ranged between 350 km/s and peaks near 600 km/s as the high-speed stream arrived. The total interplanetary magnetic field (Bt) reached up to 19 nT on June 13 around 06:30 UTC with the ICME's influence. The southward component (Bz) varied, being mainly negative and occasionally dipping below -16 nT on June 13 around 06:30 UTC. The phi angle was mostly in the negative sector, indicating a persistent magnetic connection to the negative polarity HSS from SIDC Coronal Hole 118, before shifting to the positive sector with the arrival of the HSS associated with SIDC Coronal Hole 104 on June 14 around 22:30 UTC.
Geomagnetism
Geomagnetic conditions ranged from unsettled to storm levels. The NOAA Kp index reached storm levels (Kp = 6) on June 13 between 12:00 UTC and 00:00 UTC. Locally in Belgium, the K_BEL index recorded active to minor storm conditions, with values reaching K = 5 during the peak disturbances, between 15:00 UTC on June 13 and 02:00 UTC on June 14. The geomagnetic activity was driven by sustained southward Bz and elevated Bt, in response to the combined influence of the HSS associated with SIDC Coronal Hole 118 and the glancing arrival of the weak ICME, likely SIDC CME 516.
PROBA2 Observations
Solar Activity
Solar flare activity fluctuated from low to moderate during the week.
In order to view the activity of this week in more detail, we suggest to go to the following website from which all the daily (normal and difference) movies can be accessed: https://proba2.oma.be/ssa
This page also lists the recorded flaring events.
A weekly overview movie (SWAP week 794) can be found here: https://proba2.sidc.be/swap/data/mpg/movies/weekly_movies/weekly_movie_2025_06_09.mp4.
Details about some of this week's events can be found further below.
If any of the linked movies are unavailable they can be found in the P2SC movie repository here: https://proba2.oma.be/swap/data/mpg/movies/.
Sunday June 15
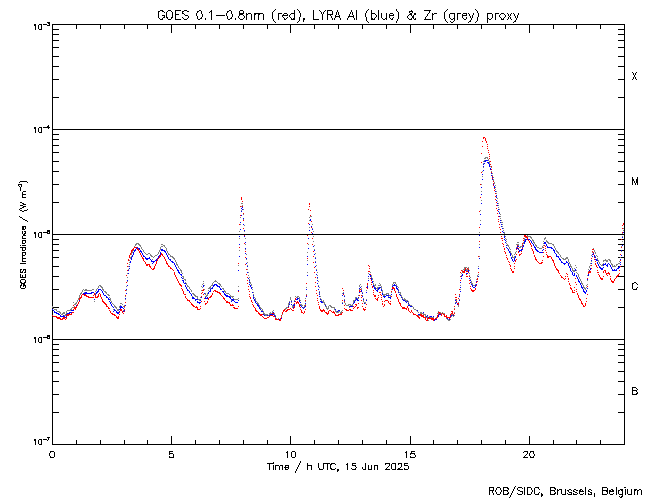
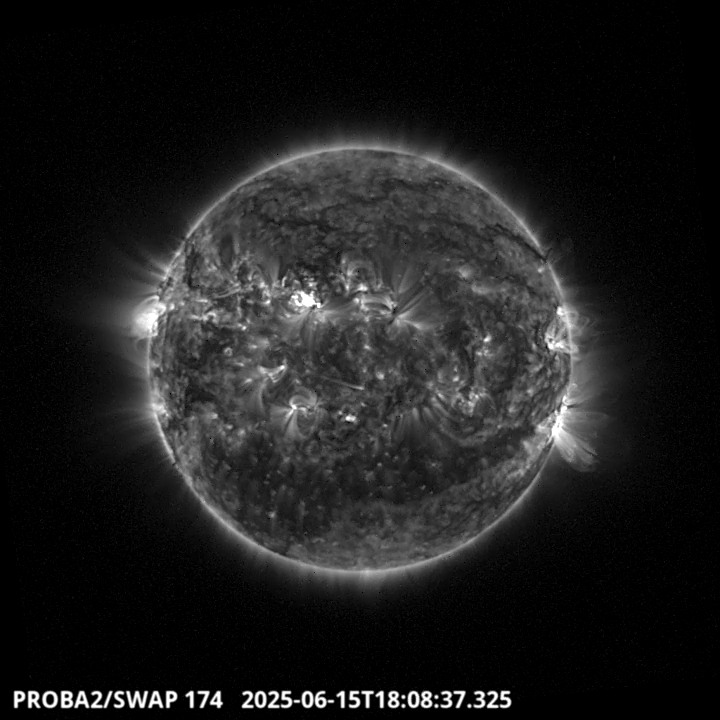
The largest flare of this week was an M8.4, and it was observed by LYRA (top panel) and SWAP (bottom panel). The flare peaked on 2025-Jun-15 at 18:07 UT and occurred in the northern hemisphere of the Sun close to the central meridian, originating from active region NOAA4114 (SIDC Sunspot Group 523).
Find a SWAP movie of the event here: https://proba2.sidc.be/swap/movies/20250615_swap_movie.mp4.
International Sunspot Number by SILSO
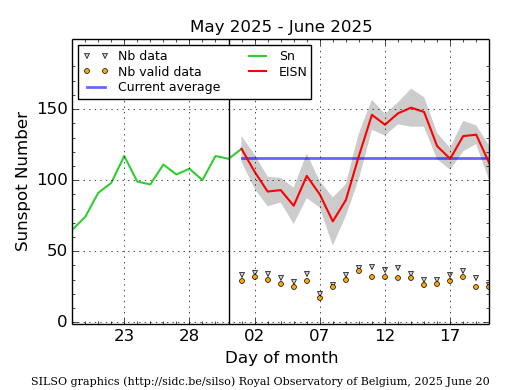
The daily Estimated International Sunspot Number (EISN, red curve with shaded error) derived by a simplified method from real-time data from the worldwide SILSO network. It extends the official Sunspot Number from the full processing of the preceding month (green line), a few days more than one solar rotation. The horizontal blue line shows the current monthly average. The yellow dots give the number of stations that provided valid data. Valid data are used to calculate the EISN. The triangle gives the number of stations providing data. When a triangle and a yellow dot coincide, it means that all the data is used to calculate the EISN of that day.
Noticeable Solar Events
| DAY | BEGIN | MAX | END | LOC | XRAY | OP | 10CM | TYPE | Cat | NOAA |
| 13 | 2049 | 2110 | 2121 | S16W60 | M1.2 | 1F | 92 | 4105 | ||
| 14 | 1752 | 1804 | 1813 | M1.0 | II/2 | 92 | 4105 | |||
| 14 | 2251 | 2301 | 2309 | S16W74 | M6.8 | 1N | 92 | 4105 | ||
| 15 | 0745 | 0756 | 0802 | S14W67 | M2.2 | 1N | II/3I/2 4 | 92 | 4105 | |
| 15 | 1032 | 1047 | 1053 | M1.9 | 92 | 4105 | ||||
| 15 | 1745 | 1807 | 1825 | N18E16 | M8.4 | 1 | III/2IV/1II/3 | 2 | 4114 | |
| 15 | 2343 | 2357 | 0005 | N18E17 | M1.2 | SF | 2 | 4114 |
| LOC: approximate heliographic location | TYPE: radio burst type |
| XRAY: X-ray flare class | Cat: Catania sunspot group number |
| OP: optical flare class | NOAA: NOAA active region number |
| 10CM: peak 10 cm radio flux |
Geomagnetic Observations in Belgium
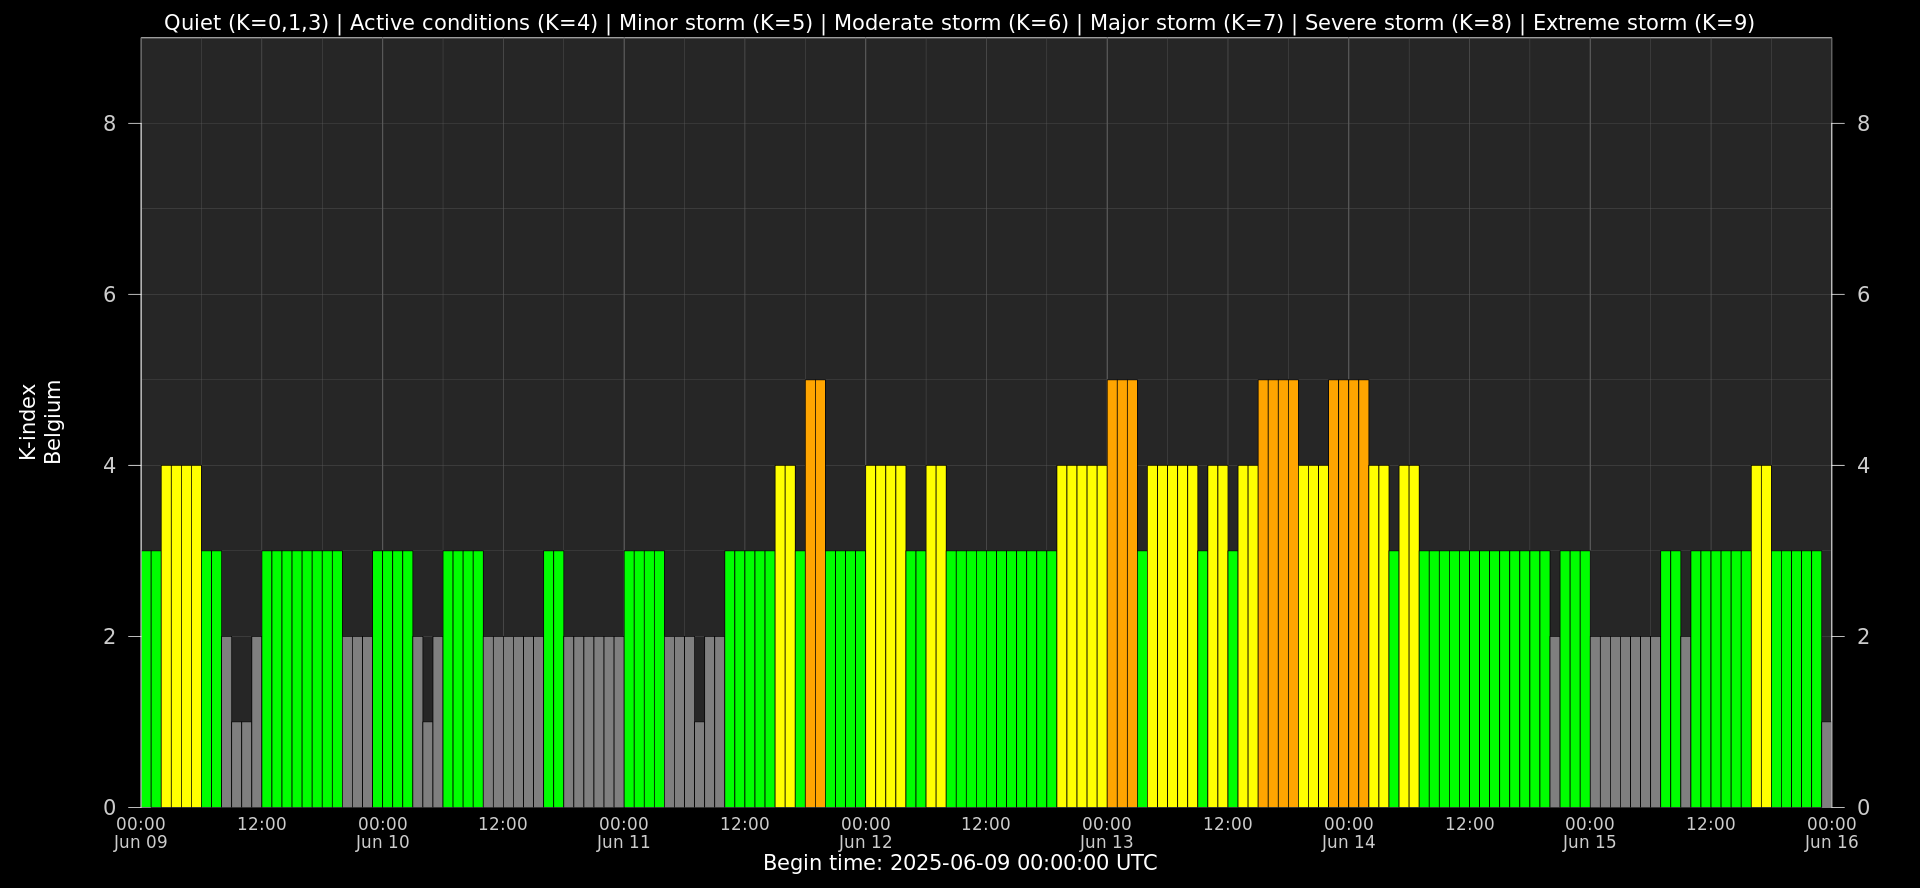
Local K-type magnetic activity index for Belgium based on data from Dourbes (DOU) and Manhay (MAB). Comparing the data from both measurement stations allows to reliably remove outliers from the magnetic data. At the same time the operational service availability is improved: whenever data from one observatory is not available, the single-station index obtained from the other can be used as a fallback system.
Both the two-station index and the single station indices are available here: http://ionosphere.meteo.be/geomagnetism/K_BEL/
The SIDC Space Weather Briefing
The forecaster on duty presented the SIDC briefing that gives an overview of space weather from June 9 to 15.
The pdf of the presentation can be found here: https://www.stce.be/briefings/20250616_SWbriefing.pdf

Review of Ionospheric Activity
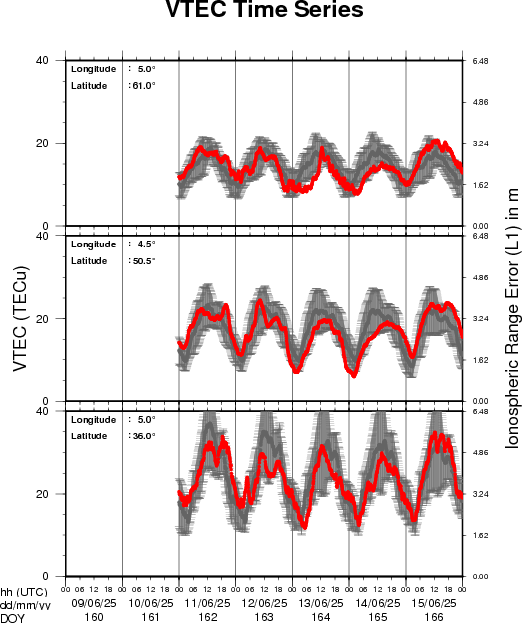
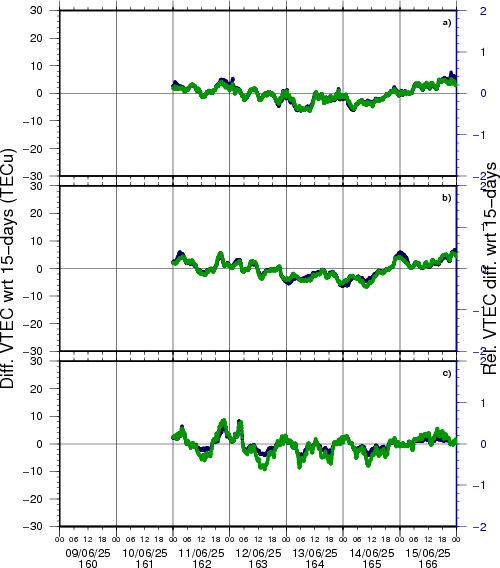
VTEC time series at 3 locations in Europe from 9 Jun 2025 till 15 Jun 2025
The top figure shows the time evolution of the Vertical Total Electron Content (VTEC) (in red) during the last week at three locations:
a) in the northern part of Europe(N 61deg E 5deg)
b) above Brussels(N 50.5deg, E 4.5 deg)
c) in the southern part of Europe(N 36 deg, E 5deg)
This top figure also shows (in grey) the normal ionospheric behaviour expected based on the median VTEC from the 15 previous days.
The time series below shows the VTEC difference (in green) and relative difference (in blue) with respect to the median of the last 15 days in the North, Mid (above Brussels) and South of Europe. It thus illustrates the VTEC deviation from normal quiet behaviour.
The VTEC is expressed in TECu (with TECu=10^16 electrons per square meter) and is directly related to the signal propagation delay due to the ionosphere (in figure: delay on GPS L1 frequency).
The Sun's radiation ionizes the Earth's upper atmosphere, the ionosphere, located from about 60km to 1000km above the Earth's surface.The ionization process in the ionosphere produces ions and free electrons. These electrons perturb the propagation of the GNSS (Global Navigation Satellite System) signals by inducing a so-called ionospheric delay.
See http://stce.be/newsletter/GNSS_final.pdf for some more explanations; for more information, see https://gnss.be/SpaceWeather
STCE Courses and seminars
Courses, seminars, presentations and events with the Sun-Space-Earth system and Space Weather as the main theme. We provide occasions to get submerged in our world through educational, informative and instructive activities.
* Jun 20, 2025, STCE seminar: The Vigil mission to L5
* Jun 23-25, 2025, STCE Space Weather Introductory Course, Brussels, Belgium
* Oct 23-25, ESWW Space Weather Training by Umea University and STCE, Kiruna, Sweden
* Oct 27-31, European Space Weather Week, Umea, Sweden - https://esww.eu/
* Nov 17-19, 2025, STCE Space Weather Introductory Course, Brussels, Belgium - register: https://events.spacepole.be/event/217/
To register for a course and check the seminar details, navigate to the STCE Space Weather Education Center: https://www.stce.be/SWEC
If you want your event in the STCE newsletter, contact us: stce_coordination at stce.be
Website: https://www.stce.be/SWEC