- Table of Content
- 1.Prominences ri...
- 2.Review of Sola...
- 3.International ...
- 4.PROBA2 Observa...
- 5.Geomagnetic Ob...
- 6.The SIDC Space...
- 7.Review of Iono...
- 8.STCE courses a...
2. Review of Solar and Geomagnetic Activity
3. International Sunspot Number by SILSO
4. PROBA2 Observations (14 Jul 2025 - 20 Jul 2025)
5. Geomagnetic Observations in Belgium
6. The SIDC Space Weather Briefing
7. Review of Ionospheric Activity
8. STCE courses and presentations
Prominences rise to glory
Solar prominences are clouds of charged particles ("plasma") above the solar surface squeezed between magnetic regions of opposite magnetic polarity. Being cooler and denser than the plasma underneath and their surroundings, they appear as bright blobs when seen near the solar limb and as dark lines when seen on the solar disk (then they are called "filaments"). Special filters are required to observe these features, such as in the Hydrogen-alpha (H-alpha) line in the red part of the solar spectrum, or in some extreme ultraviolet (EUV) passbands.
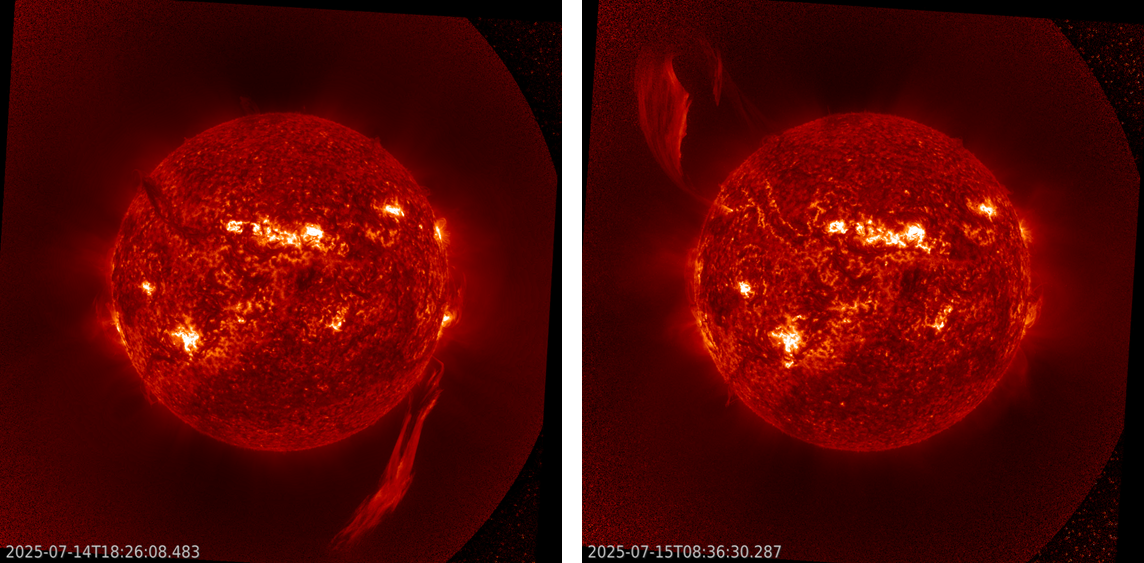
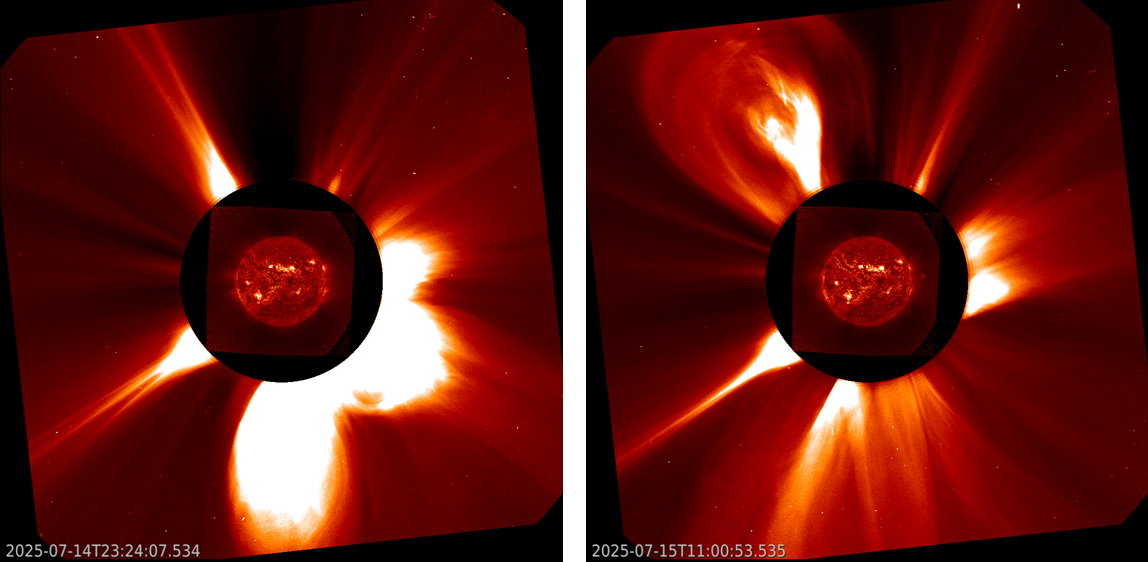
Two spectacular eruptions took place last week. On 14 July, there was a prominence eruption near the Sun's southwest limb, followed by a filament eruption from the northeast solar quadrant a day later. The eruptions can be seen in the wide-field EUV imagery by GOES/SUVI above, with clips in the online version of this newsitem at https://www.stce.be/news/777/welcome.html The second eruption showed long ribbons parallel to the original position of the erupted filament on both the east and west side, an effect of the reconnection higher up in the solar atmosphere. The charged particles get accelerated towards the denser inner solar atmosphere, where they collide with other particles, heat the local chromospheric environment and make it evaporate. The footpoints of some faint coronal loops can be seen embedded in the expanding disturbance, as shown in the online annotated still combining SUVI 304 (orange) with SUVI 171 (green) imagery (see this STCE newsitem for more info and another example - https://www.stce.be/news/255/welcome.html ). The length of the ribbons is at least 350.000 km -about the distance between the Earth and the Moon- and are often dubbed a "canyon-of-fire". The coronagraphic images (SOHO/LASCO C2) below show the associated coronal mass ejections (CMEs) which had plane-of-the-sky speeds around 400-500 km/s. They were not directed to Earth. The online clip shows some other CMEs, but they are related to eruptive activity at or behind the solar limb.
Review of Solar and Geomagnetic Activity
WEEK 1281 from 2025 Jul 14
Solar active regions and flares
Solar flaring activity was low during the past week, with 32 C-class flares detected in total. The brightest flare was SIDC flare 4922, a double-peaked C7 flare with the highest peak on 20 July at 07:41 UTC and is associated with SIDC sunspot group 562 (NOAA Active Region (AR) 4136, Beta-Gamma magnetic configuration). SIDC sunspot groups 562 and 559 (NOAA AR 4143, Beta magnetic configuration) produced a C5 flare each during the past week. The rest of the flaring activity was below the C4 level.
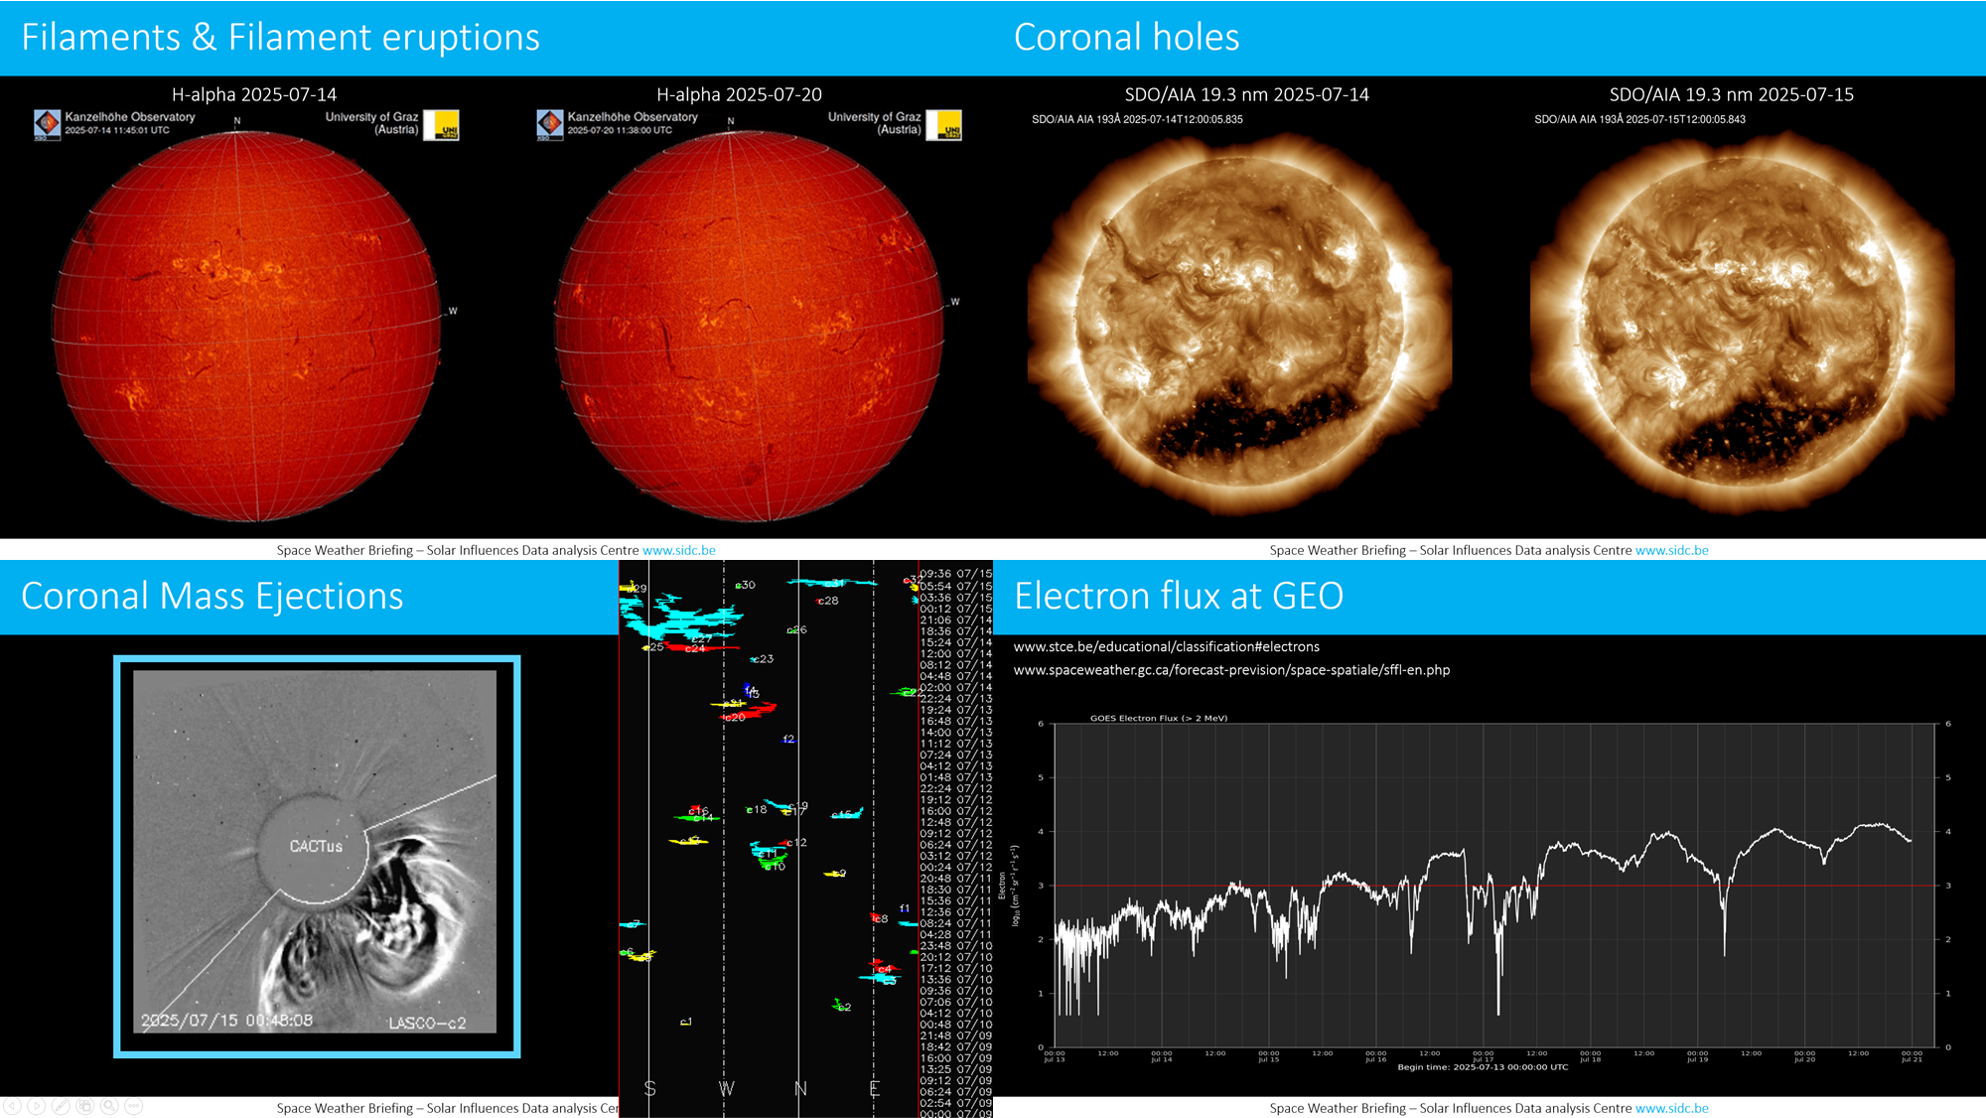
Coronal mass ejections
No Earth-directed Coronal Mass Ejections (CME) were observed in the past week.
Coronal holes
SIDC Coronal Hole (CH) 104 (low to mid latitude, positive polarity), an exceptionally elongated CH, was crossing the central meridian from 8 to 19 July. SIDC CH 116 (negative polarity), featuring an irregular shape extending from the equator to the middle of the northern hemisphere, started crossing the central meridian on 20 July.
Proton flux levels
The greater than 10 MeV proton flux was at nominal levels during the past week.
Electron fluxes at GEO
The greater than 2 MeV electron flux, as measured by GOES 19, crossed the 1000 pfu alert threshold on 15 July and peaked at 14000 pfu on 20 July at 16:40 UTC. It remained above the alert threshold for the rest of the past week.
Solar wind
Fast Solar Wind (SW) conditions were registered from the start of the past week until 18 July. This was the effect of a High Speed Stream (HSS) associated with SIDC Coronal Hole (CH) 104. During the Fast SW conditions the speed ranged from 550 to 790 km/s, while after 18 July it varied between 400 and 590 km/s. The interplanetary magnetic field (B) varied between 2 and 11 nT and its North-South component (Bz) fluctuated between -10 and 9 nT.
Geomagnetism
The global geomagnetic conditions reached minor storm levels on 14, 15 and 16 July (NOAA Kp 5 on 15 July at 06:00-09:00 UTC and on 16 July at 21:00-24:00 UTC, Kp 5- on 14 July at 18:00-21:00 UTC and on 15 July at 09:00-12:00 UTC). The rest of the past week, the conditions were quiet to unsettled (NOAA Kp 1- to 4). The local geomagnetic conditions reached the minor storm level (K BEL 5) on 15 July at 06:00-09:00 UTC. The rest of the week they were quiet to active (K BEL 1 to 4).
International Sunspot Number by SILSO

The daily Estimated International Sunspot Number (EISN, red curve with shaded error) derived by a simplified method from real-time data from the worldwide SILSO network. It extends the official Sunspot Number from the full processing of the preceding month (green line), a few days more than one solar rotation. The horizontal blue line shows the current monthly average. The yellow dots give the number of stations that provided valid data. Valid data are used to calculate the EISN. The triangle gives the number of stations providing data. When a triangle and a yellow dot coincide, it means that all the data is used to calculate the EISN of that day.
PROBA2 Observations (14 Jul 2025 - 20 Jul 2025)
Solar Activity
Solar flare activity was low during the week.
In order to view the activity of this week in more detail, we suggest to go to the following website from which all the daily (normal and difference) movies can be accessed: https://proba2.oma.be/ssa
This page also lists the recorded flaring events.
A weekly overview movie can be found here (SWAP week 799). https://proba2.sidc.be/swap/data/mpg/movies/weekly_movies/weekly_movie_2025_07_14.mp4
Details about some of this week's events can be found further below.
If any of the linked movies are unavailable they can be found in the P2SC movie repository here https://proba2.sidc.be/swap/data/mpg/movies/
Tuesday Jul 15
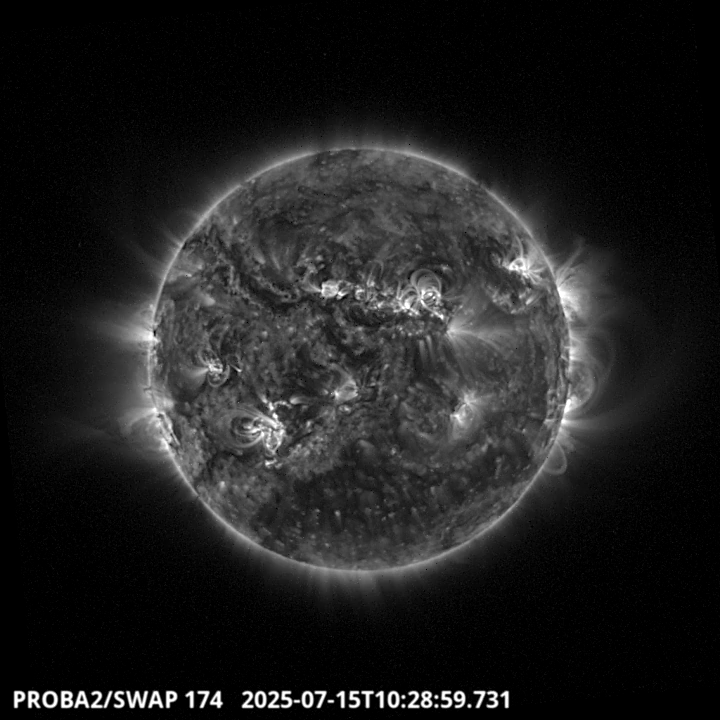
An enormous filament curled and erupted over the northeastern solar limb around 3 UT. It
carves a canyon which is visible on the SWAP image above.
Geomagnetic Observations in Belgium

Local K-type magnetic activity index for Belgium based on data from Dourbes (DOU) and Manhay (MAB). Comparing the data from both measurement stations allows to reliably remove outliers from the magnetic data. At the same time the operational service availability is improved: whenever data from one observatory is not available, the single-station index obtained from the other can be used as a fallback system.
Both the two-station index and the single station indices are available here: http://ionosphere.meteo.be/geomagnetism/K_BEL/
The SIDC Space Weather Briefing
The forecaster on duty prepared the SIDC briefing that gives an overview of space weather from July 14 to 20.
The pdf of the presentation can be found here: https://www.stce.be/briefings/20250721_SWbriefing.pdf
Review of Ionospheric Activity


VTEC time series at 3 locations in Europe from 14 Jul 2025 till 20 Jul 2025
The top figure shows the time evolution of the Vertical Total Electron Content (VTEC) (in red) during the last week at three locations:
a) in the northern part of Europe(N 61deg E 5deg)
b) above Brussels(N 50.5deg, E 4.5 deg)
c) in the southern part of Europe(N 36 deg, E 5deg)
This top figure also shows (in grey) the normal ionospheric behaviour expected based on the median VTEC from the 15 previous days.
The time series below shows the VTEC difference (in green) and relative difference (in blue) with respect to the median of the last 15 days in the North, Mid (above Brussels) and South of Europe. It thus illustrates the VTEC deviation from normal quiet behaviour.
The VTEC is expressed in TECu (with TECu=10^16 electrons per square meter) and is directly related to the signal propagation delay due to the ionosphere (in figure: delay on GPS L1 frequency).
The Sun's radiation ionizes the Earth's upper atmosphere, the ionosphere, located from about 60km to 1000km above the Earth's surface.The ionization process in the ionosphere produces ions and free electrons. These electrons perturb the propagation of the GNSS (Global Navigation Satellite System) signals by inducing a so-called ionospheric delay.
See http://stce.be/newsletter/GNSS_final.pdf for some more explanations; for more information, see https://gnss.be/SpaceWeather
STCE courses and presentations
Courses, seminars, presentations and events with the Sun-Space-Earth system and Space Weather as the main theme. We provide occasions to get submerged in our world through educational, informative and instructive activities.
* Aug 25, Guest lecture: De Zon, Zomerschool Sterrenkunde, Vereniging voor Sterrenkunde, Leuven, Belgium
* Sep 1, STCE seminar: High resolution solar telescopes: the Dutch Open Telescope and beyond, Space Pole Uccle
* Sep 8-10, STCE course: Role of the ionosphere and space weather in military communications, Brussels, Belgium - register: https://events.spacepole.be/event/226/
* Sep 20, Public Lecture: België op weg naar de zon met Proba-3, UGhent Volkssterrenwacht Armand Pien, Gent, Belgium
* Oct 23-25, ESWW Space Weather Training by Umea University and STCE, Kiruna, Sweden - Full
* Oct 27-31, European Space Weather Week, Umea, Sweden - https://esww.eu/
* Nov 17-19, STCE Space Weather Introductory Course, Brussels, Belgium - register: https://events.spacepole.be/event/217/
To register for a course and check the seminar details, navigate to the STCE Space Weather Education Center: https://www.stce.be/SWEC
If you want your event in the STCE newsletter, contact us: stce_coordination at stce.be

Website: https://www.stce.be/SWEC