- Table of Content
- 1.Space weather ...
- 2.Review of Sola...
- 3.International ...
- 4.PROBA2 Observa...
- 5.Geomagnetic Ob...
- 6.The SIDC Space...
- 7.Review of Iono...
- 8.STCE courses a...
2. Review of Solar and Geomagnetic Activity
3. International Sunspot Number by SILSO
4. PROBA2 Observations (21 Jul 2025 - 27 Jul 2025)
5. Geomagnetic Observations in Belgium
6. The SIDC Space Weather Briefing
7. Review of Ionospheric Activity
8. STCE courses and presentations
Space weather instrumentation
The next few pictures reflect a selection of solar images, space weather graphs, tools and instrumentation that are -in most cases- often used in the related space weather (SWx) domain. Can you recognize the source (satellite, instrument, location,...) even though the name has been removed? To make things not too difficult, in most cases a few clues have been left behind. The solutions are in the last paragraph, with UL: Upper Left, UR: Upper Right, ML: Middle Left, MR: Middle Right, LL: Lower Left, LR: Lower Right. Most of the acronyms can be found on the STCE's SWx acronym page at https://www.stce.be/educational/acronym Have fun!
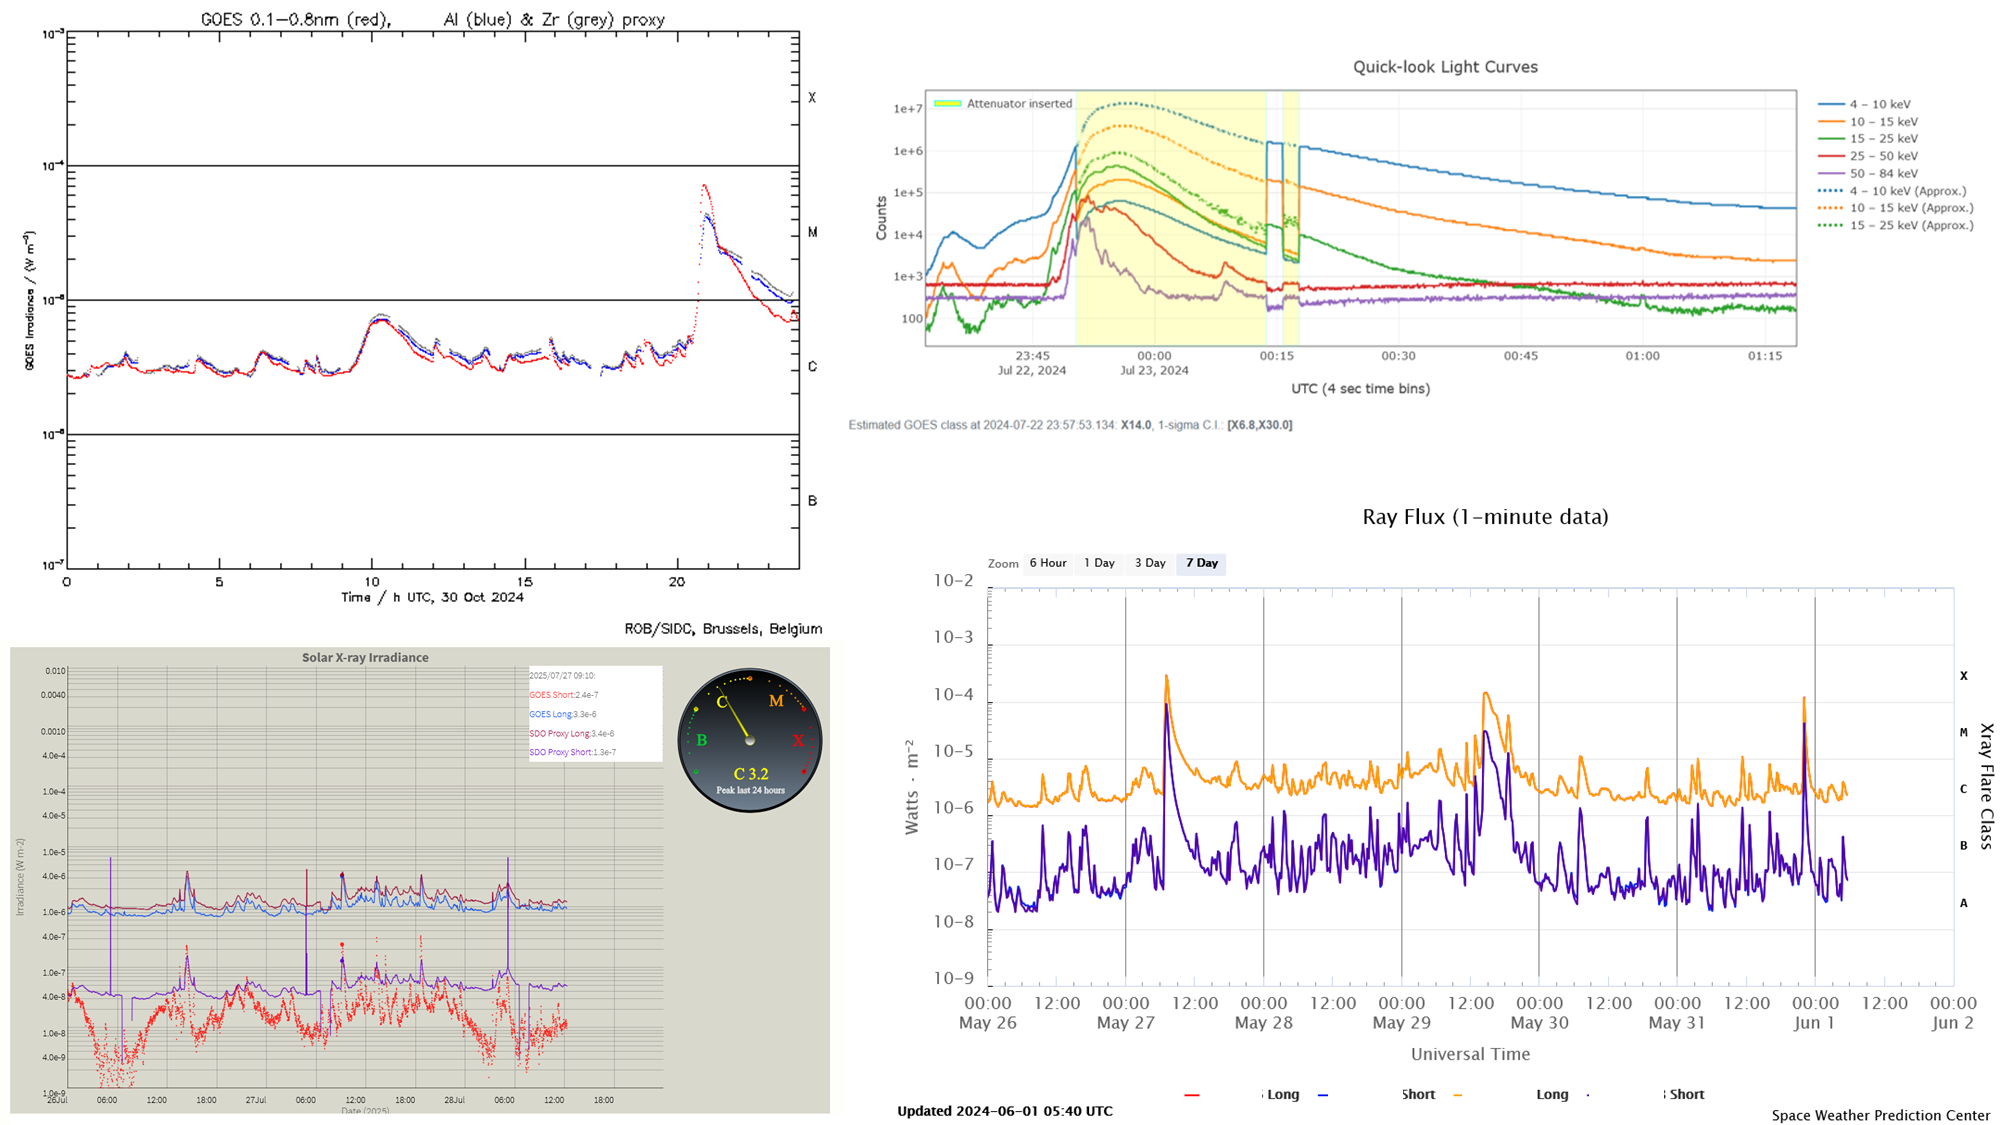
Solar Flares
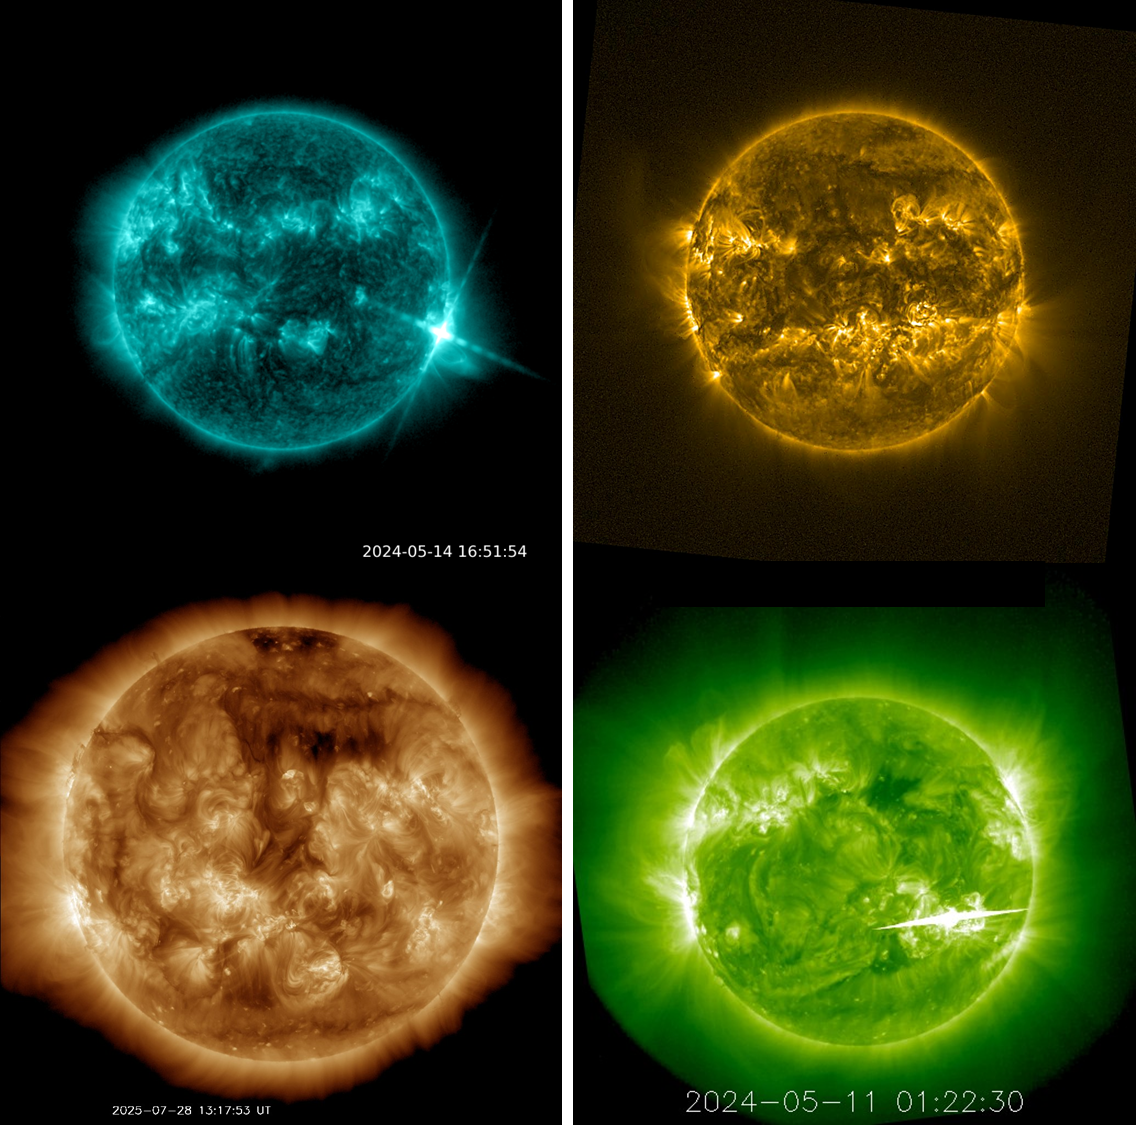
Solar EUV imagery
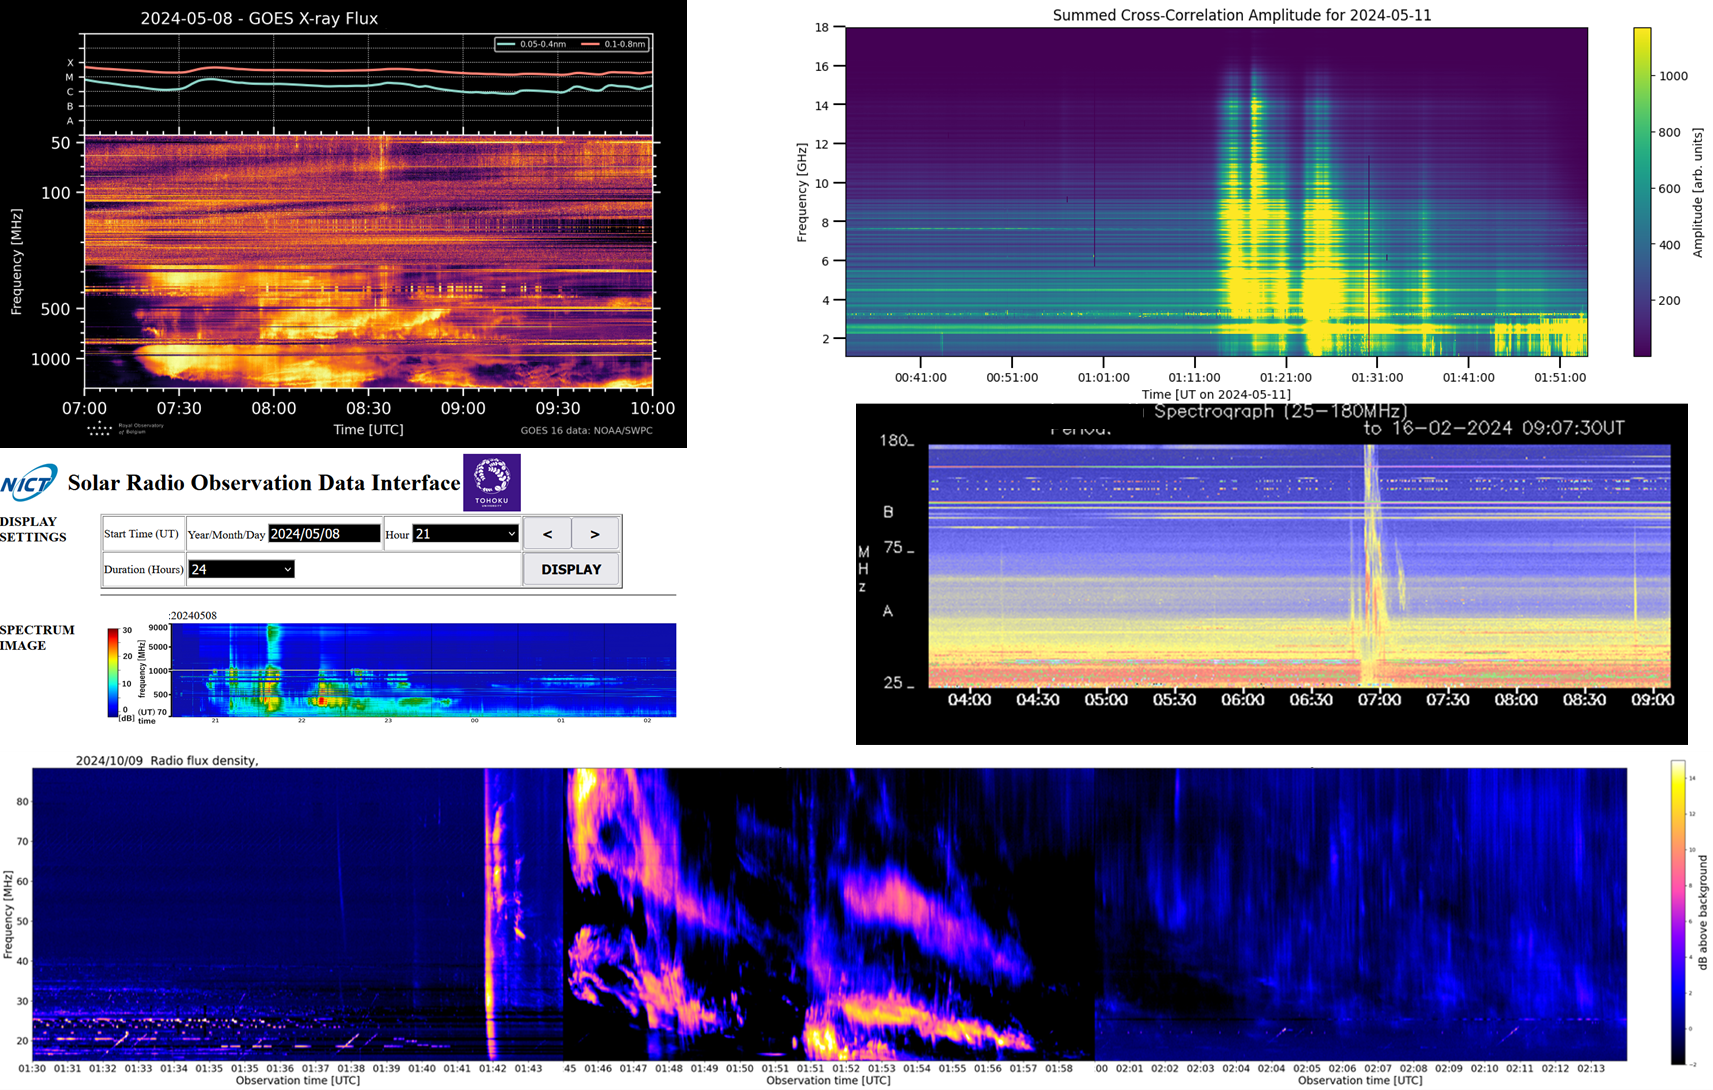
Solar radio spectrograms
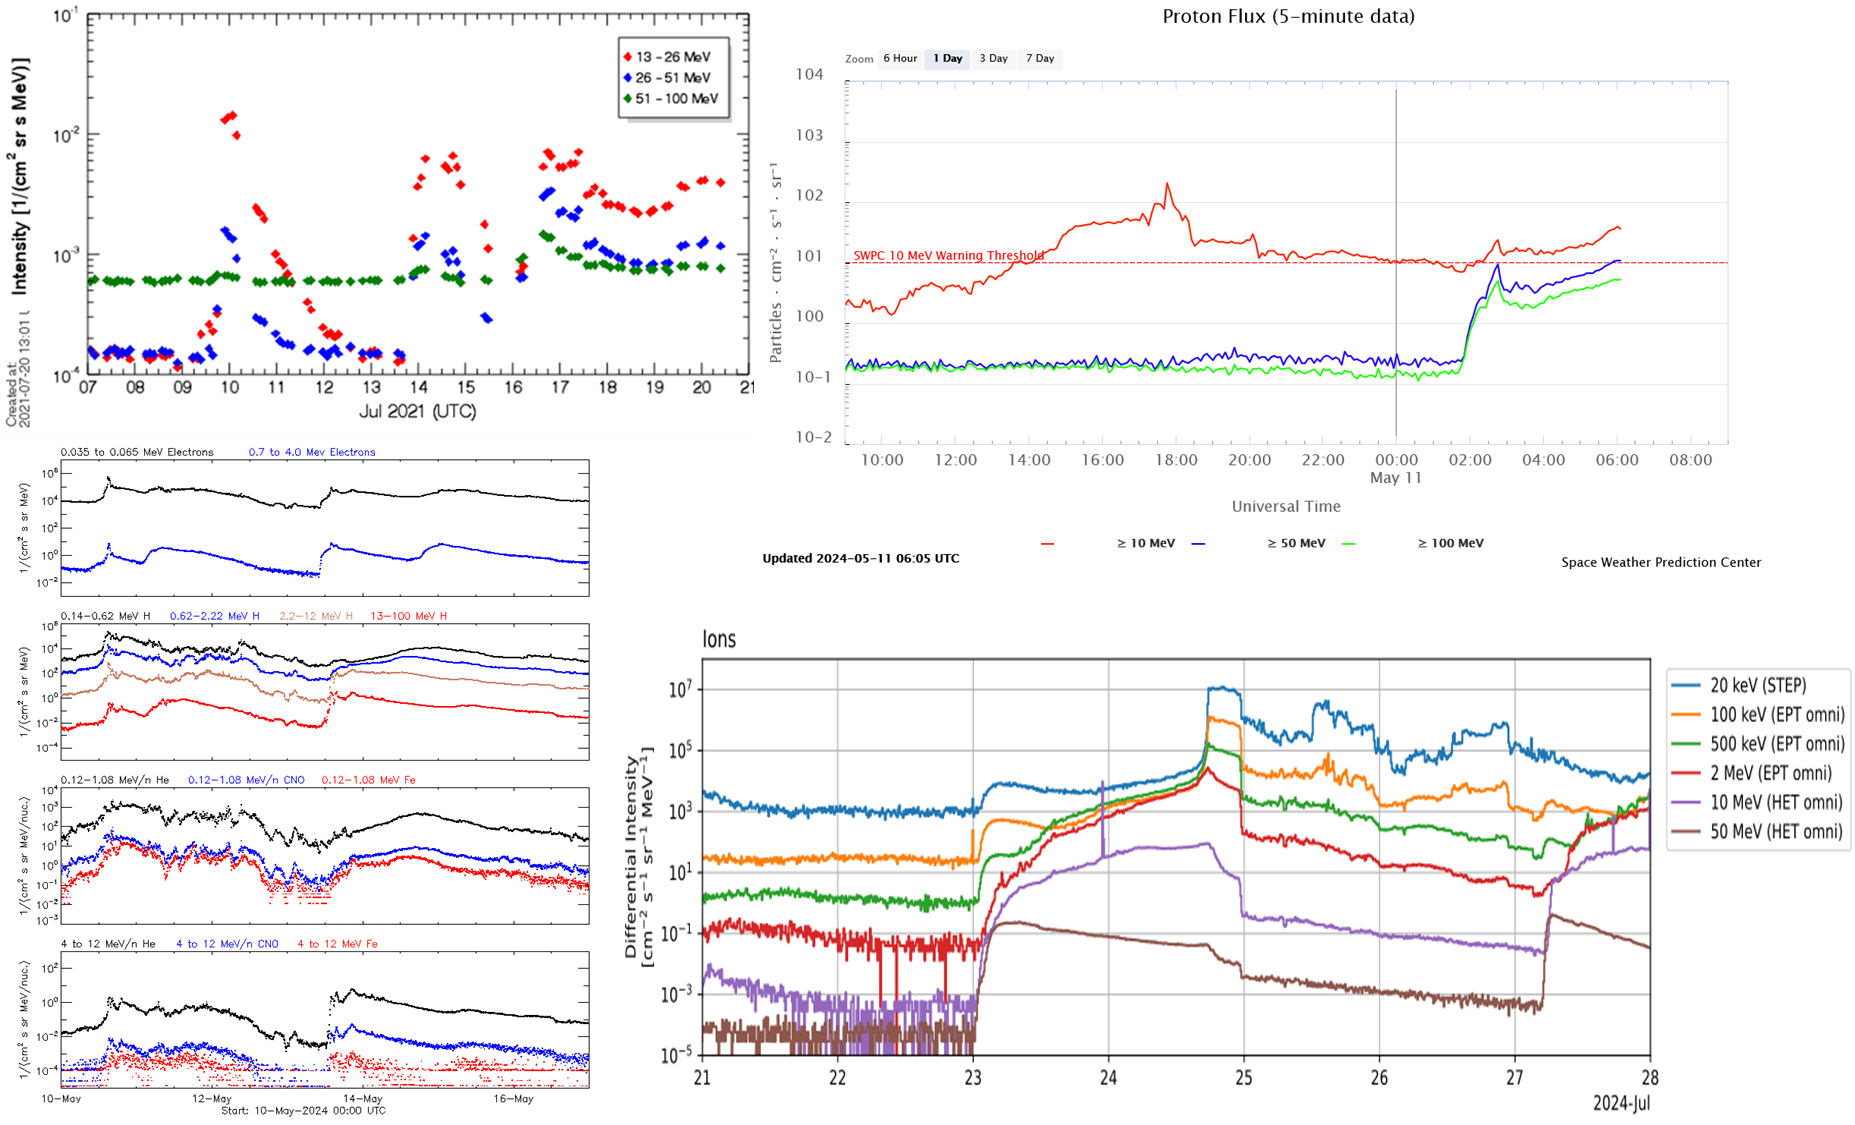
Solar energetic particles
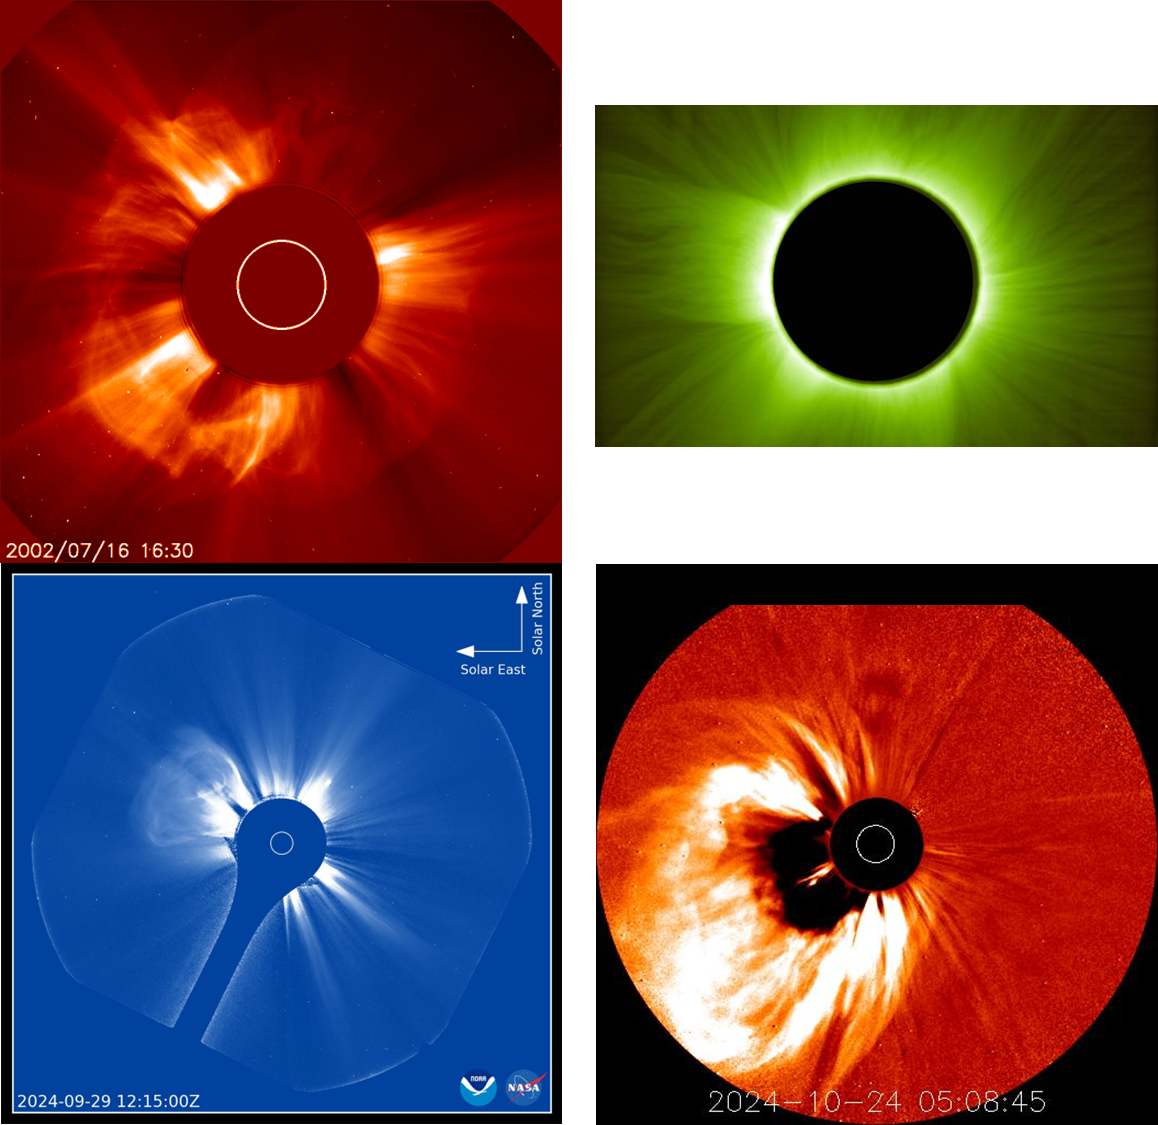
Coronagraphs
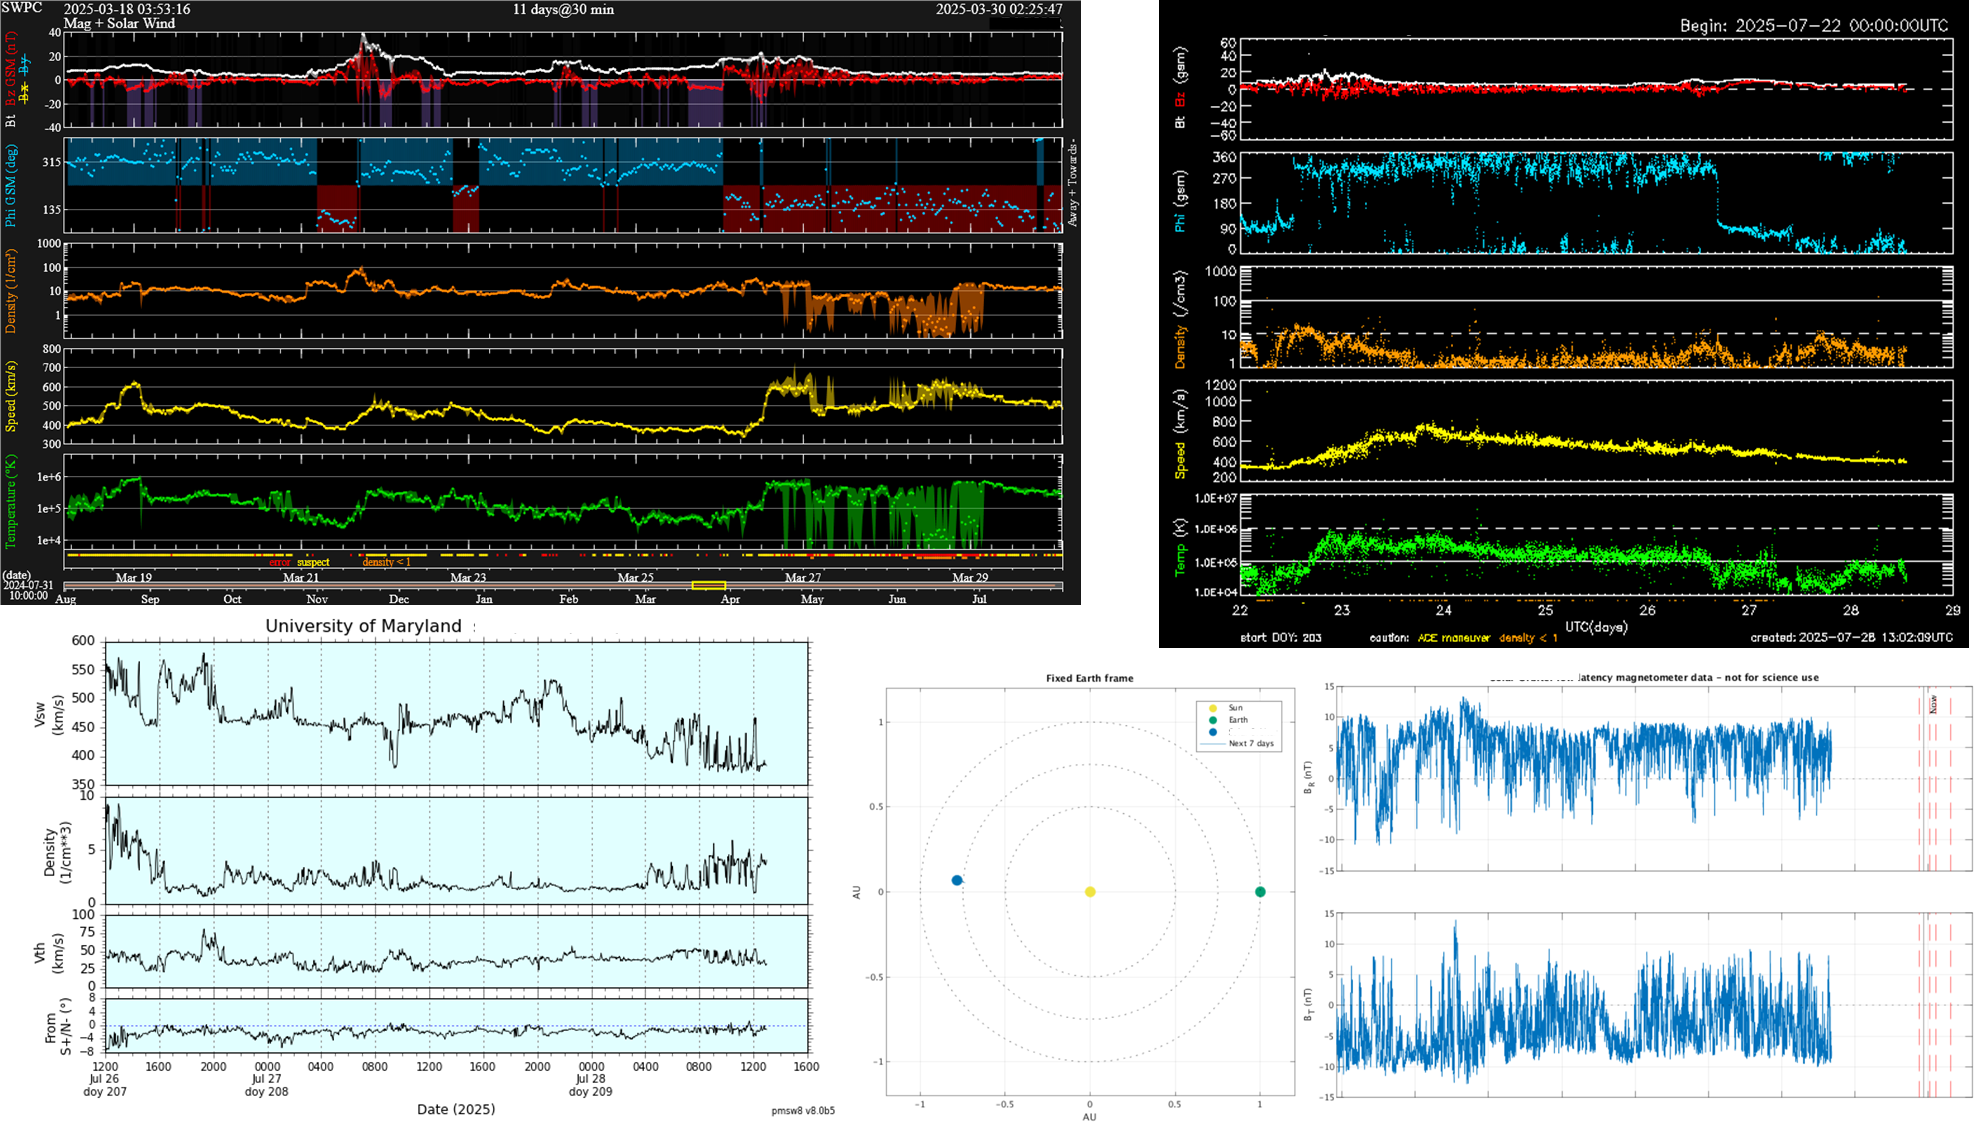
Solar wind (satellites)
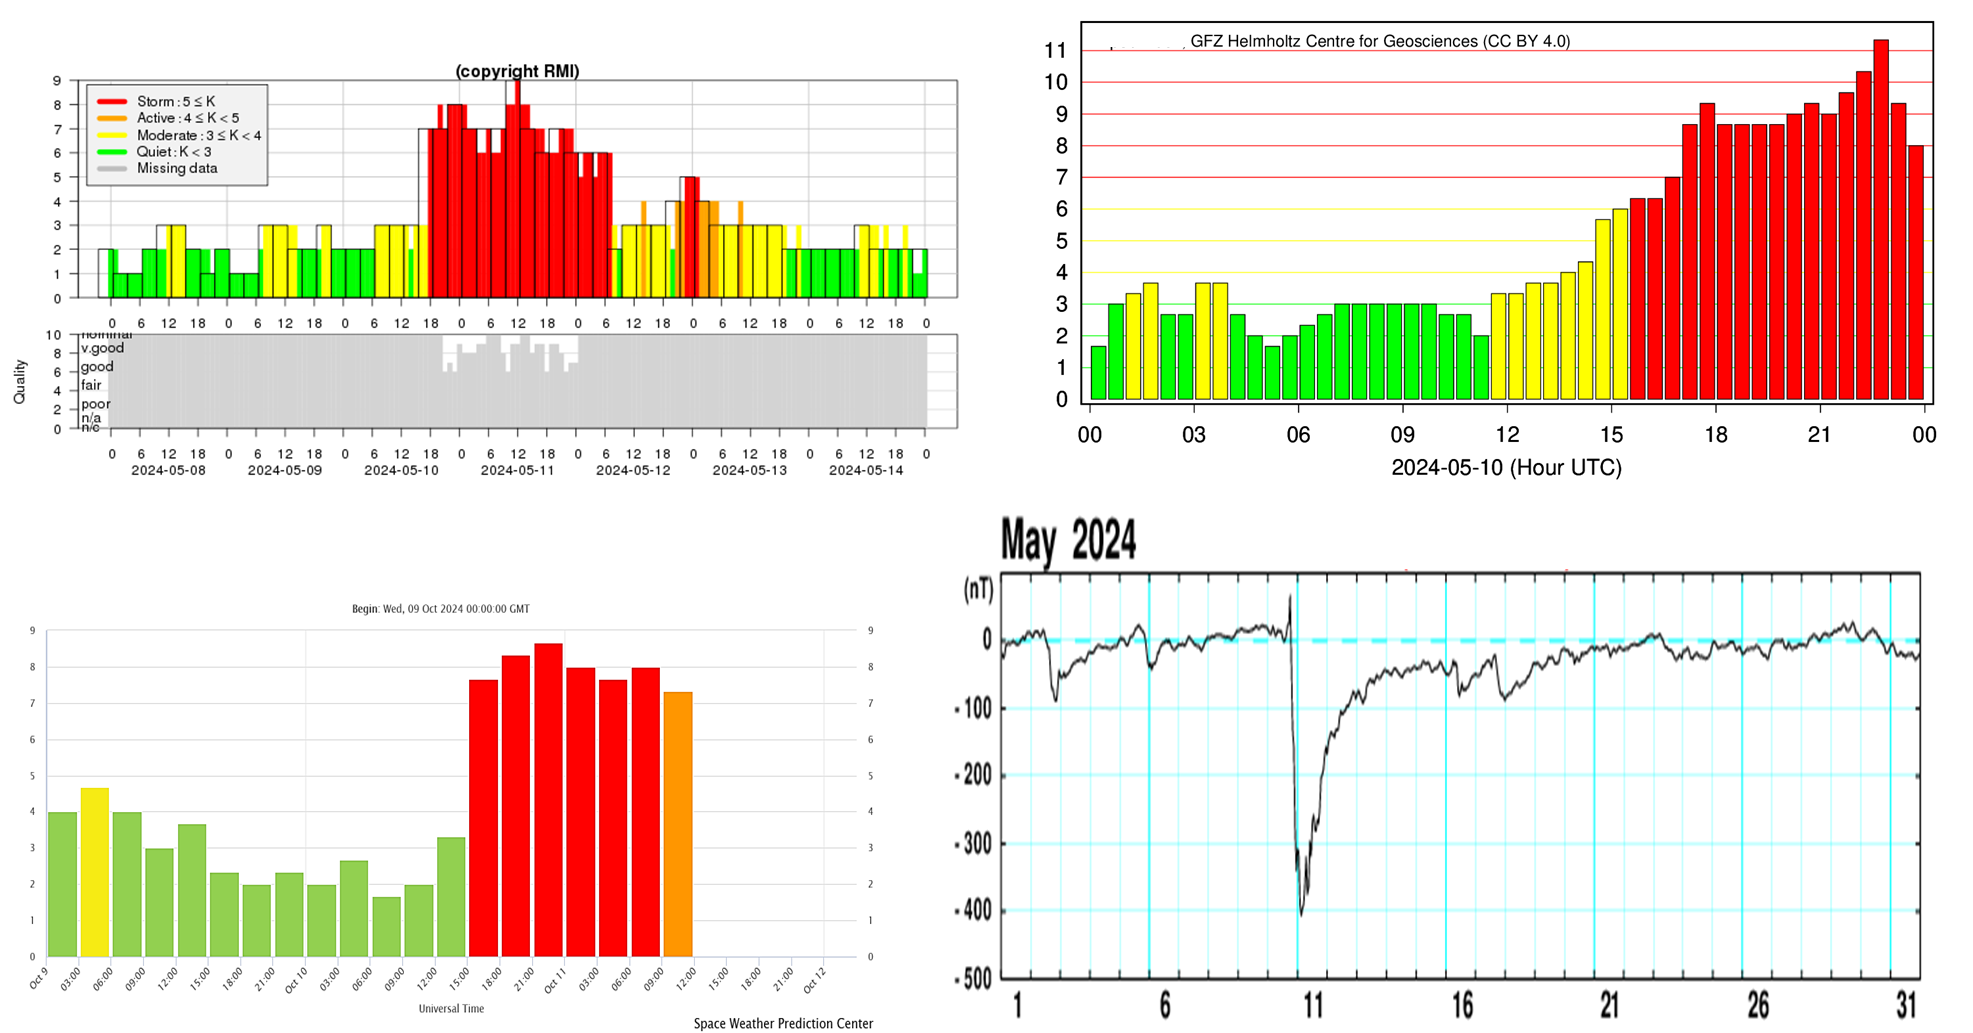
Geomagnetic indices
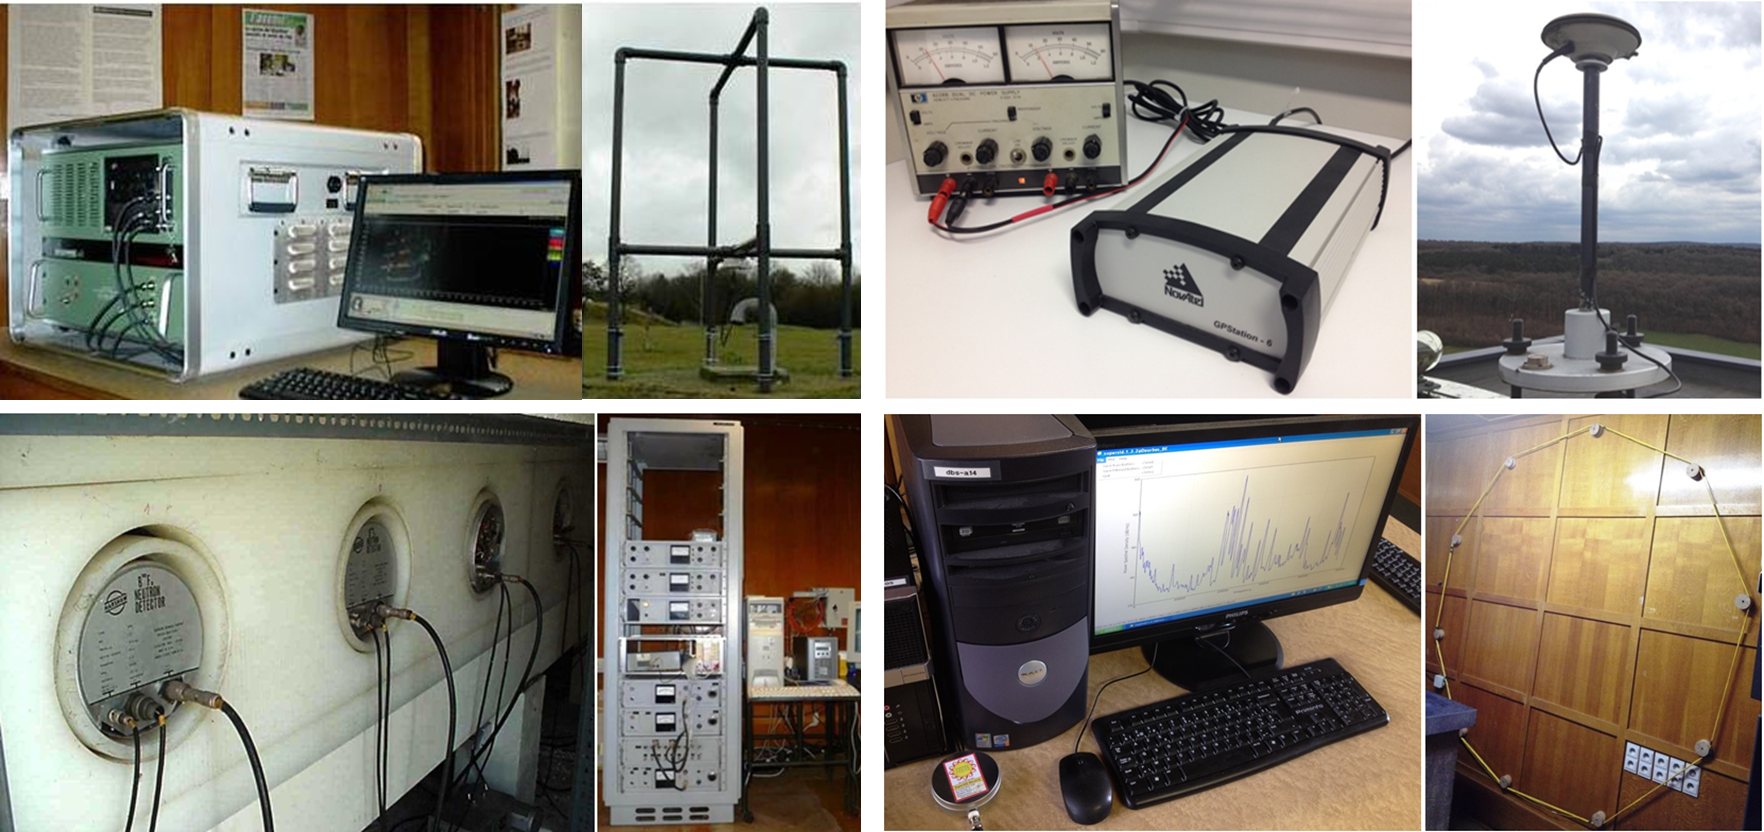
SWx instrumentation in Dourbes (Belgium)
Solutions
- Solar flares - UL: PROBA2/LYRA ; UR: Solar Orbiter/STIX ; LL: SDO/EVE ; LR: GOES/XRS
- Solar EUV imagery - UL: GOES/SUVI ; UR: PROBA2/SWAP ; LL: SDO/AIA ; LR: STEREO-A/EUVI
- Solar radio spectrograms - UL: SIDC/Humain (Belgium) ; UR: NJIT/EOVSA (USA) ; ML: NICT/Yamagawa (Japan) ; MR: Learmonth Observatory (Australia) ; Bottom: e-CALLISTO
- Solar energetic particles - UL: SOHO/ERNE ; UR: GOES/SEISS ; LL: STEREO-A/IMPACT ; LR: Solar Orbiter/EPD
- Coronagraphs - UL: SOHO/LASCO C2 ; UR: Proba-3/ASPIICS ; LL: GOES/CCOR-1 ; LR: STEREO-A/COR2
- Solar wind (satellites) - UL: DSCOVR ; UR: ACE ; LL: SOHO ; LR: Solar Orbiter
- Geomagnetic indices: UL: K BEL (RMI, STCE) ; UR: Hp30 (GFZ Potsdam) ; LL: Estimated Kp (NOAA, SWPC) ; LR: Dst (WDC Kyoto)
- SWx instrumentation in Dourbes (Belgium): UL: Digisonde (ionosphere) ; UR: GNSS receiver ; LL: Neutron monitor ; LR: Sudden Ionospheric Disturbances monitor (solar flares in VLF)
Review of Solar and Geomagnetic Activity
WEEK 1282 from 2025 Jul 21
Solar active regions and flares
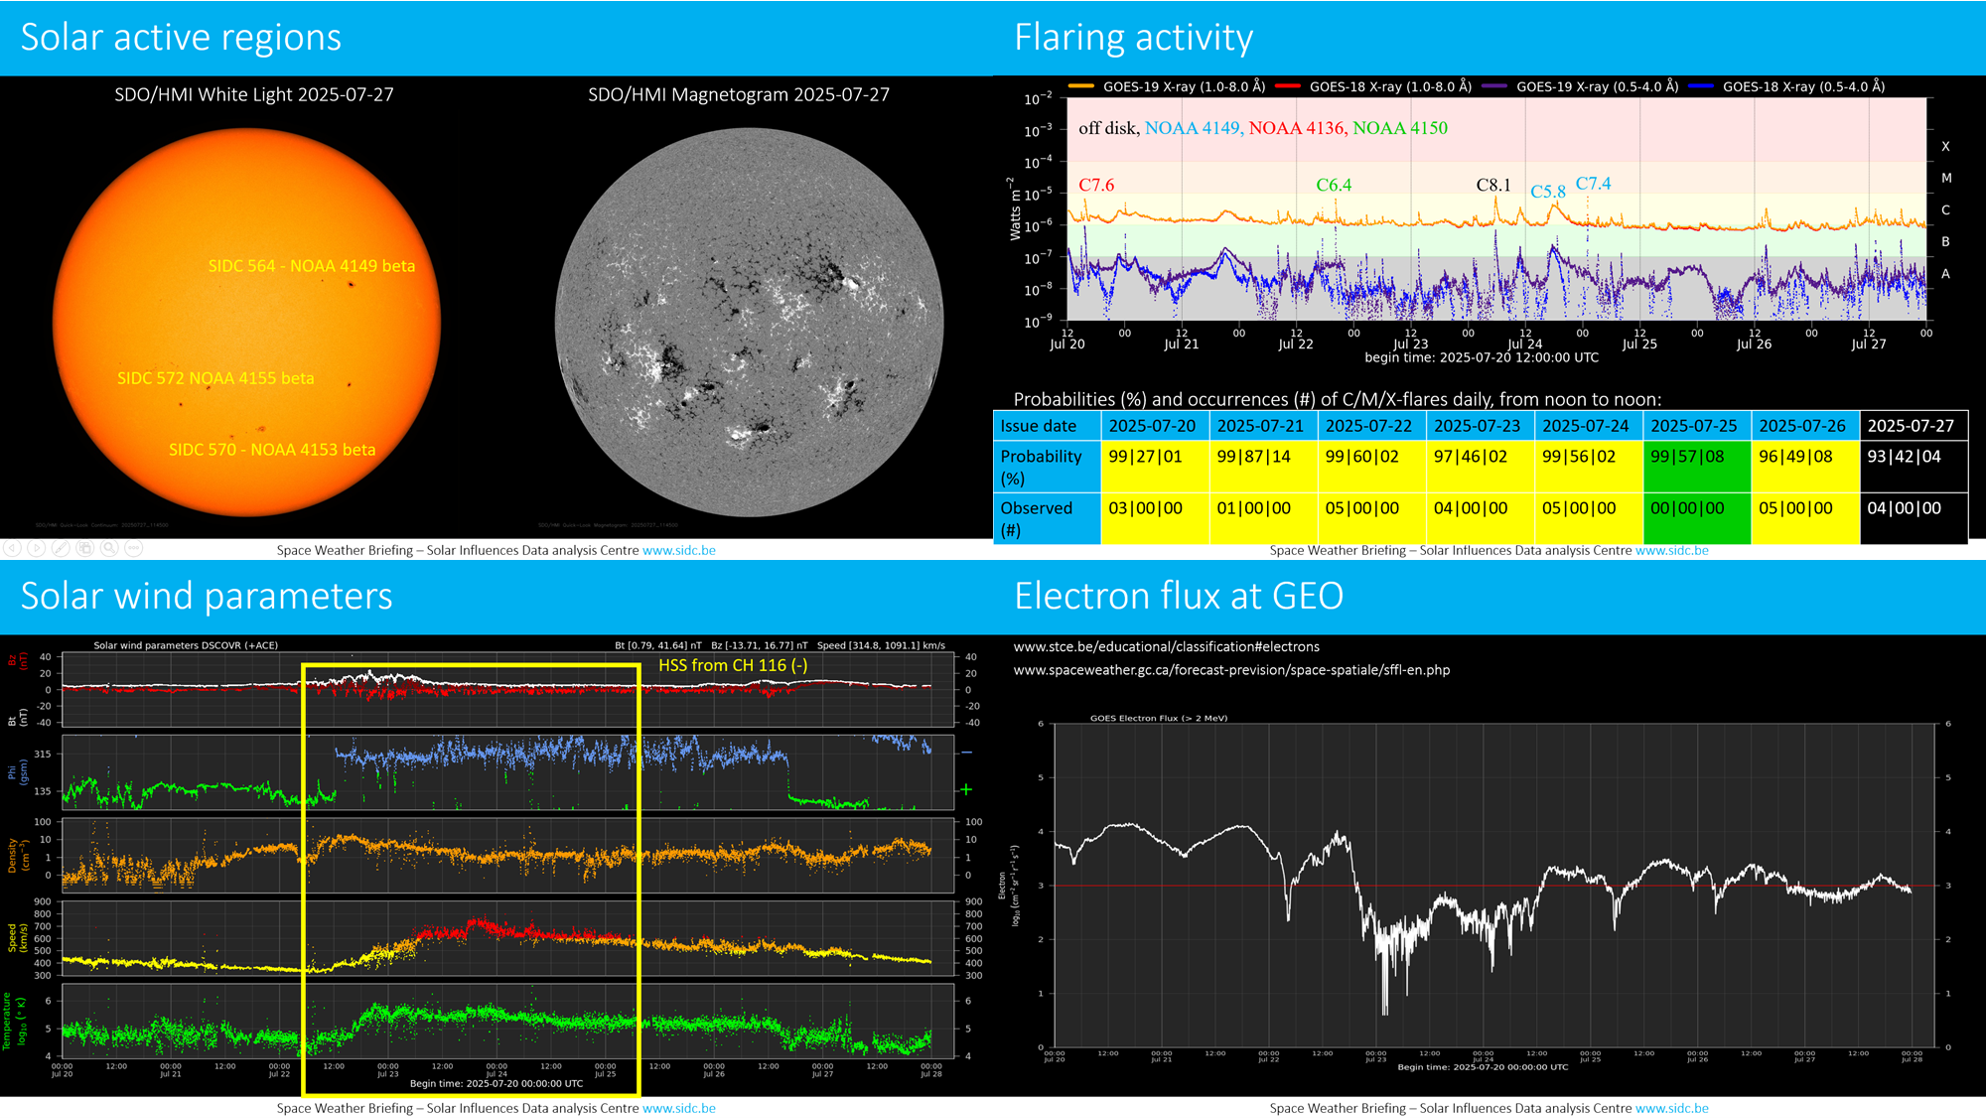
Solar flaring activity was low during the week, with only C-class flares. The strongest flares were a C8.1 flare (SIDC Flare 4939) and a C7.4 flare (SIDC Flare 4944). The C8.1 flare, from beyond the west limb, peaked at 05:45 UTC on July 24. The C7.4 flare, associated with SIDC Sunspot Group 564 (NOAA Active Region 4149, magnetic type beta-gamma), peaked at 01:01 UTC on July 25. There was a total of twenty-four active regions on the visible disk during the week. The most complex were SIDC Sunspot Group 564 (NOAA Active Region 4149) and SIDC 572 (NOAA Active Region 4155), both developing to a magnetic type beta-gamma during the week.
Coronal mass ejections
A few Coronal Mass Ejections (CMEs) were detected during the week. Almost all of them were either events near the west or east limb or backsided and had no impact on Earth. SIDC CME 528 was observed in LASCO/C2 and C3 coronagraph imagery starting from around 15:00 UTC on July 21, lifting off the east limb. No clear source was identified on the visible disk, suggesting a backsided event. A faint partial halo CME (SIDC CME 530) was observed in LASCO/C2 and C3 coronagraph imagery starting from around 08:00 UTC on July 23. The CME was probably associated with a filament eruption in the southwest quadrant seen in SUVI 304 data from around 02:30 UTC on July 23.
Coronal holes
An elongated, mid-latitude, negative polarity coronal hole (SIDC Coronal Hole 116) has crossed the central meridian between July 19 and July 21. An associated high-speed stream began arriving at Earth in the second half of July 22. A mid-latitude, negative polarity coronal hole (SIDC Coronal Hole 121) started crossing the central solar meridian on July 26.
Proton flux levels
The greater than 10 MeV proton flux was below the 10 pfu threshold throughout the week.
Electron fluxes at GEO
The greater than 2 MeV electron flux as measured by GOES 18 was mostly above the 1000 pfu threshold during the week. It dropped below the 1000 pfu threshold between approximately 20:00 UTC on July 22 and 13:00 UTC on July 24. The 24-hour electron fluence was at high levels at the beginning of the week and gradually decreased until it reached nominal levels around 17:00 UTC on July 23 and remained so for the following 24 hours. It then increased to moderate levels for the rest of the week.
Solar wind
The solar wind parameters (ACE) were enhanced starting from the second half of July 22, under the influence of the high-speed stream associated with the negative polarity coronal hole (SIDC Coronal Hole 116). The solar wind speed peaked at 780 km/s on July 24, the interplanetary magnetic field values were between 4 nT and 24 nT, the Bz component varied between -14 nT and 17 nT. A gradual return to a slow solar wind regime followed. The solar wind conditions were slightly enhanced again on July 26 under the waning influence of the high-speed stream from the negative polarity coronal hole (SIDC Coronal Hole 116) and a possible, but less certain, ICME arrival associated with the Coronal Mass Ejection (SIDC CME 530) that lifted off around 08:00 UTC on July 23. The solar wind speed reached values around 610 km/s, the interplanetary magnetic field reached values up to 11 nT and the southward component of the interplanetary magnetic field dropped to -9 nT. Through the end of the week, solar wind parameters reflected mostly slow solar wind conditions.
Geomagnetism
The global geomagnetic conditions briefly reached minor storm conditions (NOAA Kp 5) on July 22 and July 23, under the influence of the high-speed stream associated with the negative polarity coronal hole (SIDC Coronal Hole 116). Geomagnetic conditions globally and locally were mostly at quiet to unsettled levels (NOAA Kp 1 to 3, K BEL 1 to 3) during the rest of the week, with isolated active intervals (NOAA 4, K BEL 4) in the second half of July 26.
International Sunspot Number by SILSO
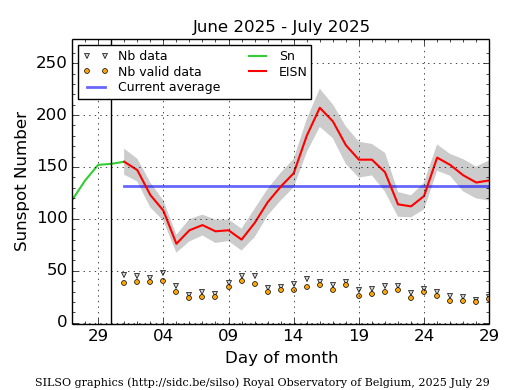
The daily Estimated International Sunspot Number (EISN, red curve with shaded error) derived by a simplified method from real-time data from the worldwide SILSO network. It extends the official Sunspot Number from the full processing of the preceding month (green line), a few days more than one solar rotation. The horizontal blue line shows the current monthly average. The yellow dots give the number of stations that provided valid data. Valid data are used to calculate the EISN. The triangle gives the number of stations providing data. When a triangle and a yellow dot coincide, it means that all the data is used to calculate the EISN of that day.
PROBA2 Observations (21 Jul 2025 - 27 Jul 2025)
Solar Activity
Solar flare activity was at a low level during the week, with no recorded M-class flares.
In order to view the activity of this week in more detail, we suggest to go to the following website from which all the daily (normal and difference) movies can be accessed: https://proba2.oma.be/ssa
This page also lists the recorded flaring events.
A weekly overview movie can be found here (SWAP week 800). https://proba2.sidc.be/swap/data/mpg/movies/weekly_movies/weekly_movie_2025_07_21.mp4
Details about some of this week's events can be found further below.
If any of the linked movies are unavailable they can be found in the P2SC movie repository here https://proba2.sidc.be/swap/data/mpg/movies/
Thursday July 24
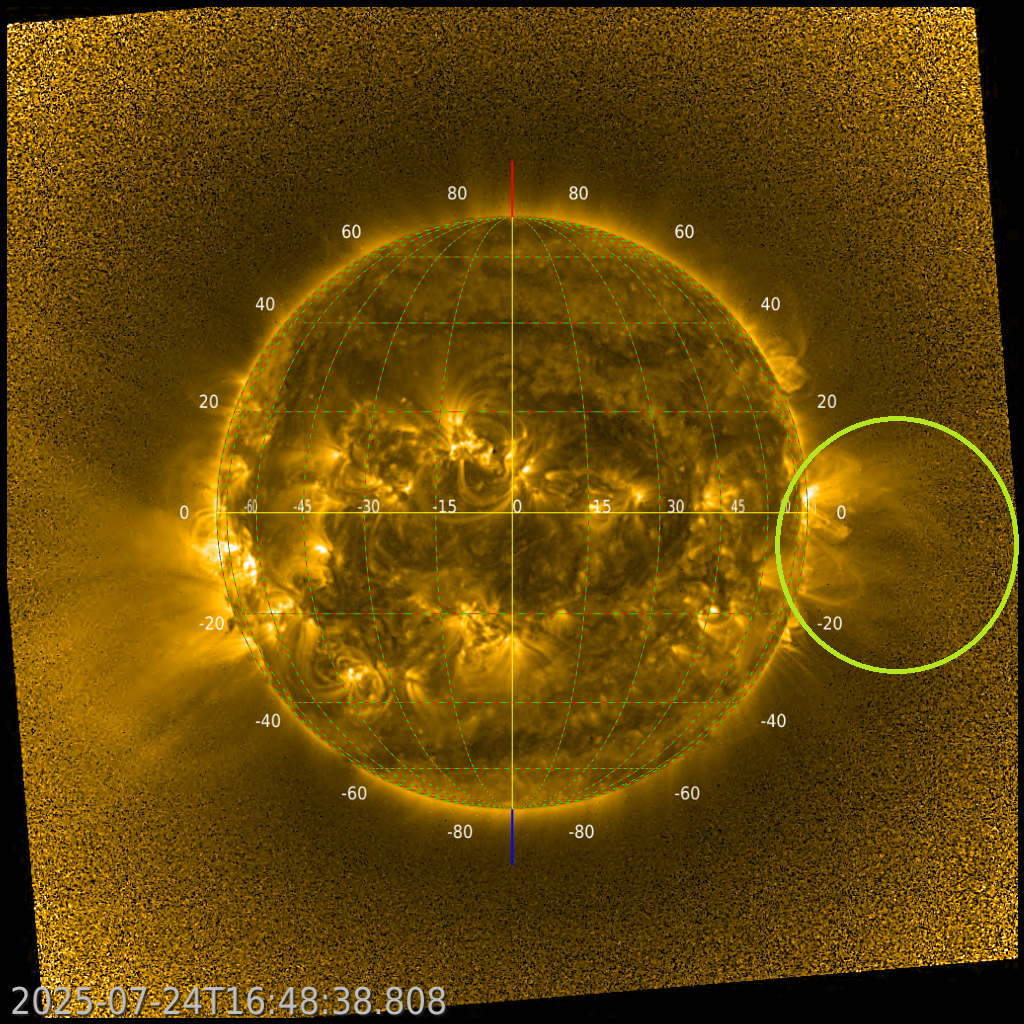
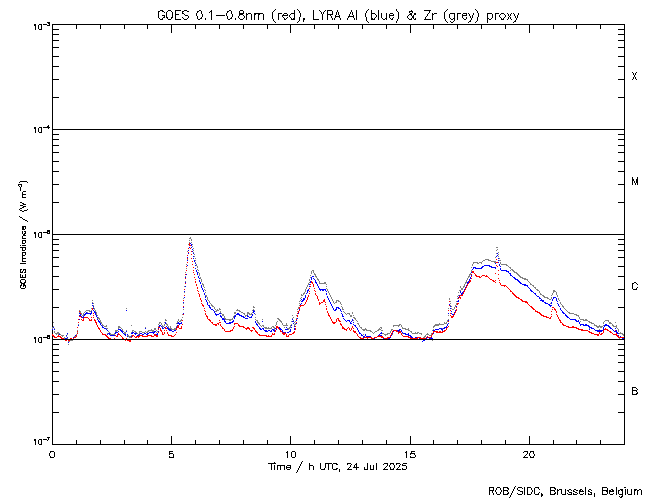
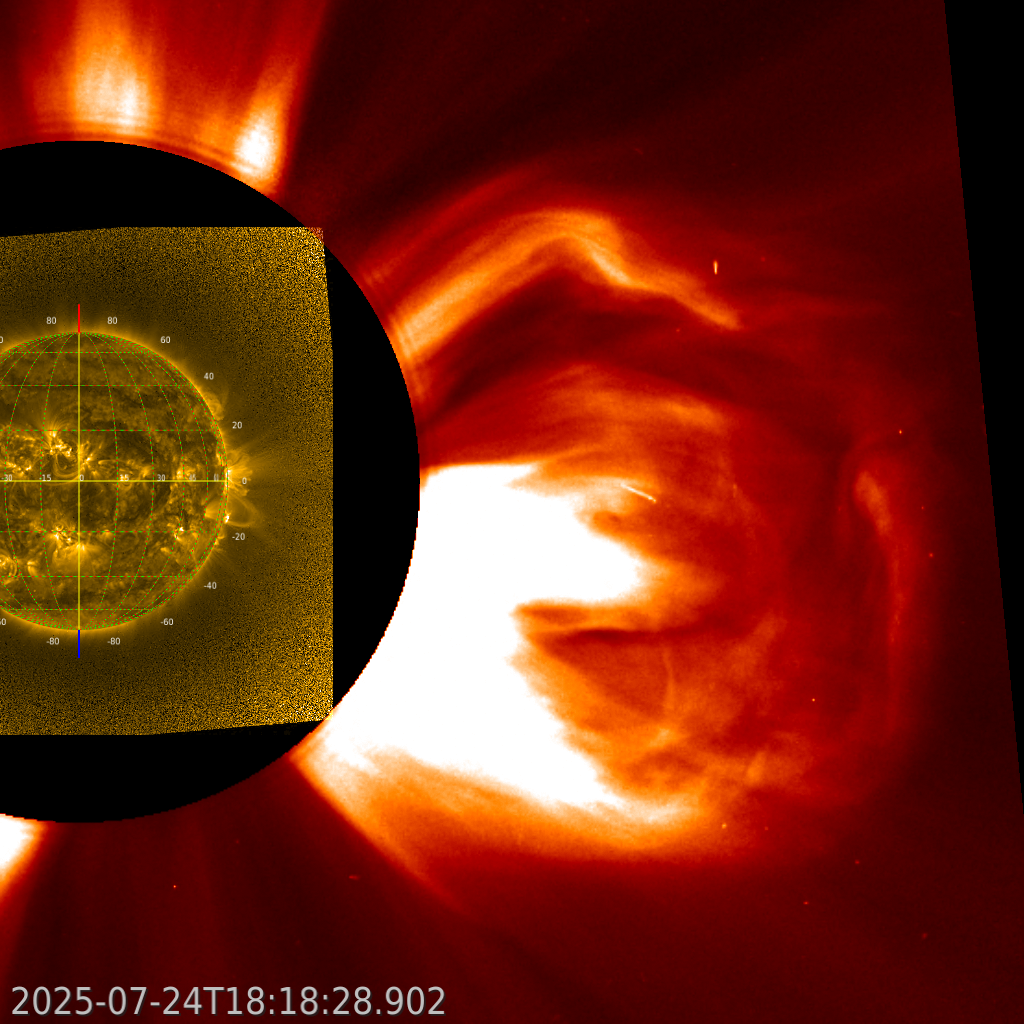
On Thursday, 2025-July-24, at ~17:00 UT there was a prominence eruption which was observed
by SWAP at the western limb of the Sun (top figure), and was associated with a C5.7 class flare
peaking at 18:39 UT seen also by LYRA (middle figure). The eruption was later correlated with a
coronal mass ejection captured by LASCO-C2 coronagraph onboard SOHO spacecraft (bottom
figure). Find a SWAP movie of the event here. https://proba2.sidc.be/swap/movies/20250724_swap_movie.mp4
Geomagnetic Observations in Belgium

Local K-type magnetic activity index for Belgium based on data from Dourbes (DOU) and Manhay (MAB). Comparing the data from both measurement stations allows to reliably remove outliers from the magnetic data. At the same time the operational service availability is improved: whenever data from one observatory is not available, the single-station index obtained from the other can be used as a fallback system.
Both the two-station index and the single station indices are available here: http://ionosphere.meteo.be/geomagnetism/K_BEL/
The SIDC Space Weather Briefing
The forecaster on duty presented the SIDC SWx briefing that gives an overview of space weather from July 21 to 27.
The pdf of the presentation can be found here: https://www.stce.be/briefings/20250728_SWbriefing.pdf
Review of Ionospheric Activity


VTEC time series at 3 locations in Europe from 21 Jul 2025 till 27 Jul 2025
The top figure shows the time evolution of the Vertical Total Electron Content (VTEC) (in red) during the last week at three locations:
a) in the northern part of Europe(N 61deg E 5deg)
b) above Brussels(N 50.5deg, E 4.5 deg)
c) in the southern part of Europe(N 36 deg, E 5deg)
This top figure also shows (in grey) the normal ionospheric behaviour expected based on the median VTEC from the 15 previous days.
The time series below shows the VTEC difference (in green) and relative difference (in blue) with respect to the median of the last 15 days in the North, Mid (above Brussels) and South of Europe. It thus illustrates the VTEC deviation from normal quiet behaviour.
The VTEC is expressed in TECu (with TECu=10^16 electrons per square meter) and is directly related to the signal propagation delay due to the ionosphere (in figure: delay on GPS L1 frequency).
The Sun's radiation ionizes the Earth's upper atmosphere, the ionosphere, located from about 60km to 1000km above the Earth's surface.The ionization process in the ionosphere produces ions and free electrons. These electrons perturb the propagation of the GNSS (Global Navigation Satellite System) signals by inducing a so-called ionospheric delay.
See http://stce.be/newsletter/GNSS_final.pdf for some more explanations; for more information, see https://gnss.be/SpaceWeather
STCE courses and presentations
Courses, seminars, presentations and events with the Sun-Space-Earth system and Space Weather as the main theme. We provide occasions to get submerged in our world through educational, informative and instructive activities.
* Aug 25, Guest lecture: De Zon, Zomerschool Sterrenkunde, Vereniging voor Sterrenkunde, Leuven, Belgium
* Sep 1, STCE seminar: High resolution solar telescopes: the Dutch Open Telescope and beyond, Space Pole Uccle
* Sep 8-10, STCE course: Role of the ionosphere and space weather in military communications, Brussels, Belgium - register: https://events.spacepole.be/event/226/
* Sep 20, Public Lecture: België op weg naar de zon met Proba-3, UGhent Volkssterrenwacht Armand Pien, Gent, Belgium
* Oct 23-25, ESWW Space Weather Training by Umea University and STCE, Kiruna, Sweden - Full
* Oct 27-31, European Space Weather Week, Umea, Sweden - https://esww.eu/
* Nov 17-19, STCE Space Weather Introductory Course, Brussels, Belgium - register: https://events.spacepole.be/event/217/
To register for a course and check the seminar details, navigate to the STCE Space Weather Education Center: https://www.stce.be/SWEC
If you want your event in the STCE newsletter, contact us: stce_coordination at stce.be

Website: https://www.stce.be/SWEC