- Table of Content
- 1.Word Search
- 2.Review of Sola...
- 3.Noticeable Sol...
- 4.International ...
- 5.PROBA2 Observa...
- 6.Geomagnetic Ob...
- 7.The SIDC Space...
- 8.Review of Iono...
- 9.STCE courses a...
2. Review of Solar and Geomagnetic Activity
3. Noticeable Solar Events
4. International Sunspot Number by SILSO
5. PROBA2 Observations (28 Jul 2025 - 3 Aug 2025)
6. Geomagnetic Observations in Belgium
7. The SIDC Space Weather Briefing
8. Review of Ionospheric Activity
9. STCE courses and presentations
Word Search
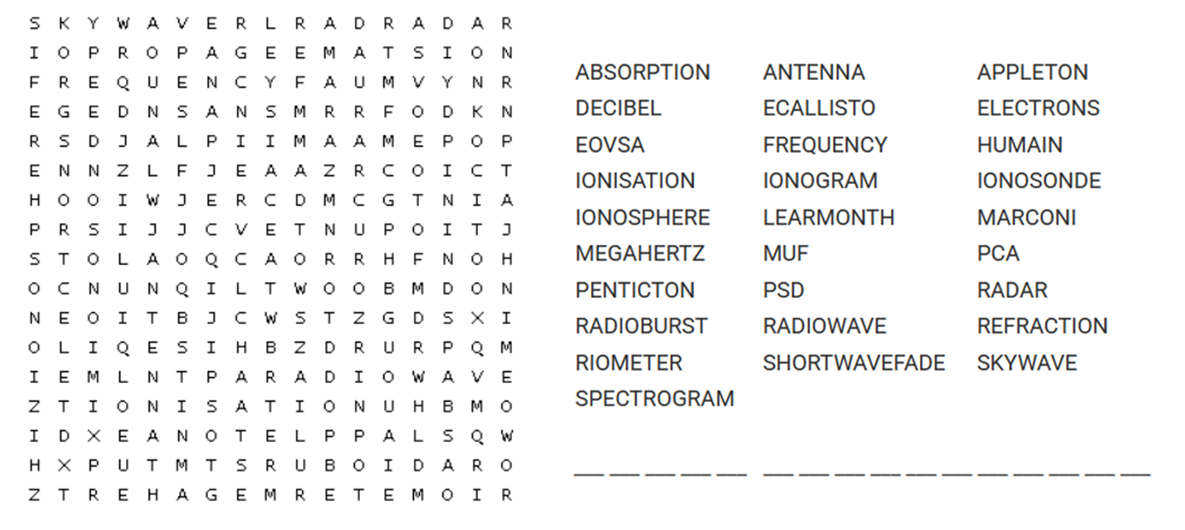
This puzzle is a word search puzzle that has a hidden message in it. The theme is "Radio communication in space weather". First find all the words in the list. Words can go in any direction and share letters as well as cross over each other. Once you have found all the words, copy the unused letters starting in the top left corner into the blanks to reveal the hidden message (2 words, 16 letters). This puzzle was created with the Discovery Education online tool at https://puzzlemaker.discoveryeducation.com/
Review of Solar and Geomagnetic Activity
WEEK 1283 from 2025 Jul 28
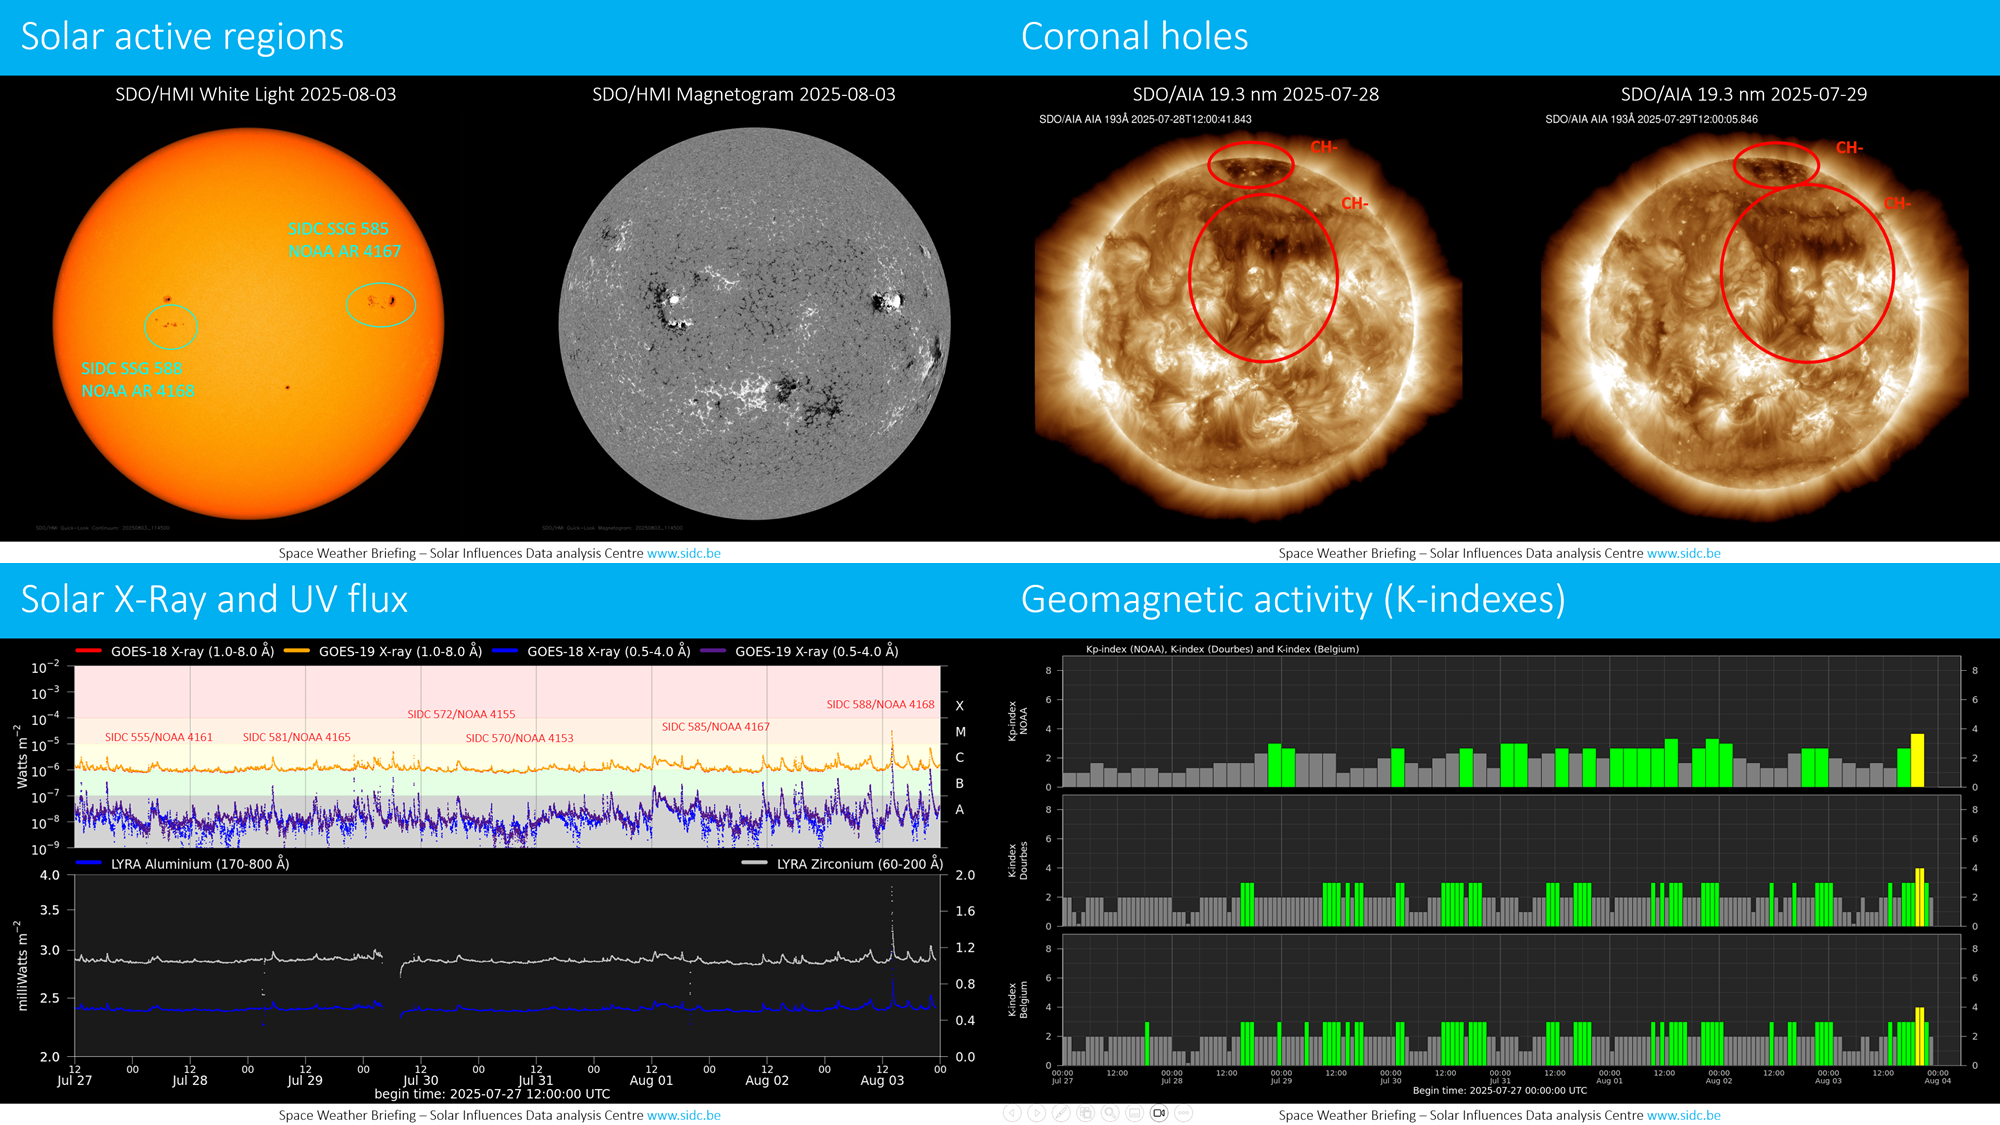
Solar active regions and flares
The solar flaring activity was at low levels with background C-class flaring for most of the week. The solar activity increased to moderate levels in the UTC afternoon of August 03. A total of 24 active regions were numbered on the visible solar disk throughout the week, most of them being magnetically simple and inactive. The strongest activity was an M2.9 flare (SIDC Flare 5021) with peak time at 13:57 UTC on August 03. The flare was produced by SIDC Sunspot Group 588 (NOAA Active Region 4168), which emerged on the visible disk on August 02 and quickly increased its complexity, developing a beta-gamma-delta magnetic configuration. Another notable active region was SIDC Sunspot Group 585 (NOAA Active Region 4167), which emerged on July 30 and also evolved into magnetic type beta-gamma-delta towards the end of the week. Despite its complexity the region has produced only C-class flaring.
Coronal mass ejections
No Earth-directed coronal mass ejections (CMEs) were observed throughout the entire week.
Coronal holes
Several negative-polarity coronal holes (SIDC Coronal Holes 120 - 122) were residing near or have crossed the central meridian over the past week. Mild high-speed stream arrivals related to two of them were expected and observed at Earth during the week. A positive-polarity coronal hole (SIDC Coronal Hole 123) started to rotate on disk on August 02 and is expected to cross the central meridian this week.
Proton flux levels
The greater than 10 MeV GOES proton flux was at nominal levels throughout the entire week.
Electron fluxes at GEO
The greater than 2 MeV electron flux as measured by GOES 18 and GOES 19 exceeded the 1000 pfu threshold on multiple days. The corresponding 24-hour electron fluence remained at nominal levels throughout the week.
Solar wind
The solar wind conditions as measured by ACE spacecraft throughout the week reflected two mild high-speed stream arrivals, namely on July 30 and late UTC on August 03. The magnitude of the interplanetary magnetic field (IMF) reached a maximum value of 12.8 nT, with a minimum Bz of -9.7 nT. The phi angle of the IMF was predominantly in the negative sector (directed towards the Sun) reflecting the polarity of the geo-effective coronal holes (SIDC Coronal Holes 121 and 122). The solar wind speed remained below 600 km/s throughout the entire week.
Geomagnetism
The geomagnetic conditions throughout the week were mostly quiet to unsettled. An isolated active period was reached between 18-21 UTC on August 03 related to the second high-speed stream arrival.
Noticeable Solar Events
| DAY | BEGIN | MAX | END | LOC | XRAY | OP | 10CM | TYPE | Cat | NOAA |
| 03 | 1350 | 1357 | 1401 | M2.9 | 71 | 4168 |
| LOC: approximate heliographic location | TYPE: radio burst type |
| XRAY: X-ray flare class | Cat: Catania sunspot group number |
| OP: optical flare class | NOAA: NOAA active region number |
| 10CM: peak 10 cm radio flux |
International Sunspot Number by SILSO
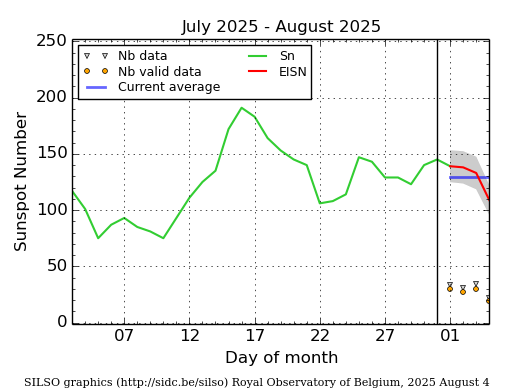
The daily Estimated International Sunspot Number (EISN, red curve with shaded error) derived by a simplified method from real-time data from the worldwide SILSO network. It extends the official Sunspot Number from the full processing of the preceding month (green line), a few days more than one solar rotation. The horizontal blue line shows the current monthly average. The yellow dots give the number of stations that provided valid data. Valid data are used to calculate the EISN. The triangle gives the number of stations providing data. When a triangle and a yellow dot coincide, it means that all the data is used to calculate the EISN of that day.
PROBA2 Observations (28 Jul 2025 - 3 Aug 2025)
Solar Activity
Solar flare activity fluctuated from low to moderate during the week.
In order to view the activity of this week in more detail, we suggest to go to the following website from which all the daily (normal and difference) movies can be accessed: https://proba2.oma.be/ssa
This page also lists the recorded flaring events.
A weekly overview movie can be found here (SWAP week 801). https://proba2.sidc.be/swap/data/mpg/movies/weekly_movies/weekly_movie_2025_07_28.mp4
Details about some of this week's events can be found further below.
If any of the linked movies are unavailable they can be found in the P2SC movie repository here https://proba2.sidc.be/swap/data/mpg/movies/
Sunday Aug 03
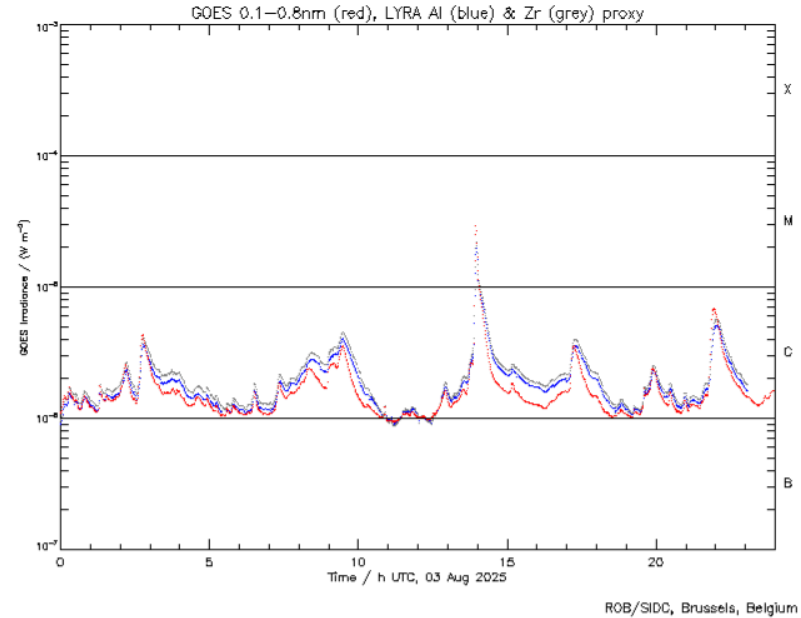
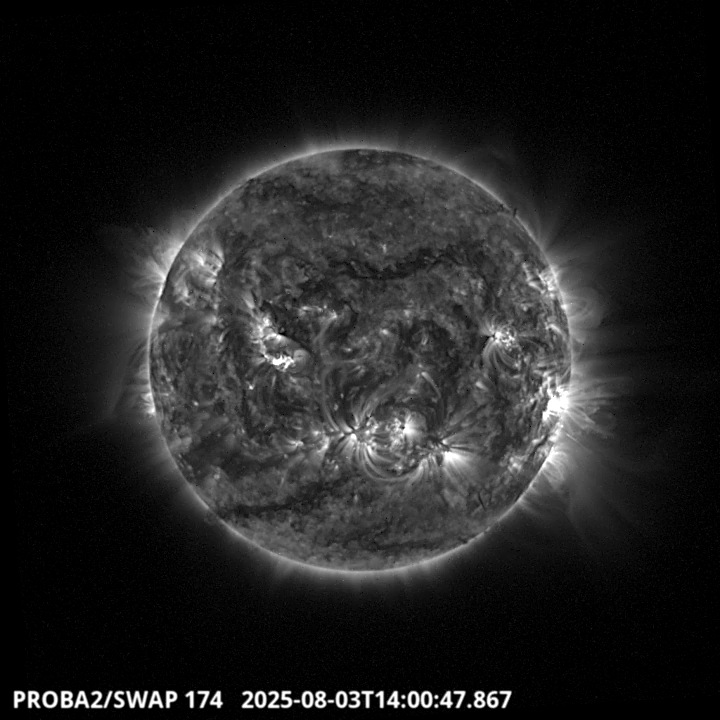
The strongest flare of the week was a M2.9 flare with peak time 13:57 UT. It was produced by the
NOAA active region 4168 located on the North-East part of the solar disk. It has been recorded
by both instruments LYRA (top) and SWAP (bottom). Find a SWAP movie of the event here. https://proba2.sidc.be/swap/movies/20250803_swap_movie.mp4
Geomagnetic Observations in Belgium
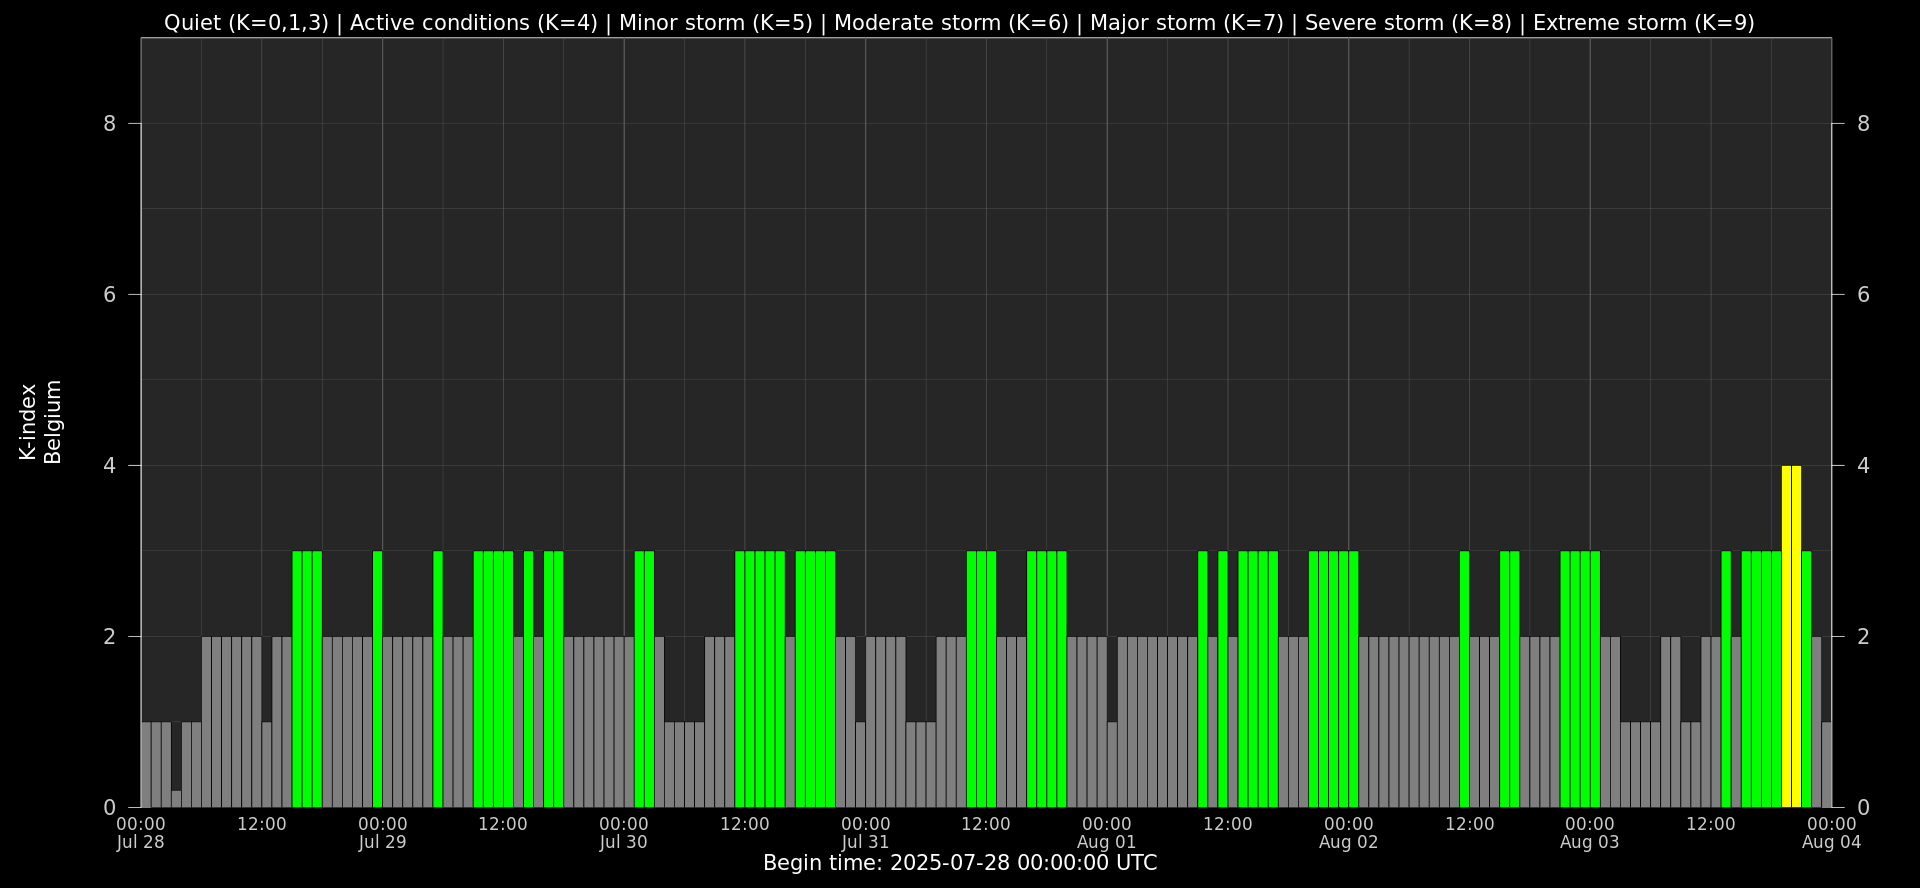
Local K-type magnetic activity index for Belgium based on data from Dourbes (DOU) and Manhay (MAB). Comparing the data from both measurement stations allows to reliably remove outliers from the magnetic data. At the same time the operational service availability is improved: whenever data from one observatory is not available, the single-station index obtained from the other can be used as a fallback system.
Both the two-station index and the single station indices are available here: http://ionosphere.meteo.be/geomagnetism/K_BEL/
The SIDC Space Weather Briefing
The forecaster on duty presented the SIDC SWx briefing that gives an overview of space weather activity from July 28 to August 03.
The pdf of the presentation can be found here: https://www.stce.be/briefings/20250804_SWbriefing.pdf
Review of Ionospheric Activity


VTEC time series at 3 locations in Europe from 28 Jul 2025 till 3 Aug 2025
The top figure shows the time evolution of the Vertical Total Electron Content (VTEC) (in red) during the last week at three locations:
a) in the northern part of Europe(N 61deg E 5deg)
b) above Brussels(N 50.5deg, E 4.5 deg)
c) in the southern part of Europe(N 36 deg, E 5deg)
This top figure also shows (in grey) the normal ionospheric behaviour expected based on the median VTEC from the 15 previous days.
The time series below shows the VTEC difference (in green) and relative difference (in blue) with respect to the median of the last 15 days in the North, Mid (above Brussels) and South of Europe. It thus illustrates the VTEC deviation from normal quiet behaviour.
The VTEC is expressed in TECu (with TECu=10^16 electrons per square meter) and is directly related to the signal propagation delay due to the ionosphere (in figure: delay on GPS L1 frequency).
The Sun's radiation ionizes the Earth's upper atmosphere, the ionosphere, located from about 60km to 1000km above the Earth's surface.The ionization process in the ionosphere produces ions and free electrons. These electrons perturb the propagation of the GNSS (Global Navigation Satellite System) signals by inducing a so-called ionospheric delay.
See http://stce.be/newsletter/GNSS_final.pdf for some more explanations; for more information, see https://gnss.be/SpaceWeather
STCE courses and presentations
Courses, seminars, presentations and events with the Sun-Space-Earth system and Space Weather as the main theme. We provide occasions to get submerged in our world through educational, informative and instructive activities.
* Aug 25, Guest lecture: De Zon, Zomerschool Sterrenkunde, Vereniging voor Sterrenkunde, Leuven, Belgium
* Sep 1, STCE seminar: High resolution solar telescopes: the Dutch Open Telescope and beyond, Space Pole Uccle
* Sep 8-10, STCE course: Role of the ionosphere and space weather in military communications, Brussels, Belgium - register: https://events.spacepole.be/event/226/
* Sep 20, Public Lecture: België op weg naar de zon met Proba-3, UGhent Volkssterrenwacht Armand Pien, Gent, Belgium
* Oct 23-25, ESWW Space Weather Training by Umea University and STCE, Kiruna, Sweden - Full
* Oct 27-31, European Space Weather Week, Umea, Sweden - https://esww.eu/
* Nov 17-19, STCE Space Weather Introductory Course, Brussels, Belgium - register: https://events.spacepole.be/event/217/
To register for a course and check the seminar details, navigate to the STCE Space Weather Education Center: https://www.stce.be/SWEC
If you want your event in the STCE newsletter, contact us: stce_coordination at stce.be

Website: https://www.stce.be/SWEC