- Table of Content
- 1.The flary adve...
- 2.ESWW Early-bir...
- 3.Review of Sola...
- 4.International ...
- 5.Noticeable Sol...
- 6.Geomagnetic Ob...
- 7.Review of Iono...
- 8.The SIDC Space...
- 9.Upcoming STCE ...
2. ESWW Early-bird registration deadline coming up
3. Review of Solar and Geomagnetic Activity
4. International Sunspot Number by SILSO
5. Noticeable Solar Events
6. Geomagnetic Observations in Belgium
7. Review of Ionospheric Activity
8. The SIDC Space Weather Briefing
9. Upcoming STCE Activities
The flary adventures of NOAA 4168
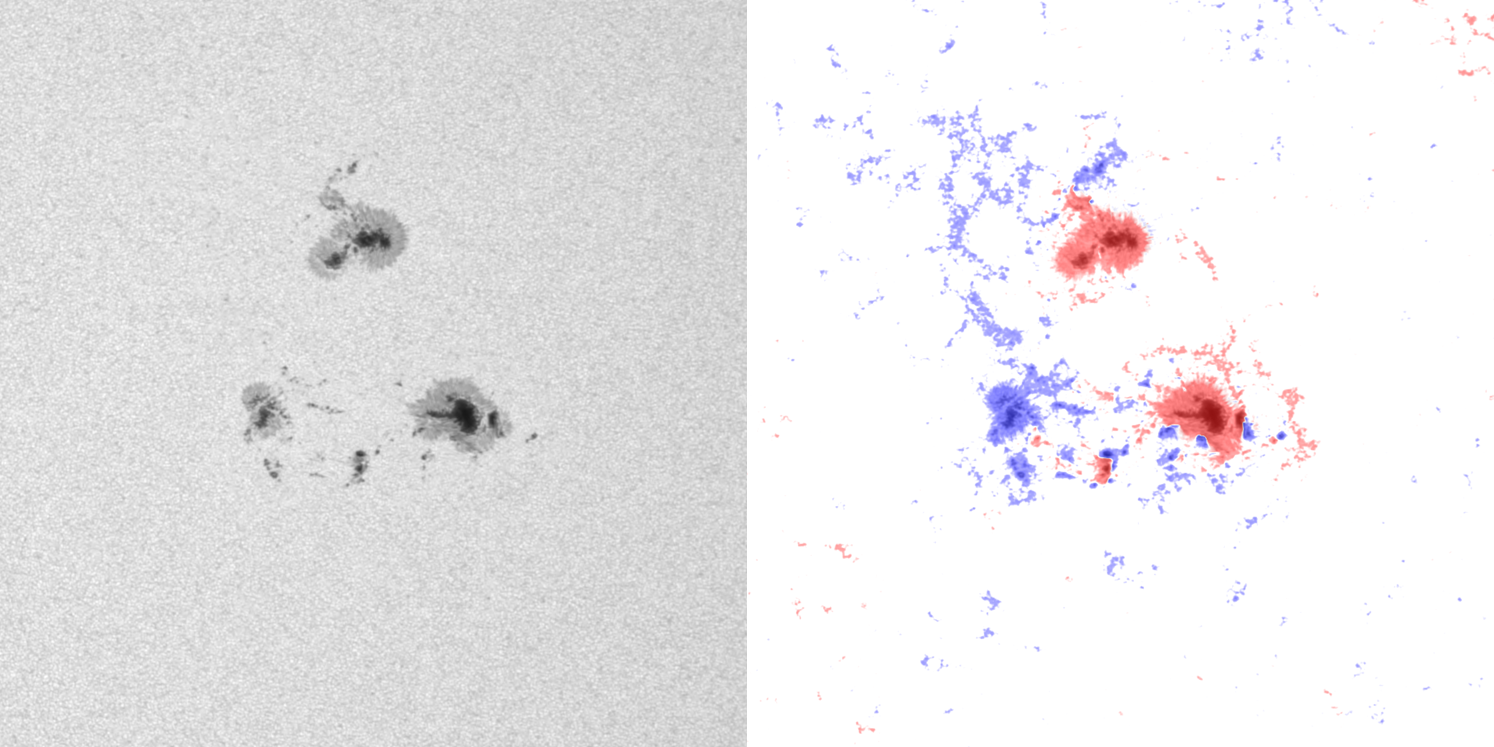
The last few weeks, a significant increase in the number of sunspot groups was observed. Ten to fifteen active regions on the solar disk at the same time were no exception. Though most of them were small, a few were relatively large and complex. NOAA 4168 (SIDC sunspot group 588 - https://www.sidc.be/index.php/services/event-chains/sunspots ) was such a well-sized mixed-up active region. It started to develop on 2 August, just south of decaying NOAA 4165 (SIDC sunspot group 581), reaching a maximum sunspot area of 350 MH (millionths of a solar hemisphere). That doesn't sound like much, but it is the equivalent of about twice the total surface area of the Earth. The SDO imagery underneath (http://sdo.gsfc.nasa.gov/data/aiahmi/ ) shows NOAA 4168 on 6 August (08:02UTC) in white light (left) and magnetically (right). In the magnetogram, a red color indicates a positive magnetic polarity (magnetic field lines leaving the solar surface), a blue color denotes a negative magnetic polarity (field lines returning to the solar surface). A clip showing the evolution from 2 till 10 August is available in the online version of this newsitem at https://www.stce.be/news/779/welcome.html
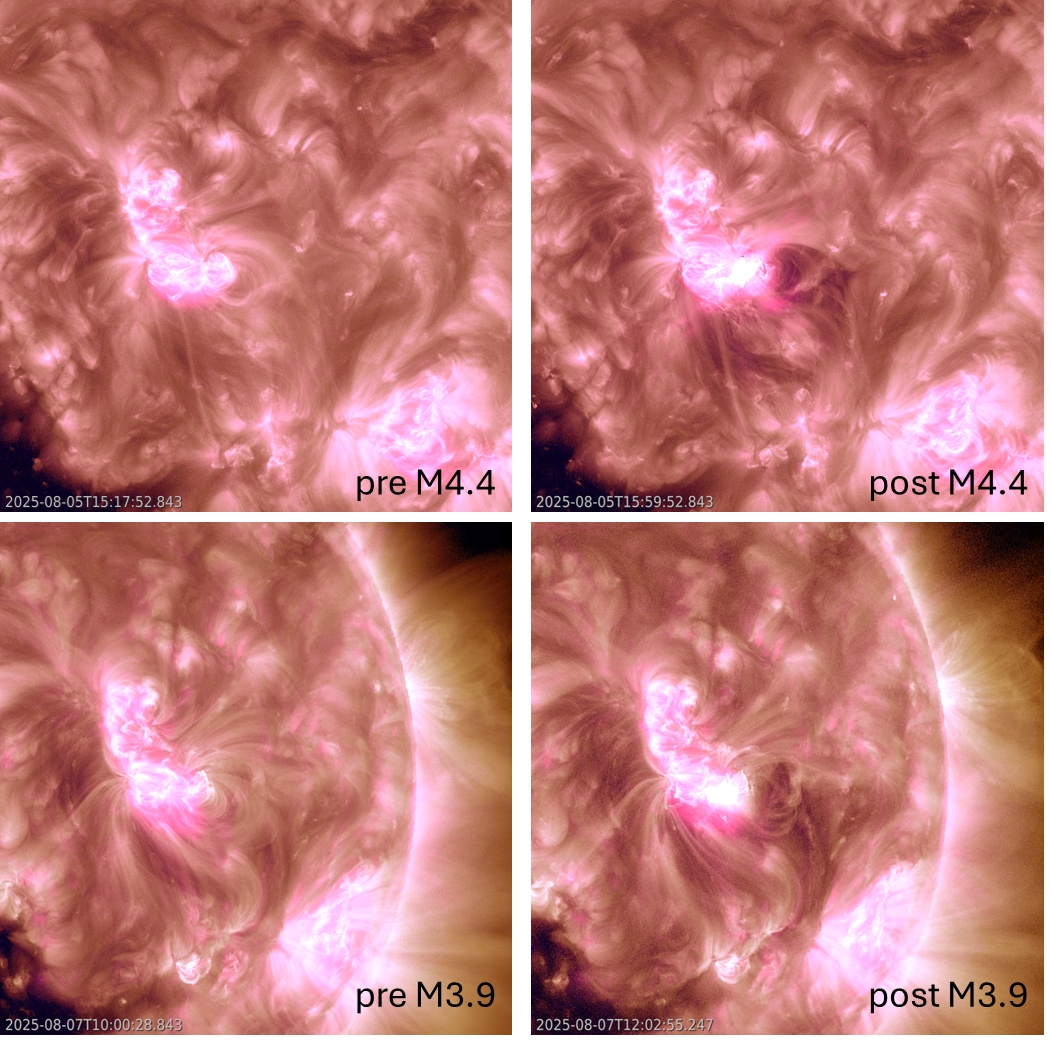
Due to its complex magnetic structure, NOAA 4168 quickly became a very flare-active region, producing 17 M-class ("medium") flares during its transit. The strongest two, an M4.4 flare on 5 August and a long-duration M3.9 event two days later, are shown underneath. The extreme ultraviolet (EUV) imagery (SDO) combines AIA 193 images (brownish; 1.25 million degrees) with AIA 094 (pink; multi-million degrees) and show well the post-flare coronal loops and especially the coronal dimming, indicating material was ejected. See also the online clips. The coronal mass ejection associated with the M4 flare may have affected the earth environment on 8 August, but its effect is difficult to disentangle from that from a high-speed stream that arrived around the same time.
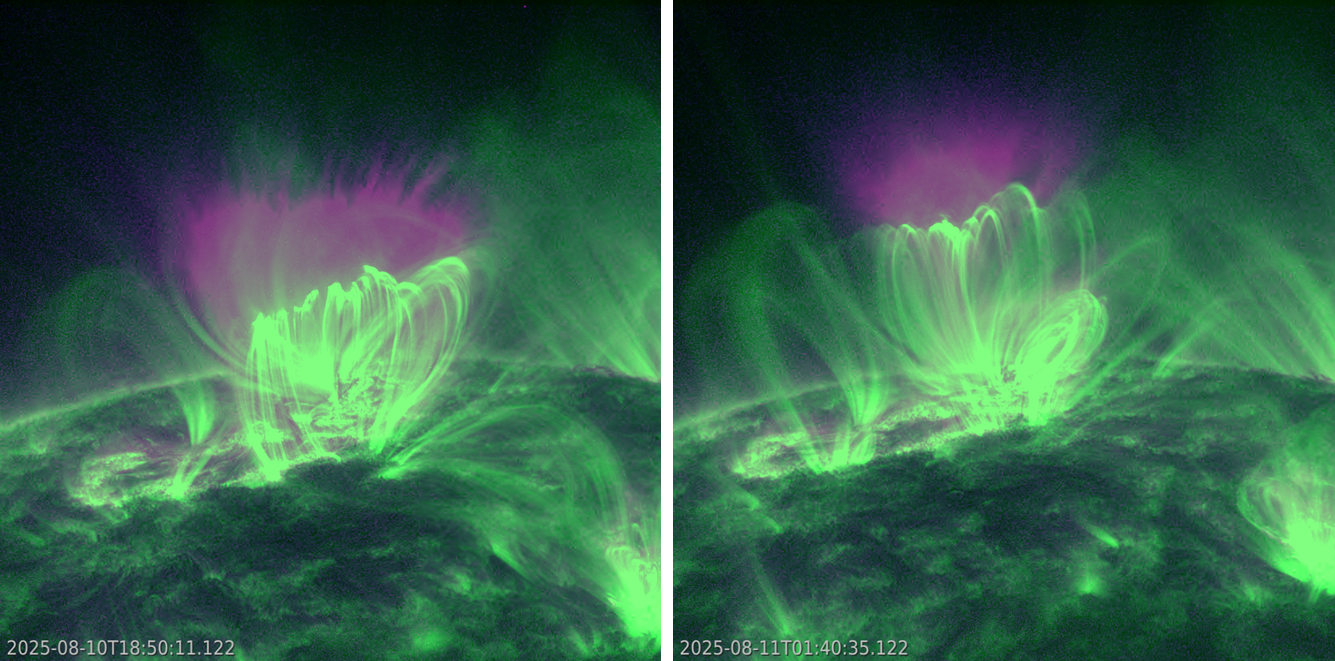
Probably the nicest M-class eruption from NOAA 4168 took place on 10 August. At that time, the active region was already close to the Sun's west limb, and so the eruption could be nicely seen in profile. The M2.2 flare peaked at 15:07UTC. The post-flare coronal loops reached a height of nearly 200.000 km, that's half the Earth-Moon distance. Also very nice supra-arcade downflows (SADs - see this STCE newsitem at https://www.stce.be/news/630/welcome.html for more info and examples) could be seen in filters showing the multi-million degree corona (the Sun's outer atmosphere). The coronal loops are best visible in AIA 171 (700.000 degrees; greenish), the SADs -the ragged, tadpole-like structures- in AIA 094 (pinkish-blue). In the still, the images are about 7 hours apart.
ESWW Early-bird registration deadline coming up
This year, the European Space Weather Week will take place in Umea, Sweden from October 27 to 31. Preparations for this conference; the main European forum for researchers from all over the globe to discuss space weather, its impacts and applications; are in full swing.
We are working hard to make this next edition of ESWW another memorable one. You won't want to miss it!
The early-bird registration is closing soon: deadline September 5.
If you have not yet submitted an abstract, you can still apply for a poster: deadline September 5.
Register now at https://esww.eu/ !

Review of Solar and Geomagnetic Activity
WEEK 1285 from 2025 Aug 11
Solar Active Regions (ARs) and Flares
Solar flaring activity ranged from moderate to low during the past week. Between August 10 and 12, several M-class flares were produced, the strongest being an M2.2 flare (SIDC Flare 5104) peaking at 15:07 UTC on August 10, originating from SIDC Sunspot Group 588 (NOAA AR 4168). Other notable flares included an M1.8 flare (SIDC Flare 5122) from SIDC Sunspot Group 581 (NOAA AR 4165) peaking at 01:23 UTC on August 12, and a series of M1.3-M1.7 flares from Sunspot Groups 588 and 592. After August 13, only C-class flaring was recorded, with the largest being a C7.7 flare (SIDC Flare 5156) from SIDC Sunspot Group 590 (NOAA AR 4172) peaking at 21:22 UTC on August 15. A maximum of thirteen numbered sunspot groups were visible during the week, decreasing to six by the end of the period. The most complex and productive regions were SIDC Sunspot Group 588 (NOAA AR 4168, Beta-Gamma-Delta), responsible for most of the early M-class flaring before rotating over the west limb, and SIDC Sunspot Group 590 (NOAA AR 4172, Beta-Gamma then Beta), which remained flare-productive throughout the week. SIDC Sunspot Group 596 (NOAA AR 4178, Beta-Gamma then Beta) also contributed.
Coronal mass ejections
Several CMEs were observed during the week, mostly associated with activity near the west limb and therefore not Earth-directed. A large CME was recorded on August 10 at 14:48 UTC with a speed of about 638 km/s, most likely linked to eruptive activity from SIDC Sunspot Group 592 (NOAA AR 4173). Additional CMEs on August 11-12 were linked to Sunspot Groups 588 and 592 after they rotated behind the west limb.
Coronal Holes
Several coronal holes transited the central meridian during the week. SIDC Coronal Hole 123 (elongated, southern, positive polarity) continued to cross the central meridian from August 6 onward and influenced solar wind conditions for much of the week. SIDC Coronal Hole 124 (small, northern, positive polarity) and SIDC Coronal Hole 125 (small, equatorial) contributed to enhanced streams during August 11-12. SIDC Coronal Hole 116 (mid-latitude, negative polarity) returned on August 12 and transited the central meridian on August 15. Finally, SIDC Coronal Hole 104 (polar-south, positive polarity) also reached the central meridian on August 14.
Proton flux levels
The >10 MeV proton flux remained below the 10 pfu threshold throughout the week. Slight enhancements were considered possible due to the number of active regions, but no significant events were recorded.
Electron fluxes at GEO
The >2 MeV electron flux, measured by GOES 18 and 19, remained elevated and frequently exceeded the 1000 pfu threshold, particularly in response to the persistent high-speed streams from coronal holes. The 24-hour electron fluence was at moderate levels during most of the week.
Solar wind
Solar wind conditions were enhanced early in the week due to high-speed streams associated to the SIDC Coronal Holes 123 and 125. Wind speeds reached up to 634 km/s on August 12. The total interplanetary magnetic field (Bt) peaked around 8.5 nT, with the southward interplanetary magnetic field component (Bz) fluctuating between -6 and +7 nT. From August 14-15, the solar wind gradually weakened toward a slow regime, with speeds between 340 and 500 km/s and the total interplanetary magnetic field (Bt) around 5-6 nT. By August 16-17, solar wind remained slow (around 307-400 km/s), but high-speed streams from SIDC Coronal Hole 116 were forecast to arrive in the following week due to its location (mid-latitude) and its transition of the central meridian on August 15.
Geomagnetism
Geomagnetic activity was mostly unsettled to active at the beginning of the week, with NOAA Kp indices up to 4 and local Belgian K-index reaching 4. This was due to sustained high-speed stream influence combined with long periods of negative southward interplanetary magnetic field component (Bz). From August 13-15, conditions eased to quiet to unsettled, with occasional active intervals linked to residual streams. By August 16-17, geomagnetic activity was quiet, with NOAA Kp between 1-2 and Belgian K-index between 1-3.
International Sunspot Number by SILSO

The daily Estimated International Sunspot Number (EISN, red curve with shaded error) derived by a simplified method from real-time data from the worldwide SILSO network. It extends the official Sunspot Number from the full processing of the preceding month (green line), a few days more than one solar rotation. The horizontal blue line shows the current monthly average. The yellow dots give the number of stations that provided valid data. Valid data are used to calculate the EISN. The triangle gives the number of stations providing data. When a triangle and a yellow dot coincide, it means that all the data is used to calculate the EISN of that day.
Noticeable Solar Events
| DAY | BEGIN | MAX | END | LOC | XRAY | OP | 10CM | TYPE | Cat | NOAA |
| 11 | 0342 | 0352 | 0359 | M1.3 | 78 | 4173 | ||||
| 11 | 1420 | 1435 | 1457 | N2W86 | M1.5 | SF | 75 | 4168 | ||
| 11 | 1518 | 1536 | 1551 | M1.6 | 75 | 4168 | ||||
| 12 | 0042 | 0059 | 0118 | M1.5 | III/2 | |||||
| 12 | 0118 | 0123 | 0127 | M1.8 | III/2 |
| LOC: approximate heliographic location | TYPE: radio burst type |
| XRAY: X-ray flare class | Cat: Catania sunspot group number |
| OP: optical flare class | NOAA: NOAA active region number |
| 10CM: peak 10 cm radio flux |
Geomagnetic Observations in Belgium

Local K-type magnetic activity index for Belgium based on data from Dourbes (DOU) and Manhay (MAB). Comparing the data from both measurement stations allows to reliably remove outliers from the magnetic data. At the same time the operational service availability is improved: whenever data from one observatory is not available, the single-station index obtained from the other can be used as a fallback system.
Both the two-station index and the single station indices are available here: http://ionosphere.meteo.be/geomagnetism/K_BEL/
Review of Ionospheric Activity


VTEC time series at 3 locations in Europe from 11 Aug 2025 till 17 Aug 2025
The top figure shows the time evolution of the Vertical Total Electron Content (VTEC) (in red) during the last week at three locations:
a) in the northern part of Europe(N 61deg E 5deg)
b) above Brussels(N 50.5deg, E 4.5 deg)
c) in the southern part of Europe(N 36 deg, E 5deg)
This top figure also shows (in grey) the normal ionospheric behaviour expected based on the median VTEC from the 15 previous days.
The time series below shows the VTEC difference (in green) and relative difference (in blue) with respect to the median of the last 15 days in the North, Mid (above Brussels) and South of Europe. It thus illustrates the VTEC deviation from normal quiet behaviour.
The VTEC is expressed in TECu (with TECu=10^16 electrons per square meter) and is directly related to the signal propagation delay due to the ionosphere (in figure: delay on GPS L1 frequency).
The Sun's radiation ionizes the Earth's upper atmosphere, the ionosphere, located from about 60km to 1000km above the Earth's surface.The ionization process in the ionosphere produces ions and free electrons. These electrons perturb the propagation of the GNSS (Global Navigation Satellite System) signals by inducing a so-called ionospheric delay.
See http://stce.be/newsletter/GNSS_final.pdf for some more explanations; for more information, see https://gnss.be/SpaceWeather
The SIDC Space Weather Briefing
The forecaster on duty presented the SIDC briefing that gives an overview of space weather from August 11 to 17.
The pdf of the presentation can be found here: https://www.stce.be/briefings/20250818_SWbriefing.pdf
Upcoming STCE Activities
Courses, seminars, presentations and events with the Sun-Space-Earth system and Space Weather as the main theme. We provide occasions to get submerged in our world through educational, informative and instructive activities.
* Aug 25, Guest lecture: De Zon, Zomerschool Sterrenkunde, Vereniging voor Sterrenkunde, Leuven, Belgium
* Aug 26, STCE Seminar: Accelerated Solar Tomography: Balancing Accuracy and Observation Cadence, Space Pole Uccle
* Sep 1, STCE seminar: High resolution solar telescopes: the Dutch Open Telescope and beyond, Space Pole Uccle
* Sep 8-10, STCE course: Role of the ionosphere and space weather in military communications, Brussels, Belgium - register: https://events.spacepole.be/event/226/
* Sep 20, Public Lecture: België op weg naar de zon met Proba-3, UGhent Volkssterrenwacht Armand Pien, Gent, Belgium
* Oct 23-25, ESWW Space Weather Training by Umea University and STCE, Kiruna, Sweden - Full
* Oct 27-31, European Space Weather Week, Umea, Sweden - https://esww.eu/
* Nov 17-19, STCE Space Weather Introductory Course, Brussels, Belgium - register: https://events.spacepole.be/event/217/
To register for a course and check the seminar details, navigate to the STCE Space Weather Education Center: https://www.stce.be/SWEC
If you want your event in the STCE newsletter, contact us: stce_coordination at stce.be
Website: https://www.stce.be/SWEC