- Table of Content
- 1.The Sun's catw...
- 2.What is a CoSE...
- 3.Review of Sola...
- 4.International ...
- 5.PROBA2 Observa...
- 6.Noticeable Sol...
- 7.Geomagnetic Ob...
- 8.Review of Iono...
- 9.The SIDC Space...
- 10.Upcoming Activ...
2. What is a CoSEE-Cat?
3. Review of Solar and Geomagnetic Activity
4. International Sunspot Number by SILSO
5. PROBA2 Observations
6. Noticeable Solar Events
7. Geomagnetic Observations in Belgium
8. Review of Ionospheric Activity
9. The SIDC Space Weather Briefing
10. Upcoming Activities
The Sun's catwalk
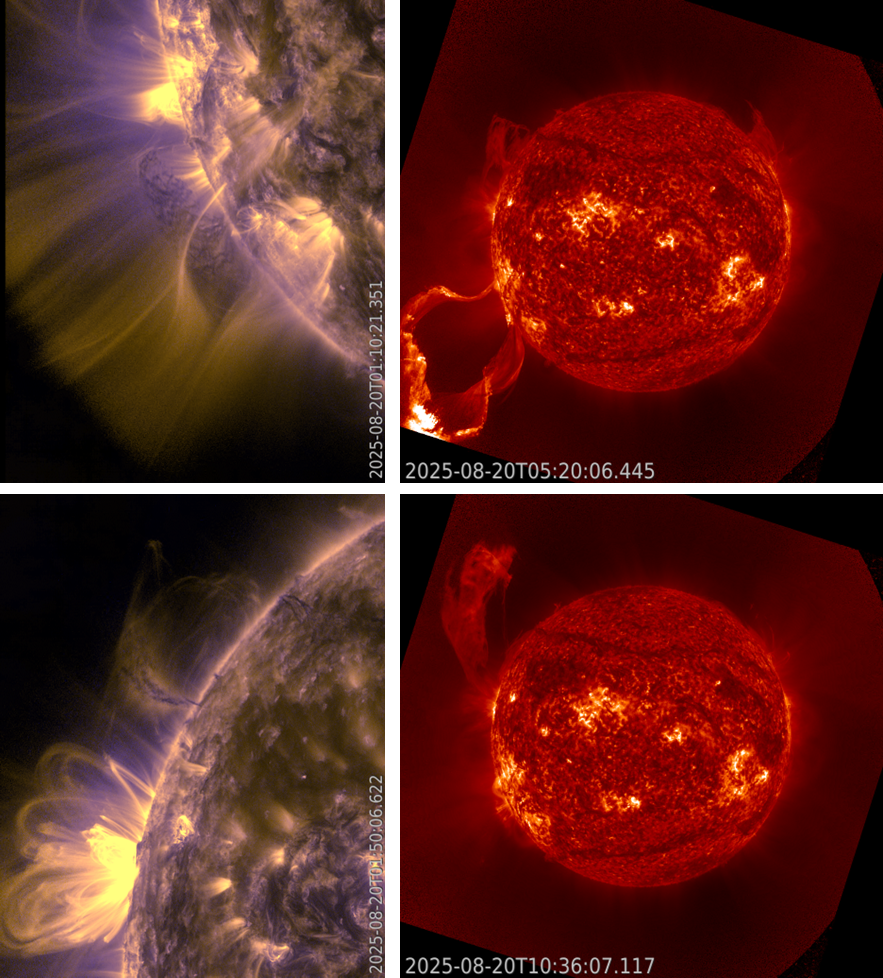
Let's start with the appetizer. From 16 August onwards, some large prominences were towering over the Sun's east limb. Solar prominences are clouds of charged particles ("plasma") above the solar surface squeezed between magnetic regions of opposite polarity. Being cooler and denser than the plasma underneath and their surroundings, they appear as bright blobs when seen near the solar limb and as dark lines when seen on the solar disk (then they are called "filaments"). Special filters are required to observe these features, and one such a filter is the Hydrogen-alpha line in the red part of the solar spectrum (H-alpha; 656.3 nm). However, prominences can also be observed in extreme ultraviolet (EUV). At higher temperatures of around 80.000 degrees (GOES/SUVI 304), prominences show up as fat bright structures near the solar limb. At even higher temperatures (SDO/AIA 171: 700,000 degrees; AIA 131: multi-million degrees), these "cold" features can also be seen but then as dark structures carved out against the brighter background of the much hotter (million degrees) plasma. The images underneath show the eruption of both prominences on 20 August, on the right by SUVI 304, and on the left a zoomed-in combo of AIA 171 (yellow) and AIA 131 (blue) of the pre-eruptive state. Clips are available in the online version of this newsitem at https://www.stce.be/news/780/welcome.html Prior to the eruptions, the tallest structure was the one at the northeast limb reaching a height near 160,000 km. A nice clip of this prominence in H-alpha, just before its eruption, was made by Yoshinori Watabe and can be found on YouTube (https://www.youtube.com/watch?v=OrOddRLhuSA ). The associated coronal mass ejections (CMEs) were not directed to Earth.
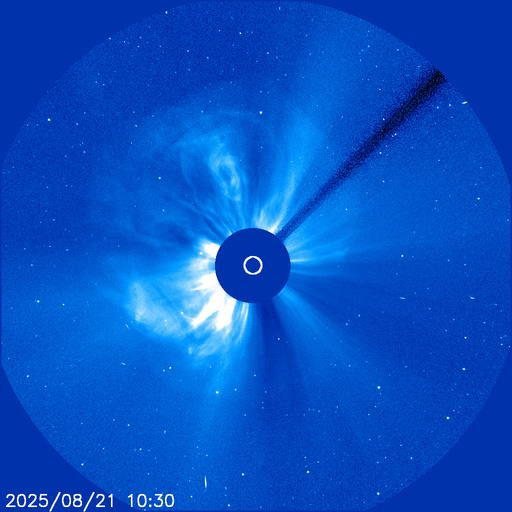
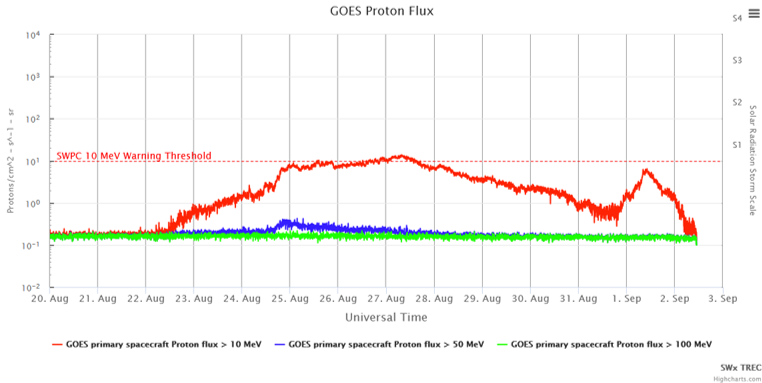
Then, basically out of nowhere, a powerful full halo CME appeared on 21 August. It first appeared at 08:24 UTC in SOHO/LASCO coronagraphic imagery (see imagery underneath), with speeds between 1200 and 1600 km/s pending the imagery and methodology used. With no important active regions on the earth-facing solar disk, this had to be a farside CME. Interestingly, the greater than 10 MeV proton flux gradually started to increase from around noon on 22 August (see GOES plot underneath). Eventually, the 10 pfu (proton flux units) alert threshold was reached about 5 (five!) days later. A minor proton event was in progress from 26 August at 20:30UTC until 27 August at 14:15 UTC. The flux reached a maximum of only 13 pfu, still a formidable achievement for a farside eruption. A strong farside eruption creating a small proton event near Earth is not so exceptional, with this newsitem at https://www.stce.be/news/716/welcome.html discussing a quite similar case.
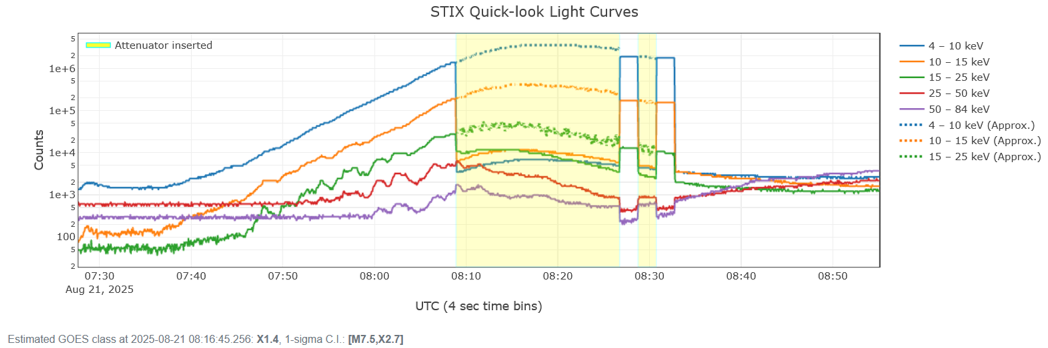
Solar Orbiter, located almost directly opposite of the Earth (so also on the Sun's farside), had a clear view of the eruption. Its STIX instrument (see this newsitem at https://www.stce.be/news/712/welcome.html for a brief description) recorded a strong eruption peaking at 08:16 UTC, with an estimated GOES soft x-ray intensity between M5.7 and X2.7, the most likely value being X1.4 - so an X-class event (see the graph underneath). The annotated EUV images underneath were obtained by Solar Orbiter's FSI instrument (Full Sun Imager) and show the Sun (farside as seen from Earth...) at 00:00UTC and at 12:00UTC on 21 August, basically before and after the eruption. The image from 12:00UTC clearly shows an arcade (a series of post-eruption coronal loops) in the encircled area, a telltale sign a strong eruption had taken place there.
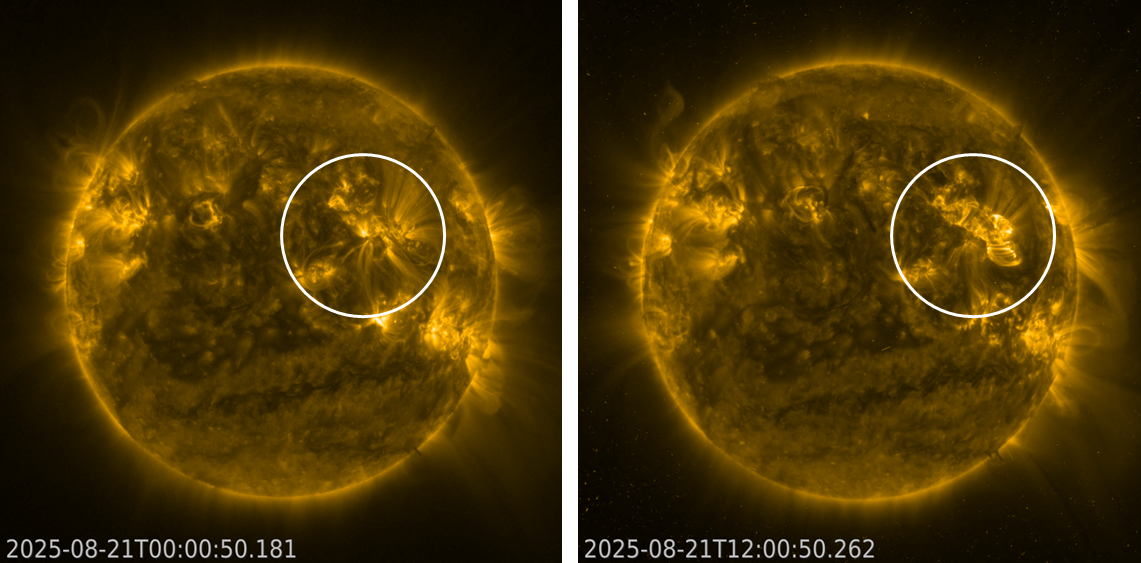
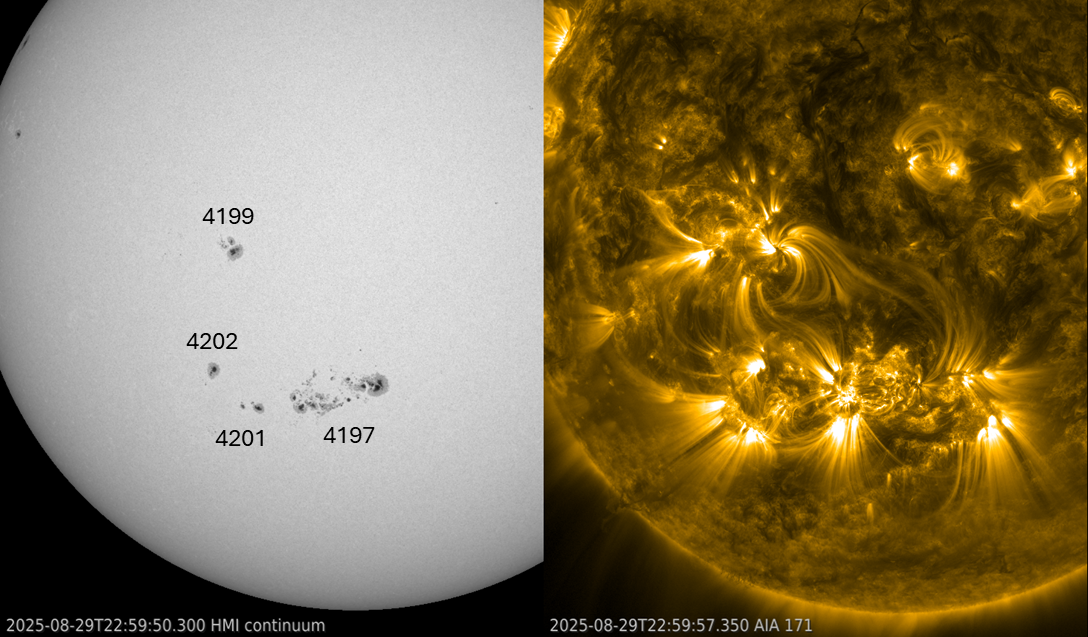
Based on the FSI images, the source region was located about 45 degrees behind the east limb and 5 degrees north as seen from Earth. Using a typical value for the Sun's rotation (13.2 degrees / day), this meant the region would start turning over the east limb late on 24 or early on 25 August. Sure enough, early on 25 August a sunspot group appeared at the expected location near the east limb. NOAA 4199 (SIDC 617 - https://www.sidc.be/services/event-chains/sunspots) consisted basically of a single, big, but fragmented sunspot. Initially, it still produced some M-class flares, including an M4.5 event on 25 August and an M3.3 a day later. From then onwards, other active regions dominated the flare activity and NOAA 4199 seemed to decay. Its magnetic structure was also simple (no delta configuration - https://www.stce.be/educational/classification#wilson ). It continued to be connected with nearby active regions in the southern solar hemisphere, and during the course of 30 August, its main sunspot started to become more compact again. This is shown in the SDO imagery underneath (HMI left; AIA 171 right; annotated image with NOAA numbers).
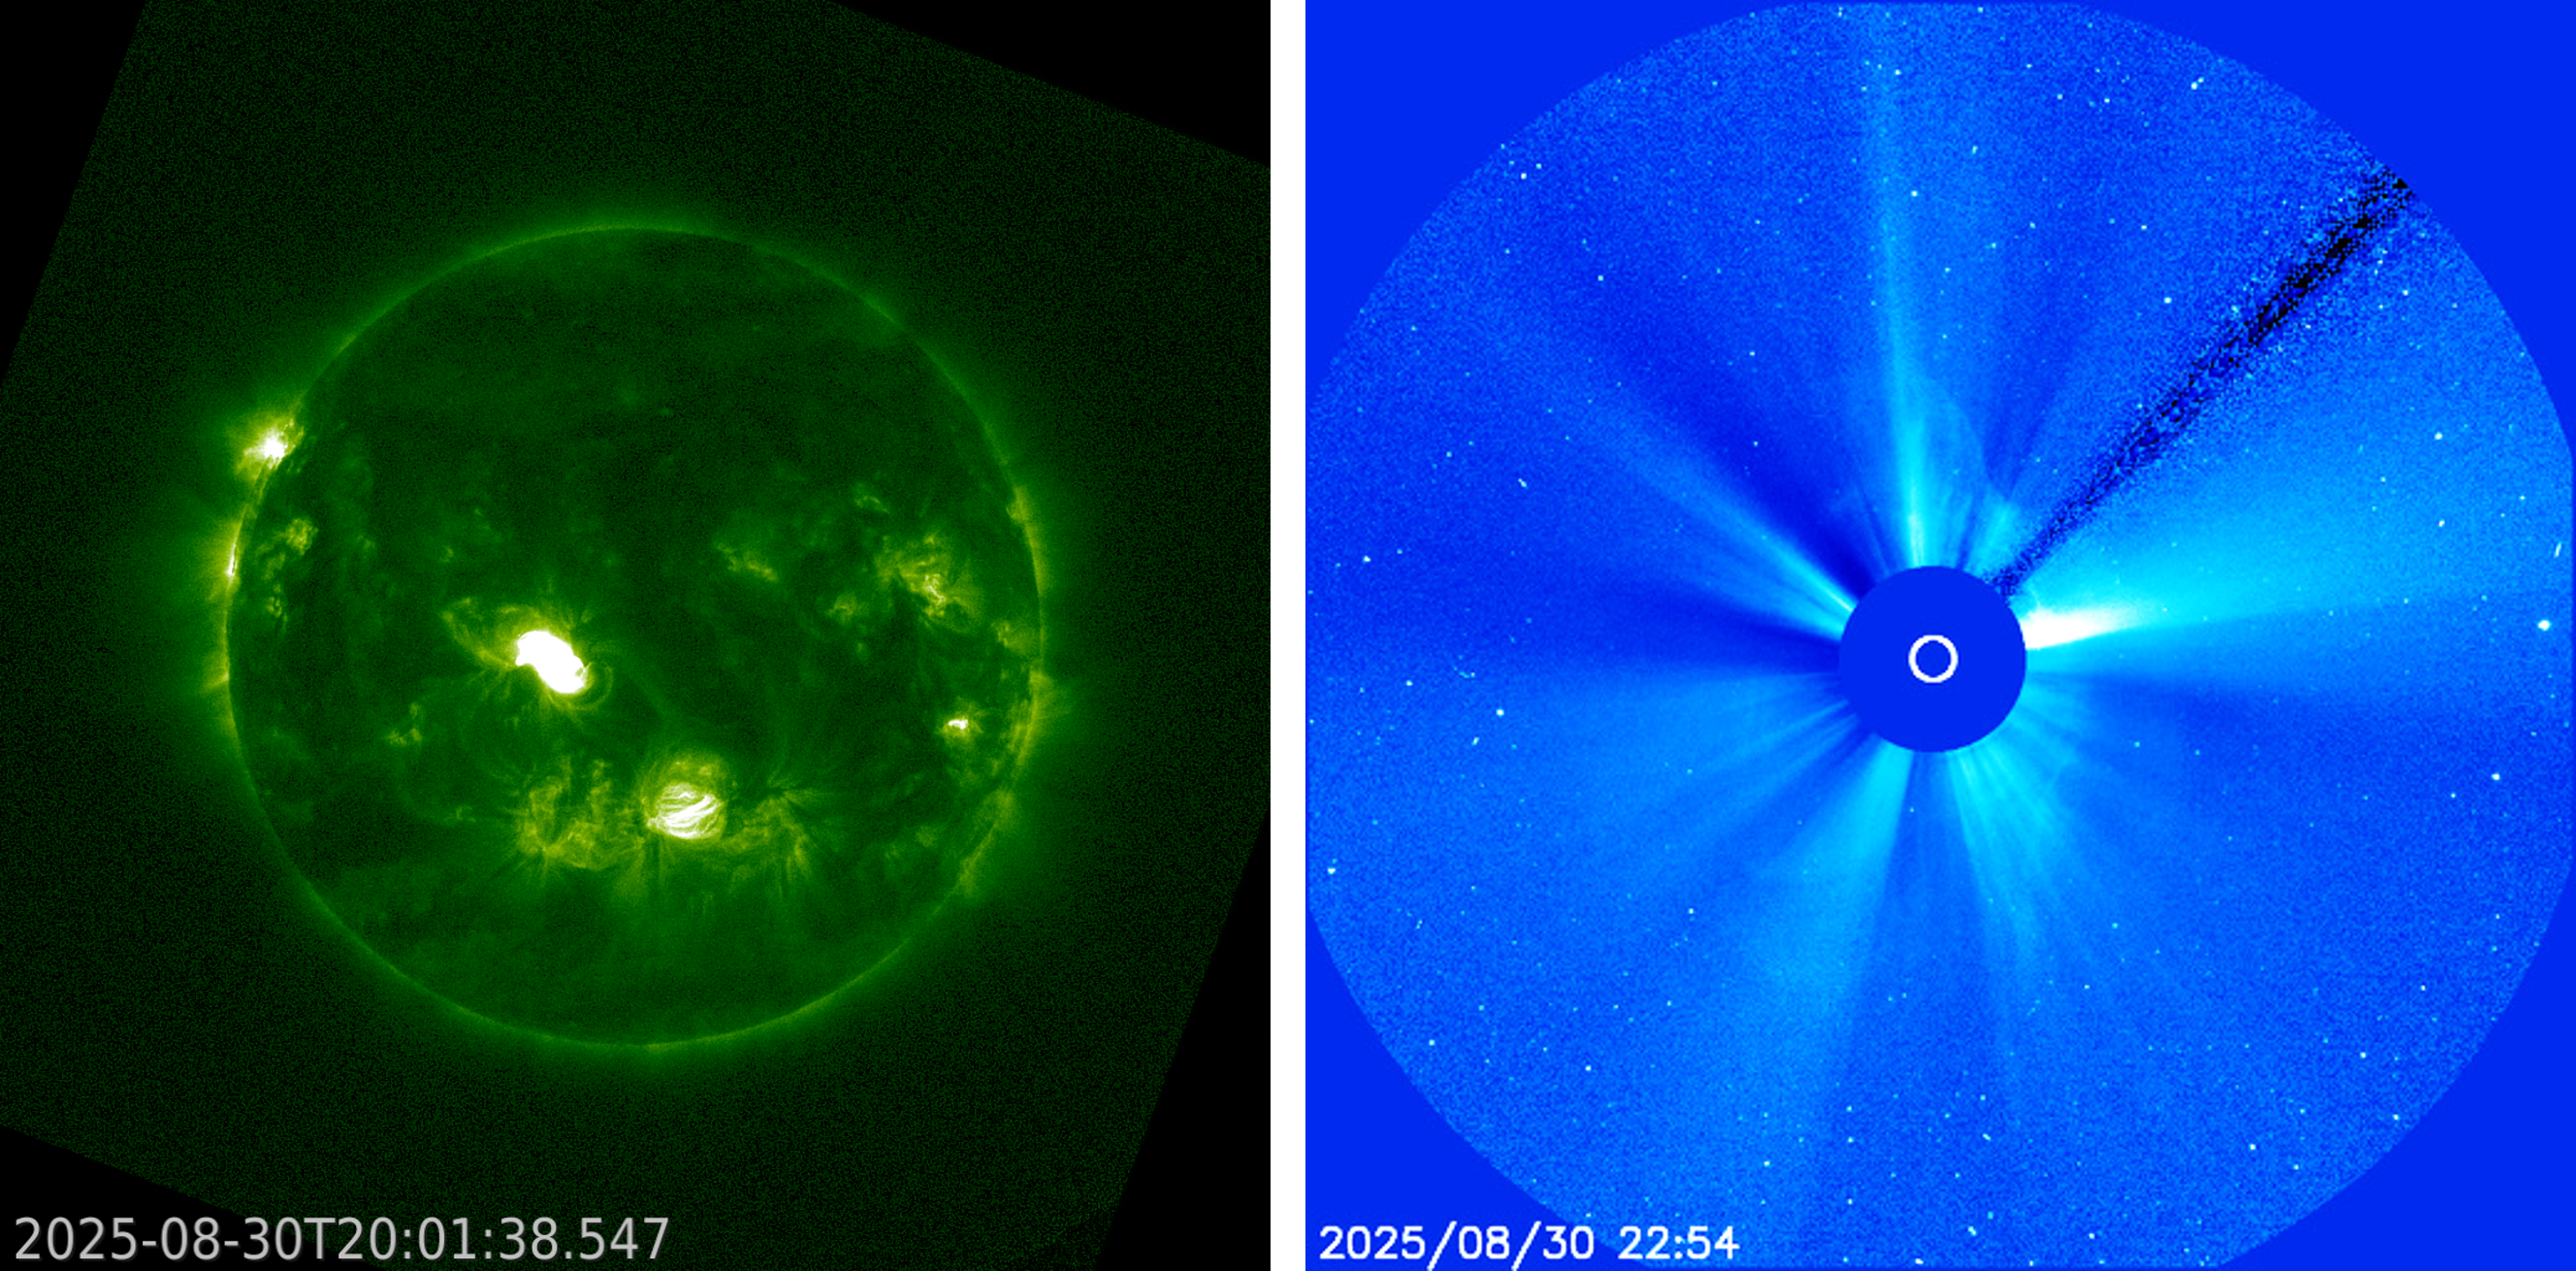
Yet, it was still quite a surprise when late on 30 August NOAA 4199 was the source of a long duration event that peaked at 20:02 UTC. The radio emission associated with this M2.7 flare strongly affected the value of the daily radio flux (2.8 GHz) as measured by Penticton (see also EOVSA - https://ovsa.njit.edu/browser/?suntoday_date=2025-08-30 and the radiospectrogram online). The proton flux, still enhanced from the 21 August event, started to rise again very slowly. However, this time it peaked already at 6 pfu on 1 September, clearly remaining below the alert threshold. This enhancement can be seen as a bump in the proton flux in the chart above. Because of the location of NOAA 4199, the associated fast (1600 km/s) full halo CME was directed straight to Earth. The CME arrived on 1 September at 20:12UTC (DSCOVR) when the solar wind speed jumped from about 380 km/s to 650 km/s. The north-south component (Bz) of the magnetic field was initially negative, briefly dipping to -23 nT. Then Bz turned mostly positive, thus preventing the development of a strong geomagnetic storm. At the time of this writing, only a single interval with moderate geomagnetic conditions (Kp = 6) has been recorded. The imagery underneath shows the flare in EUV (SUVI 094; left) and the associated faint full halo CME in white light (SOHO/LASCO C3; right).
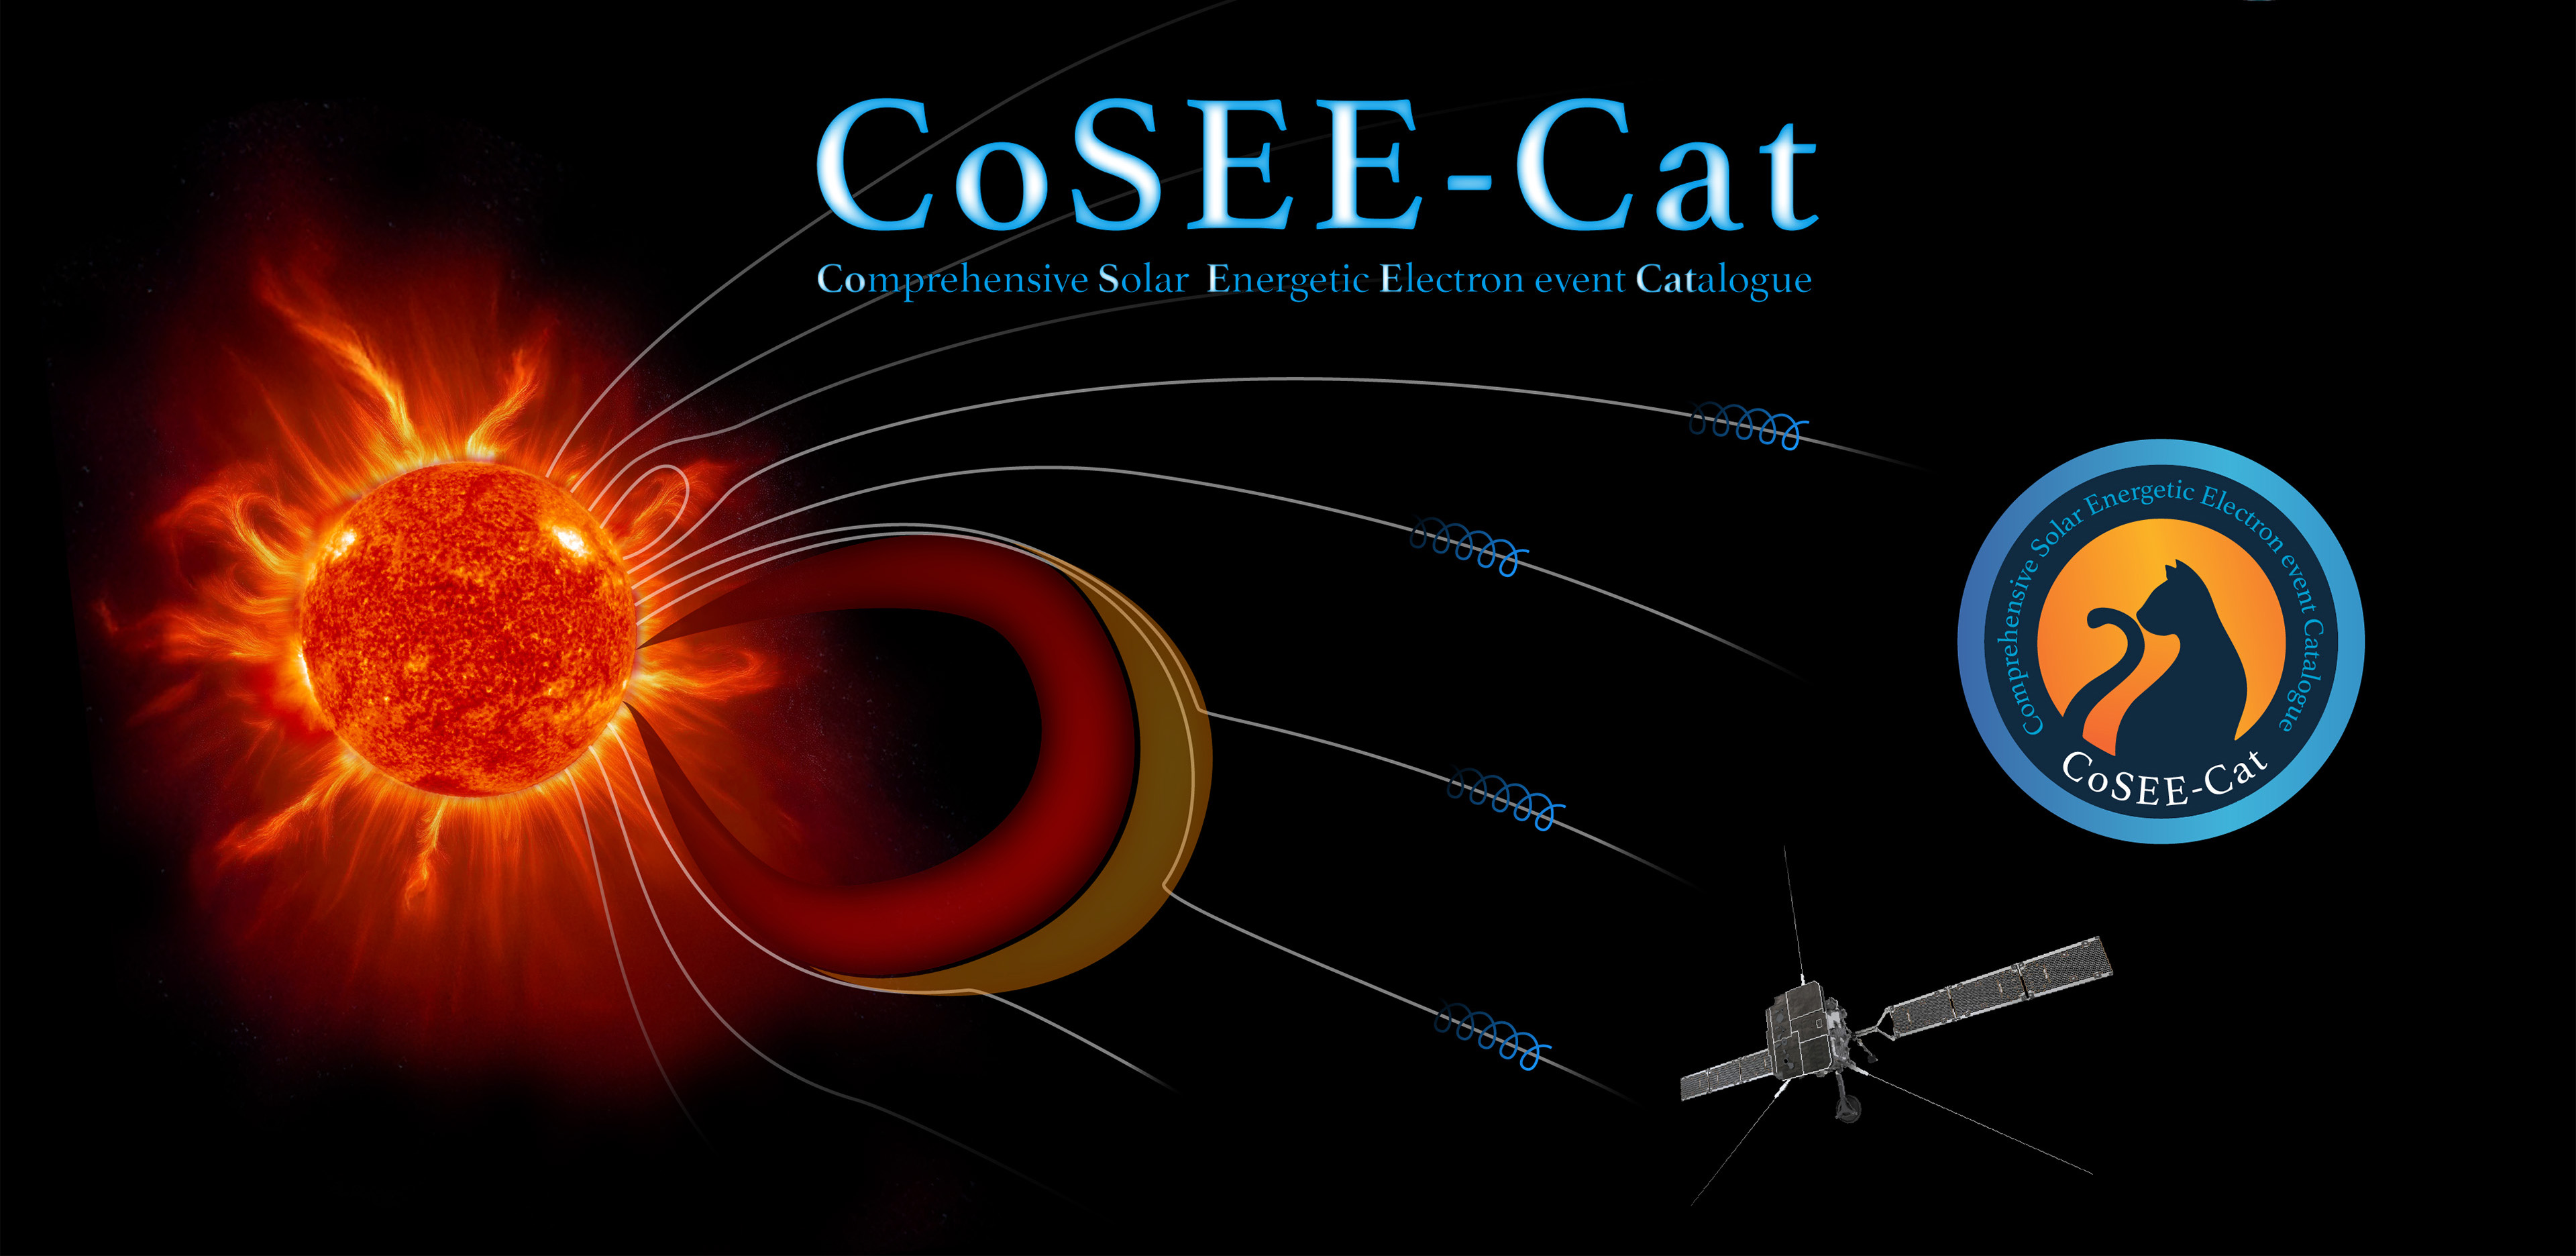
What is a CoSEE-Cat?
CoSEE-Cat is not an animal lounging on your couch but a catalogue of electron streams coming from the Sun.

The streams have been described by parameters measured by eight (8) instruments onboard the spacecraft Solar Orbiter. Each instrument has its own capability: either to see the Sun from a distance or to measure the space environment close to the spacecraft and detect the energetic electron streams arriving at Solar Orbiter. The space environment is shaped by the magnetized solar wind, which marks the path of these violent electrons. These combined in situ measurements and remote observations required some teamwork.
It was well worth the effort: it allowed our scientists to run an in-depth and broad investigation by applying reversed research and tracing back from the spacecraft, bombarded by these streams of superfast electrons, to the place on the Sun where the electrons were boosted to these high energy levels.
Daria Shukhobodskaia and Luciano Rodriguez, both researchers at the Royal Observatory of Belgium, collected the results, ran the statistics and helped writing the scientific paper CoSEE-Cat: a Comprehensive Solar Energetic Electron event Catalogue obtained from combined in-situ and remote-sensing observations from Solar Orbiter.(https://doi.org/10.1051/0004-6361/202554830)
Daria and Luciano could link the fast electrons near the spacecraft to eruptions on the Sun using detailed solar images made by the EUI instrument onboard Solar Orbiter.
Daria: 'Once we knew the source place on the Sun, we knew what was the trigger: or a flare which is in essence a strong light flash or a coronal mass ejection during which solar plasma escapes in a violent way.'
Luciano continues: 'One by one, we identified the trigger of each electron stream near the spacecraft, as a solar flare or a plasma eruption. We could conclude that most events are associated with X-ray and EUV flares. The stronger the flare, which we measure by its peak of the X-ray, the more intense the electron beam arriving at the spacecraft. On the other hand, Coronal Mass Ejections are responsible for longer lasting electron streams.'
Those streams of electrons are a key in space weather as they can be harmful for astronauts, satellites and the onboard electronics.
The ESA story: https://www.esa.int/Science_Exploration/Space_Science/Solar_Orbiter/Double_trouble_Solar_Orbiter_traces_superfast_electrons_back_to_Sun
Review of Solar and Geomagnetic Activity
WEEK 1287 from 2025 Aug 25
Solar Active Regions (ARs) and flares
Twenty five (25) SIDC Sunspot groups were observed on the side of the Sun facing the Earth during the week. We observed 13 M-class flares and numerous C-class flares (the X-ray background was at the C-level). The largest flare was an M4.5 flare (SIDC Flare 5237) peaking on 26 August at 05:25 UTC, which was produced by SIDC Sunspot Group 614 (NOAA Active Region 4197).
Coronal mass ejections
A full halo CME erupted on 30 August, first seen at 20:12 UT on SOHO LASCO C2 imagery. The CME was associated with an M2.7 flare from SIDC Sunspot Group 617 (NOAA 4199), located at N04E01 (almost at disk center). This CME was the only Earth-directed one of the week, with a 3D speed estimate of about 1600 km/s.
Coronal Holes
Two negative polarity coronal holes were present on the solar disk. The first one in the northern hemisphere and the second one at the equator and extending to the southern hemisphere, both small and narrow.
Proton flux levels
The greater than 10 MeV proton flux crossed (slightly) the 10 pfu threshold on 26 August, during 1 day, due to a CME from the previous week. It started to increase again at the end of the week, due to a full halo CME, but didn't reach the threshold.
Electron fluxes at GEO
The greater than 2 MeV electron flux measured by GOES 18-19 were below the threshold every day, with a slight and short increase over it on 25 August.
Solar wind
The Earth was inside slow solar wind most of the week, with speeds around 400 km/s and interplanetary magnetic field around 5 nT. Except for a slight increase on 31 August due to a mild high speed stream arrival.
Geomagnetism
The week saw quiet to unsettled geomagnetic levels both locally and globally (Kp and K_Bel up to 3)., except for one active period locally (K_Bel up to 4) on 25 August.
International Sunspot Number by SILSO

The daily Estimated International Sunspot Number (EISN, red curve with shaded error) derived by a simplified method from real-time data from the worldwide SILSO network. It extends the official Sunspot Number from the full processing of the preceding month (green line), a few days more than one solar rotation. The horizontal blue line shows the current monthly average. The yellow dots give the number of stations that provided valid data. Valid data are used to calculate the EISN. The triangle gives the number of stations providing data. When a triangle and a yellow dot coincide, it means that all the data is used to calculate the EISN of that day.
PROBA2 Observations
Solar Activity
Solar flare activity fluctuated from low to moderate during the week.
In order to view the activity of this week in more detail, we suggest to go to the following website from which all the daily (normal and difference) movies can be accessed: https://proba2.oma.be/ssa
This page also lists the recorded flaring events.
A weekly overview movie (SWAP week 805) can be found here: https://proba2.sidc.be/swap/data/mpg/movies/weekly_movies/weekly_movie_2025_08_25.mp4.
Details about some of this week's events can be found further below.
If any of the linked movies are unavailable they can be found in the P2SC movie repository here: https://proba2.oma.be/swap/data/mpg/movies/.
Tuesday August 26
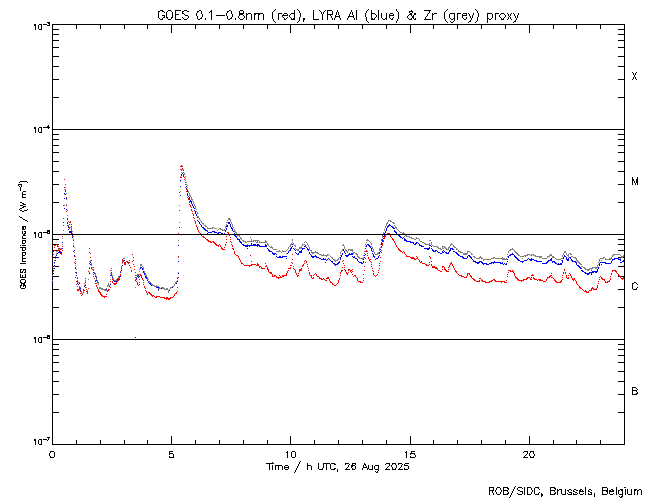
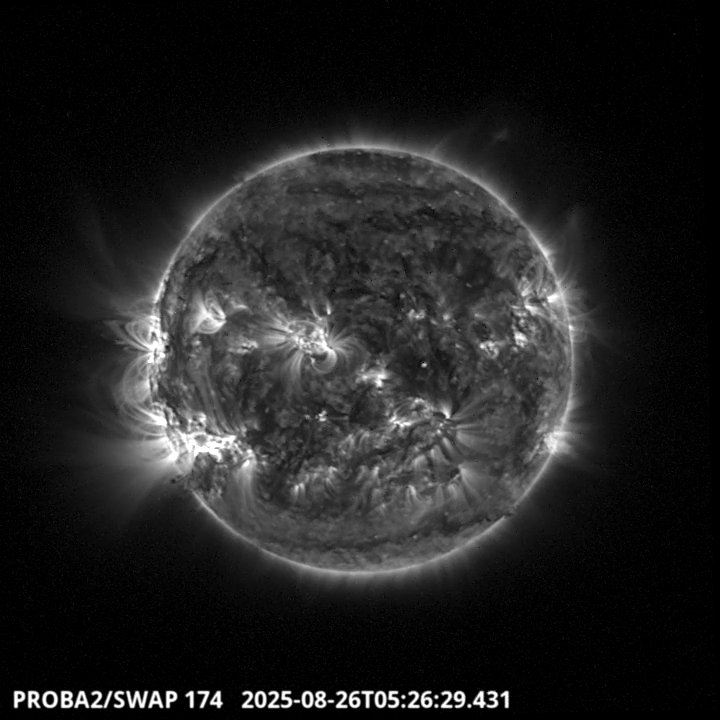
The largest flares of this week were two M4.5, the first one originating from active region NOAA4199 (SIDC 617) on 2025-Aug-25, and the second one from NOAA4197 (SIDC 614) on 2025-Aug-26. They were both observed by PROBA2, but we are presenting the second one, as seen by LYRA (top panel) and SWAP (bottom panel). The flare peaked at 05:25 UT and occurred in the south-eastern quadrant of the Sun.
Find a SWAP movie of the event here: https://proba2.sidc.be/swap/movies/20250826_swap_movie.mp4.
Noticeable Solar Events
| DAY | BEGIN | MAX | END | LOC | XRAY | OP | 10CM | TYPE | Cat | NOAA |
| 25 | 0501 | 0524 | 0540 | M4.5 | 4199 | |||||
| 25 | 0904 | 0907 | 0909 | M1.0 | 95 | 4197 | ||||
| 25 | 1506 | 1518 | 1528 | N5E74 | M1.2 | SF | 4199 | |||
| 25 | 1530 | 1538 | 1541 | M1.1 | 4199 | |||||
| 26 | 0022 | 0030 | 0035 | M3.3 | III/2 | 95 | 4199 | |||
| 26 | 0509 | 0525 | 0540 | S21E47 | M4.5 | 1N | III/2VI/2 | 94 | 4197 | |
| 26 | 1339 | 1407 | 1432 | M1.0 | III/1VI/1 | 4202 | ||||
| 28 | 1411 | 1416 | 1422 | M1.1 | 94 | 4197 | ||||
| 28 | 1700 | 1711 | 1717 | M1.2 | 96 | 4203 | ||||
| 28 | 1848 | 1903 | 1909 | S18E20 | M1.0 | SN | 94 | 4197 | ||
| 28 | 2030 | 2040 | 2046 | M1.5 | 96 | 4203 | ||||
| 28 | 2030 | 2040 | 2046 | M1.5 | 96 | 4203 | ||||
| 29 | 0409 | 0416 | 0418 | M1.0 | 4203 | |||||
| 30 | 1400 | 1409 | 1423 | M1.3 | 94 | 4197 | ||||
| 30 | 1551 | 1559 | 1612 | M1.2 | 94 | 4197 | ||||
| 30 | 1911 | 2002 | 2041 | M2.7 | 95 | 4199 |
| LOC: approximate heliographic location | TYPE: radio burst type |
| XRAY: X-ray flare class | Cat: Catania sunspot group number |
| OP: optical flare class | NOAA: NOAA active region number |
| 10CM: peak 10 cm radio flux |
Geomagnetic Observations in Belgium

Local K-type magnetic activity index for Belgium based on data from Dourbes (DOU) and Manhay (MAB). Comparing the data from both measurement stations allows to reliably remove outliers from the magnetic data. At the same time the operational service availability is improved: whenever data from one observatory is not available, the single-station index obtained from the other can be used as a fallback system.
Both the two-station index and the single station indices are available here: http://ionosphere.meteo.be/geomagnetism/K_BEL/
Review of Ionospheric Activity


VTEC time series at 3 locations in Europe from 25 Aug 2025 till 31 Aug 2025
The top figure shows the time evolution of the Vertical Total Electron Content (VTEC) (in red) during the last week at three locations:
a) in the northern part of Europe(N 61deg E 5deg)
b) above Brussels(N 50.5deg, E 4.5 deg)
c) in the southern part of Europe(N 36 deg, E 5deg)
This top figure also shows (in grey) the normal ionospheric behaviour expected based on the median VTEC from the 15 previous days.
The time series below shows the VTEC difference (in green) and relative difference (in blue) with respect to the median of the last 15 days in the North, Mid (above Brussels) and South of Europe. It thus illustrates the VTEC deviation from normal quiet behaviour.
The VTEC is expressed in TECu (with TECu=10^16 electrons per square meter) and is directly related to the signal propagation delay due to the ionosphere (in figure: delay on GPS L1 frequency).
The Sun's radiation ionizes the Earth's upper atmosphere, the ionosphere, located from about 60km to 1000km above the Earth's surface.The ionization process in the ionosphere produces ions and free electrons. These electrons perturb the propagation of the GNSS (Global Navigation Satellite System) signals by inducing a so-called ionospheric delay.
See http://stce.be/newsletter/GNSS_final.pdf for some more explanations; for more information, see https://gnss.be/SpaceWeather
The SIDC Space Weather Briefing
The forecaster on duty presented the SIDC briefing that gives an overview of space weather from August 25 to 31.
The pdf of the presentation can be found here: https://www.stce.be/briefings/20250901_SWbriefing.pdf
Upcoming Activities
Courses, seminars, presentations and events with the Sun-Space-Earth system and Space Weather as the main theme. We provide occasions to get submerged in our world through educational, informative and instructive activities.
* Sep 8-10, STCE course: Role of the ionosphere and space weather in military communications, Brussels, Belgium - register: https://events.spacepole.be/event/226/
* Sep 20, Public Lecture: België op weg naar de zon met Proba-3, UGhent Volkssterrenwacht Armand Pien, Gent, Belgium
* Oct 23-25, ESWW Space Weather Training by Umea University and STCE, Kiruna, Sweden - Full
* Oct 27-31, European Space Weather Week, Umea, Sweden - https://esww.eu/
* Nov 17-19, STCE Space Weather Introductory Course, Brussels, Belgium - register: https://events.spacepole.be/event/217/
To register for a course and check the seminar details, navigate to the STCE Space Weather Education Center: https://www.stce.be/SWEC
If you want your event in the STCE newsletter, contact us: stce_coordination at stce.be
Website: https://www.stce.be/SWEC