- Table of Content
- 1.Deceptive
- 2.Review of Sola...
- 3.International ...
- 4.PROBA2 Observa...
- 5.Noticeable Sol...
- 6.Geomagnetic Ob...
- 7.Review of Iono...
- 8.The SIDC Space...
- 9.Upcoming Activ...
2. Review of Solar and Geomagnetic Activity
3. International Sunspot Number by SILSO
4. PROBA2 Observations
5. Noticeable Solar Events
6. Geomagnetic Observations in Belgium
7. Review of Ionospheric Activity
8. The SIDC Space Weather Briefing
9. Upcoming Activities - Courses for 2026 are open!
Deceptive
On 11 September, a -at first sight- relatively large and complex sunspot rounded the Sun's east limb. Labeled NOAA 4216 (SIDC 621 - https://www.sidc.be/services/event-chains/sunspots ), it seemed to be the return of a small bipolar group (NOAA 4203) that had started its development 2 weeks earlier just before rounding the west limb. Nonetheless, that region was already the source of 3 M1 flares on 28-29 August. When space weather forecasters analyzed its magnetic structure upon its return on 11-12 September near the east limb, there was a problem: the main sunspots in NOAA 4216 all had the same magnetic polarity. This is contrary to a typical bipolar region where the leading and trailing portions have opposite magnetic polarity.
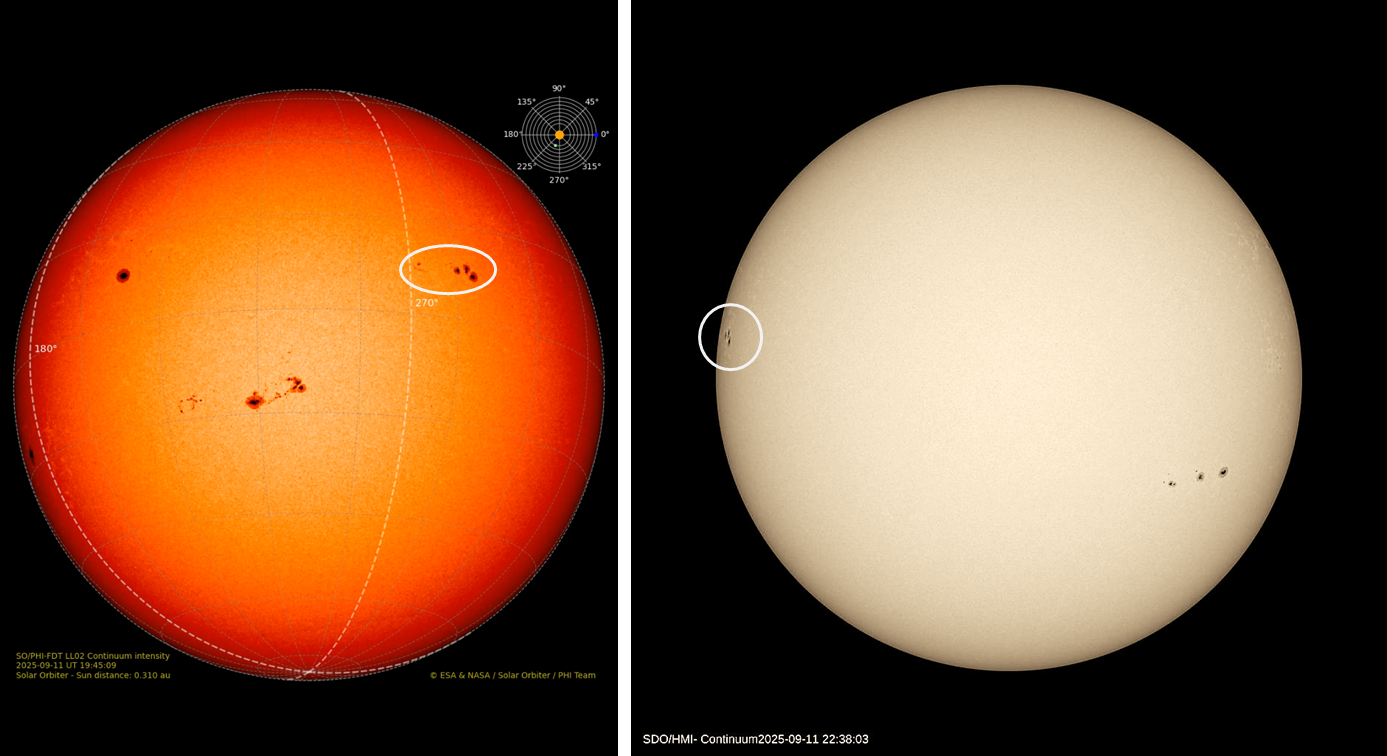
So, how to solve this mystery? Enter Solar Orbiter (SO - https://www.sidc.be/EUI/about/solar-orbiter-spacecraft ), and more precisely one of its instruments: the Polarimetric and Helioseismic Imager (PHI; see MPS: https://www.mps.mpg.de/solar-physics/solar-orbiter-phi ). Its main goal is to study the magnetic field at the Sun's "surface" (the photosphere). It has a High Resolution Telescope (HRT) and a Full Disk Telescope (FDT) that make images in white light as well as magnetograms, thus revealing the magnetic structure of the active regions. As seen from Earth, SO was located on the opposite side of the Sun, quickly moving towards the Sun's east limb. In the annotated imagery above (image credits: MPS), the left image was taken in white light by SO/PHI on 11 September. The dashed lines of 180° and 270° denote the meridian directly opposite of the Earth (the Sun's farside), and the Sun's east limb as seen from Earth. The respective location of SO (green dot), the Sun (yellow), and the Earth (blue dot) can also be seen on the grid in the upper right corner. The sunspot region indicated by the white ellipses shows NOAA 4216 as seen by SO/PHI (left image) and by SDO/HMI (right), the latter image taken around the same time as SO/PHI's. The similarity of the main, leading portion of NOAA 4216 can easily be recognized in both images.
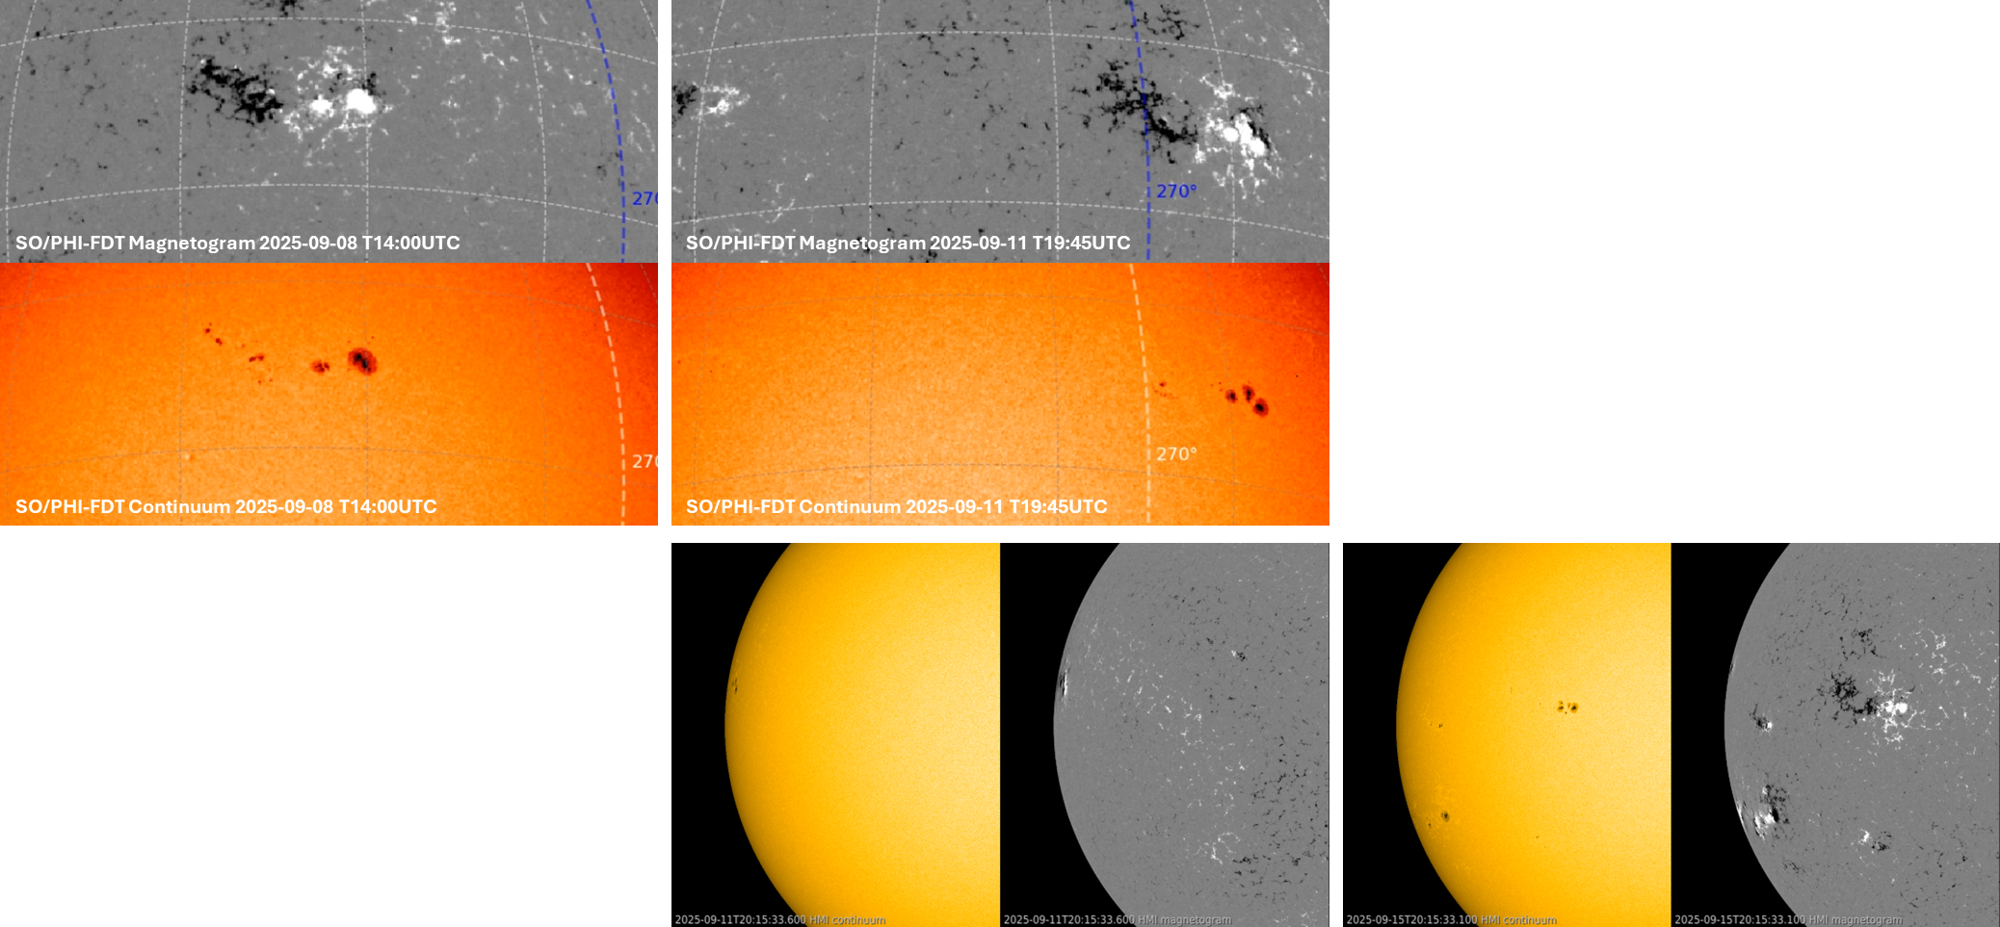
The imagery underneath -accompanying clips are available in the online version of this article at https://www.stce.be/news/783/welcome.html - show the evolution of NOAA 4203/4216 in white light and magnetograms while it was on the Sun's farside on 8 September, rounding the east limb on 11 September, and while it was facing Earth on 15 September. It becomes clear that over those 1-2 weeks, NOAA 4203 developed into a lengthy group with a big leading sunspot, but was already decaying by the time it reached the Sun's east limb. By that time (11 September), only a fragmented leading sunspot remained with almost no sunspots left in its trailing portion. Without SO's images of the farside evolution of this active region, one could easily confuse the leading spots of NOAA 4216 with the entire active region NOAA 4203, making it much more complex than it actually was. As NOAA 4216 rotated better into view of SDO/HMI, the long region continued its gradual decay as shown in the 11 and 15 September images by SDO.
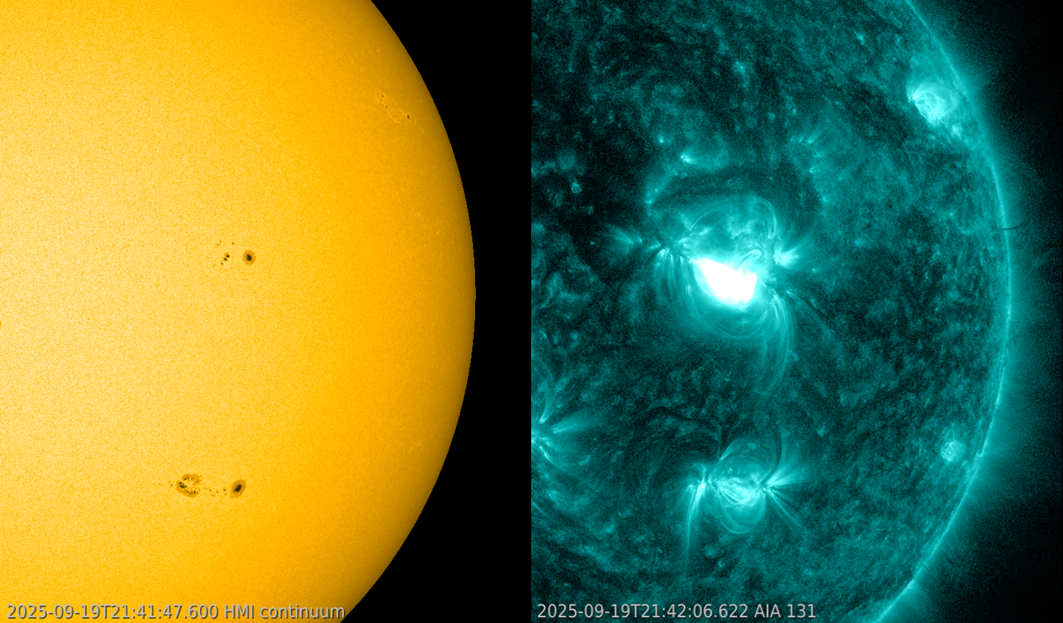
Sunspot observers usually do not look at magnetograms or satellite imagery when they count sunspots and make sunspot classifications (see the STCE's space weather classification page at https://www.stce.be/educational/classification#sunspot ). The main reason is that they have to keep their observations comparable with sunspot observations from 100 or 200 years ago when observers did not have magnetograms or satellites at their disposal. In contrast, today's space weather forecasters have to use all data available in order to make as accurate forecasts of the flare activity as possible. Without knowing the history of NOAA 4216 as outlined above, forecasters could incorrectly attribute a two to three times higher probability on an M-class flare from NOAA 4216 than with the correct classifications at hand. In the end, aside a few C-class flares, NOAA 4216 would produce only a single M-class flare: an M1.5 flare on 19 September. Underneath a white light image (left) and an extreme ultraviolet image (right) by SDO taken around the time of the flare's peak.
Review of Solar and Geomagnetic Activity
Solar Active Regions (ARs) and flares
The solar flaring activity over the past week was mostly at low levels with background low C-class flaring. An M1.5-flare (SIDC Flare 5521) with peak time at 21:41 UTC was registered on Sept 19 escalating the flaring activity to moderate levels.
A total of 19 active regions were numbered on the visible solar disk, most of which were magnetically simple. SIDC Sunspot Group 637 (NOAA Active Region 4220) was the largest and most complex region throughout the week. It exhibited rather quick flux emergence and was classified as magnetic type beta-gamma-delta. Despite its complexity the active region produced only low C-class flaring.
Sunspot Group 621 (corresponding to NOAA Active Regions 4216 and 4222) was another notable region which developed a beta-gamma magnetic field configuration and produced the M-class flaring on Sept 16.
Coronal mass ejections
No Earth-directed coronal mass ejections (CMEs) were detected in the available coronagraph imagery throughout the week.
Coronal Holes
A mid-latitude negative polarity-coronal (SIDC Coronal Hole 126) has reached the central meridian on Sept 19. The high speed stream associated to this coronal hole was expected to reach the Earth by the end of Sept 21 or early on Sept 22.
Proton flux levels
The greater than 10 MeV GOES proton flux was at nominal levels throughout the entire week.
Electron fluxes at GEO
As a result of a fast high speed stream arrival, the greater than 2 MeV electron flux as measured by GOES 18 and GOES 19 was exceeding the 1000 pfu threshold for prolonged periods of time starting from Sept 16 until the end of the week. The corresponding electron fluence reached moderate levels on Sept 17 and remained at moderate levels for the remaining of the week.
Solar wind
The solar wind conditions (as measured by ACE) reflected a fast high speed stream (HSS) arrival in the UTC evening on Sept 14. This HSS was associated with the recurrent SIDC Coronal Hole 116 (negative polarity), which first crossed the central meridian on Sept 10. The magnitude of the interplanetary magnetic field (B) reached a maximum value of 21 nT with a minimum Bz of -16.7 nT. The B field phi angle was predominantly in the negative sector (directed towards the Sun) reflecting the polarity of the geo-effective coronal hole (SIDC Coronal Hole 116). The solar wind speed reached a maximum of 857 km/s under the influence of the HSS and decreased to below 300 km/s as the conditions returned to a slow solar wind regime towards the end of the week.
Geomagnetism
The geomagnetic conditions on Sept 14 reached minor storm levels as a result of a fast high speed stream arrival. Major storm levels were registered on Sept 15 with NOAA Kp = 6.67 between 00:00 and 03:00 UTC followed by further several periods at minor storm levels. Predominantly active conditions with an isolated minor storm were registered on Sept 16 and mostly quiet to unsettled conditions have followed for the remaining of the week.
Locally, over Belgium, only minor geomagnetic storms were registered on Sept 15, followed by unsettled to active conditions on Sept 16 and predominantly quiet to unsettled conditions thereafter.
International Sunspot Number by SILSO

The daily Estimated International Sunspot Number (EISN, red curve with shaded error) derived by a simplified method from real-time data from the worldwide SILSO network. It extends the official Sunspot Number from the full processing of the preceding month (green line), a few days more than one solar rotation. The horizontal blue line shows the current monthly average. The yellow dots give the number of stations that provided valid data. Valid data are used to calculate the EISN. The triangle gives the number of stations providing data. When a triangle and a yellow dot coincide, it means that all the data is used to calculate the EISN of that day.
PROBA2 Observations
Solar Activity
Solar flare activity fluctuated from low to moderate during the week.
In order to view the activity of this week in more detail, we suggest to go to the following website from which all the daily (normal and difference) movies can be accessed: https://proba2.oma.be/ssa
This page also lists the recorded flaring events.
A weekly overview movie can be found here (SWAP week 808): https://proba2.sidc.be/swap/data/mpg/movies/weekly_movies/weekly_movie_2025_09_15.mp4
Details about some of this week's events can be found further below.
If any of the linked movies are unavailable they can be found in the P2SC movie repository here: https://proba2.sidc.be/swap/data/mpg/movies/
Friday Sep 19
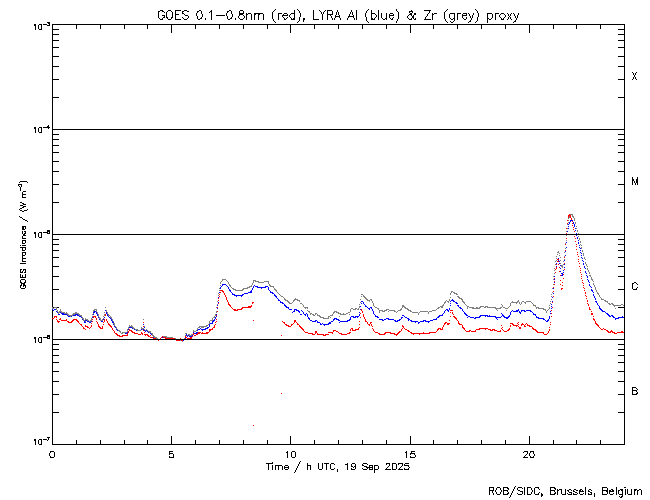
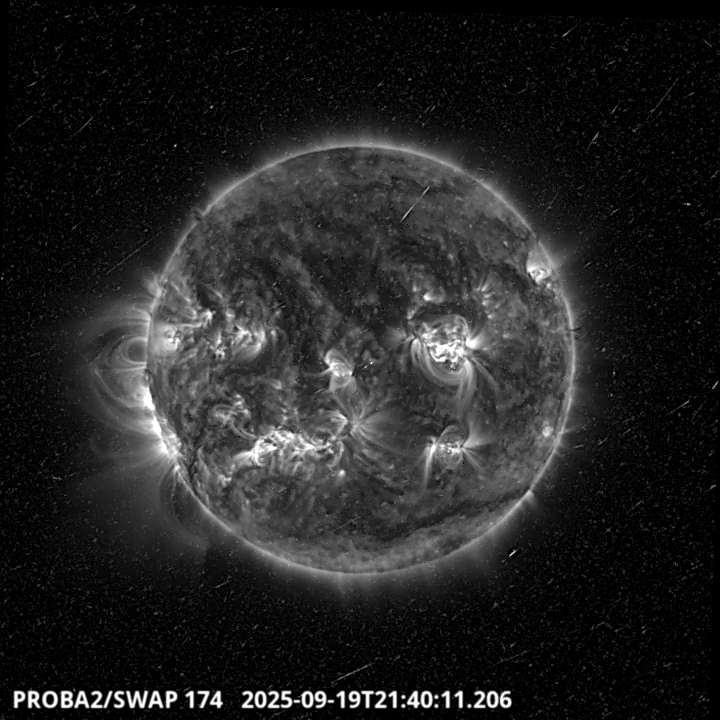
The largest flare of this week was an M1.5, it was observed by LYRA (top panel) and SWAP
(bottom panel). The flare peaked on 2025-Sep-19 at 21:41 UT and occurred on the North-West
side of the solar disk, originating from active region NOAA4216.
Find a SWAP movie of the event here: https://proba2.sidc.be/swap/movies/20250919_swap_movie.mp4
Sunday Sep 21
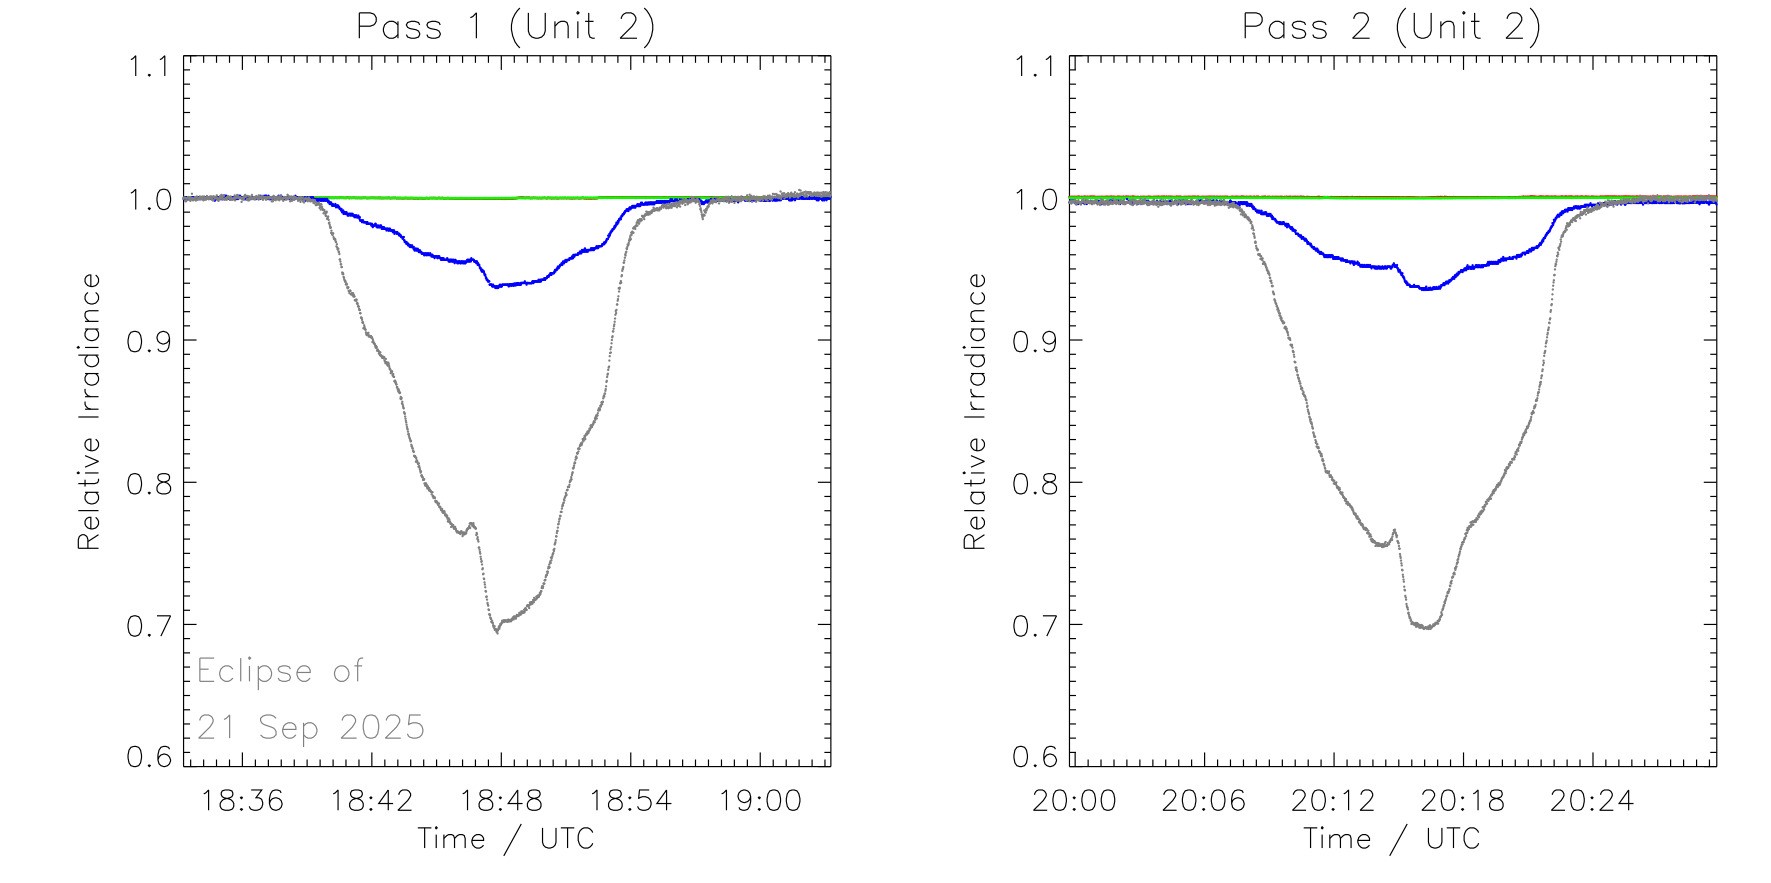
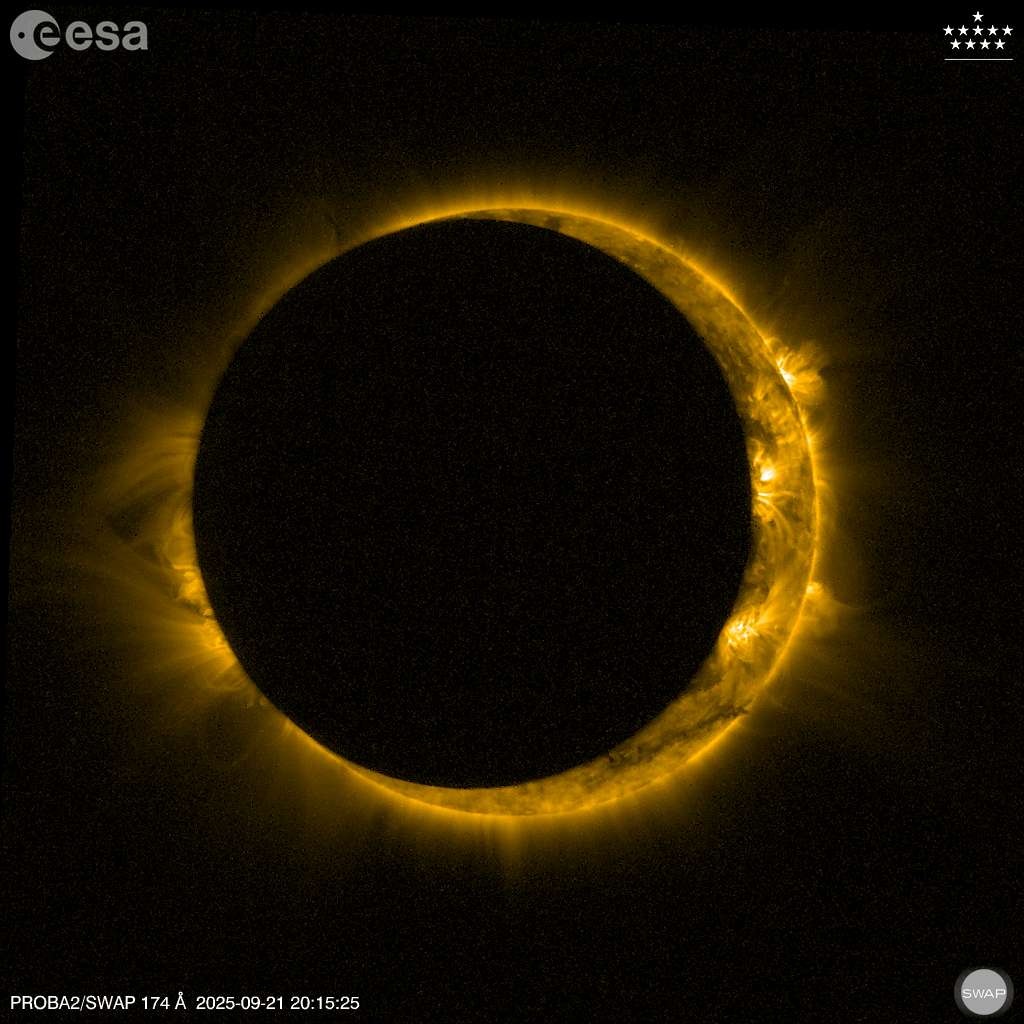
PROBA2 had the opportunity to observe an annular eclipse of the Sun. This marks the 36th
eclipse recorded by the spacecraft since its launch in 2009. PROBA2 crossed the eclipse zone
multiple times, allowing it to capture several unique perspectives. During its third passage,
nearly 90% of the solar disk was occulted by the Moon, producing a striking 'ring of fire' effect.
Find a SWAP movie of the event here: https://proba2.sidc.be/swap/movies/20250921_swap_movie.mp4
Noticeable Solar Events
| DAY | BEGIN | MAX | END | LOC | XRAY | OP | 10CM | TYPE | Cat | NOAA |
| 19 | 2122 | 2141 | 2156 | M1.5 | 17 | 4216 |
| LOC: approximate heliographic location | TYPE: radio burst type |
| XRAY: X-ray flare class | Cat: Catania sunspot group number |
| OP: optical flare class | NOAA: NOAA active region number |
| 10CM: peak 10 cm radio flux |
Geomagnetic Observations in Belgium

Local K-type magnetic activity index for Belgium based on data from Dourbes (DOU) and Manhay (MAB). Comparing the data from both measurement stations allows to reliably remove outliers from the magnetic data. At the same time the operational service availability is improved: whenever data from one observatory is not available, the single-station index obtained from the other can be used as a fallback system.
Both the two-station index and the single station indices are available here: http://ionosphere.meteo.be/geomagnetism/K_BEL/
Review of Ionospheric Activity


VTEC time series at 3 locations in Europe from 15 Sep 2025 till 21 Sep 2025
The top figure shows the time evolution of the Vertical Total Electron Content (VTEC) (in red) during the last week at three locations:
a) in the northern part of Europe(N 61deg E 5deg)
b) above Brussels(N 50.5deg, E 4.5 deg)
c) in the southern part of Europe(N 36 deg, E 5deg)
This top figure also shows (in grey) the normal ionospheric behaviour expected based on the median VTEC from the 15 previous days.
The time series below shows the VTEC difference (in green) and relative difference (in blue) with respect to the median of the last 15 days in the North, Mid (above Brussels) and South of Europe. It thus illustrates the VTEC deviation from normal quiet behaviour.
The VTEC is expressed in TECu (with TECu=10^16 electrons per square meter) and is directly related to the signal propagation delay due to the ionosphere (in figure: delay on GPS L1 frequency).
The Sun's radiation ionizes the Earth's upper atmosphere, the ionosphere, located from about 60km to 1000km above the Earth's surface.The ionization process in the ionosphere produces ions and free electrons. These electrons perturb the propagation of the GNSS (Global Navigation Satellite System) signals by inducing a so-called ionospheric delay.
See http://stce.be/newsletter/GNSS_final.pdf for some more explanations; for more information, see https://gnss.be/SpaceWeather
The SIDC Space Weather Briefing
The forecaster on duty presented the SIDC briefing that gives an overview of space weather from September 15 to 21.
The pdf of the presentation can be found here: https://www.stce.be/briefings/20250922_SWbriefing.pdf
Upcoming Activities - Courses for 2026 are open!
Courses, seminars, presentations and events with the Sun-Space-Earth system and Space Weather as the main theme. We provide occasions to get submerged in our world through educational, informative and instructive activities.
* Oct 23-25, ESWW Space Weather Training by Umea University and STCE, Kiruna, Sweden - Full
* Oct 27-31, European Space Weather Week, Umea, Sweden - https://esww.eu/
* Nov 17-19, STCE Space Weather Introductory Course, Brussels, Belgium - register: https://events.spacepole.be/event/217/ - Full
* Feb 9-11, 2026, STCE Space Weather Introductory Course, Brussels, Belgium - register: https://events.spacepole.be/event/255/
* Mar 16-18, 2026, STCE course: Role of the ionosphere and space weather in military communications, Brussels, Belgium - register: https://events.spacepole.be/event/258/
* Apr 20-21, 2026, STCE cursus: inleiding tot het ruimteweer, Brussels, Belgium - register: https://events.spacepole.be/event/260/
* Mar 23, 2026, STCE lecture: From physics to forecasting, Space Weather course, ESA Academy, Redu, Belgium
* Jun 15-17, 2026, STCE Space Weather Introductory Course, Brussels, Belgium - register: https://events.spacepole.be/event/256/
* Oct 12-14, 2026, STCE Space Weather Introductory Course, Brussels, Belgium - register: https://events.spacepole.be/event/257/
* Nov 23-25, 2026, STCE course: Role of the ionosphere and space weather in military communications, Brussels, Belgium - register: https://events.spacepole.be/event/259/
* Dec 7-9, 2026, STCE Space Weather Introductory Course for Aviation, Brussels, Belgium - register: https://events.spacepole.be/event/262/
To register for a course and check the seminar details, navigate to the STCE Space Weather Education Center: https://www.stce.be/SWEC
If you want your event in the STCE newsletter, contact us: stce_coordination at stce.be
Website: https://www.stce.be/SWEC