- Table of Content
- 1.The EUI team h...
- 2.STCE course an...
- 3.Review of spac...
- 4.International ...
- 5.Noticeable Sol...
- 6.Geomagnetic Ob...
- 7.The SIDC Space...
- 8.PROBA2 Observa...
- 9.Review of Iono...
- 10.STCE trainings...
2. STCE course and training dates for 2026
3. Review of space weather
4. International Sunspot Number by SILSO
5. Noticeable Solar Events
6. Geomagnetic Observations in Belgium
7. The SIDC Space Weather Briefing
8. PROBA2 Observations
9. Review of Ionospheric Activity
10. STCE trainings and presentations
The EUI team has become millionaires!
September 2025. The space instrument EUI onboard the spacecraft Solar Orbiter, took its millionth solar picture.
Natural hazard on Earth coming from the Sun
The Sun stands for light, warmth, beauty but also for solar weather busting down on Earth.
Solar light, solar plasma and solar energetic particles can lead to storms in the earth’s atmosphere and magnetic shield impacting space and earth based technology on which society relies.
The Sun is probably the most photographed celestial object
That’s why we need to keep an eye on the Sun and we have to try to grasp her in the biggest structures and in the smallest details. The telescope EUI is one of the flagships in fundamental solar research. Its view on details in the solar atmosphere helps us to understand why the solar wind moves as it moves and what triggers solar storms.
movie: https://stce.be/movies/JHV_2025-10-03_09.46.27.mp4
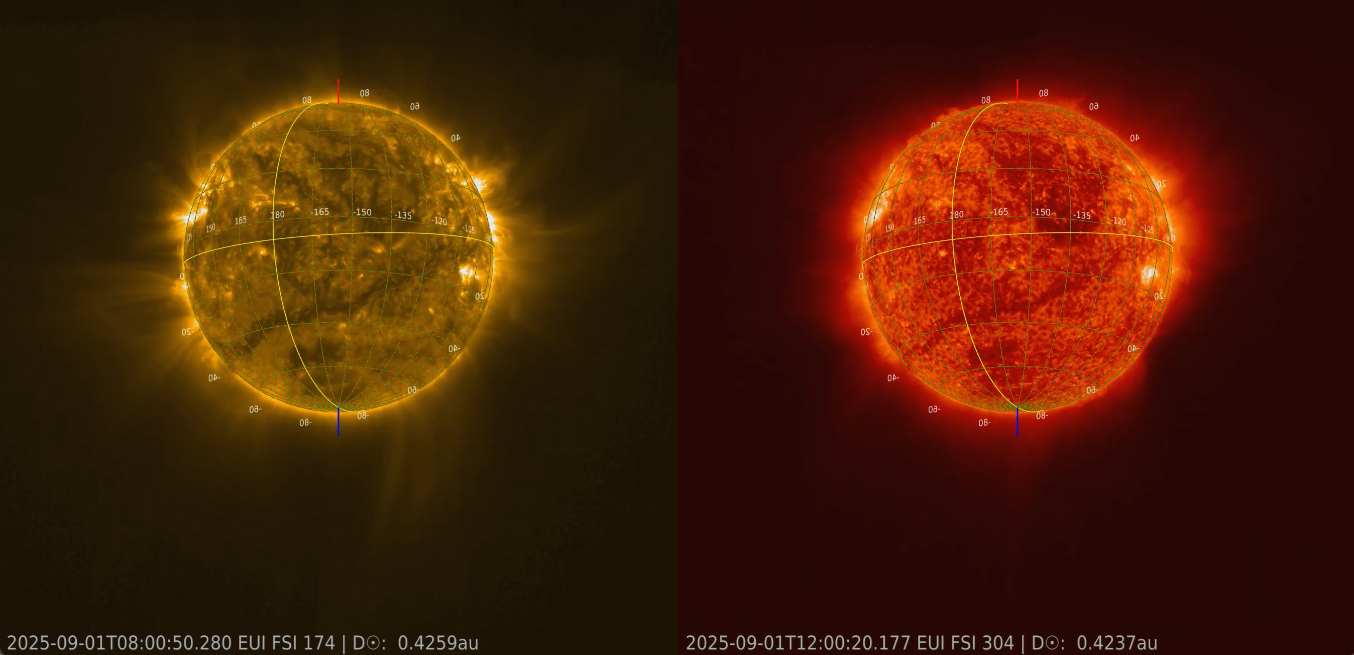
Overview of the last month of EUI/FSI images as Solar Orbiter is rotating from the back side of the Sun to the front side. The numbers on the solar equator indicate the difference in solar longitude with the Earth. Left FSI@17.4nm in yellow showing the corona, Right FSI@30.4nm in red showing the upper solar transition region.
The EUI team has become millionaires!
The data return of a space telescope like EUI operating in deep space is limited in transmitting data. Before launch, it was estimated that EUI could bring down a few ten-thousand images per year. Currently, 5 years after the launch we have collected the 1 millionth image on the ground, meaning EUI is an order of magnitude more productive than foreseen! What happened?
Upgrade on the ground
The ESA Ground Stations that ‘talk’ to the spacecraft have been upgraded in the last few years to a more efficient communications protocol. The communication system of Solar Orbiter already had this advanced system, even if -at the time of launch- no ESA ground station was equipped with it yet. Since early in the mission, this new protocol allows Solar Orbiter to transmit 4 times more data. EUI can take quasi-non-stop images of the Sun knowing that all these images can be sent to Earth. These photoshoots are done at low cadence.
Another reason for the increased image rate is that the EUI team designed a special flare imaging mode that includes very short exposures. These very short exposure images are designed to capture the place of the bright peak of the flare and compress for all other locations extremely well. This means we can take more images in the same transmitting volume.
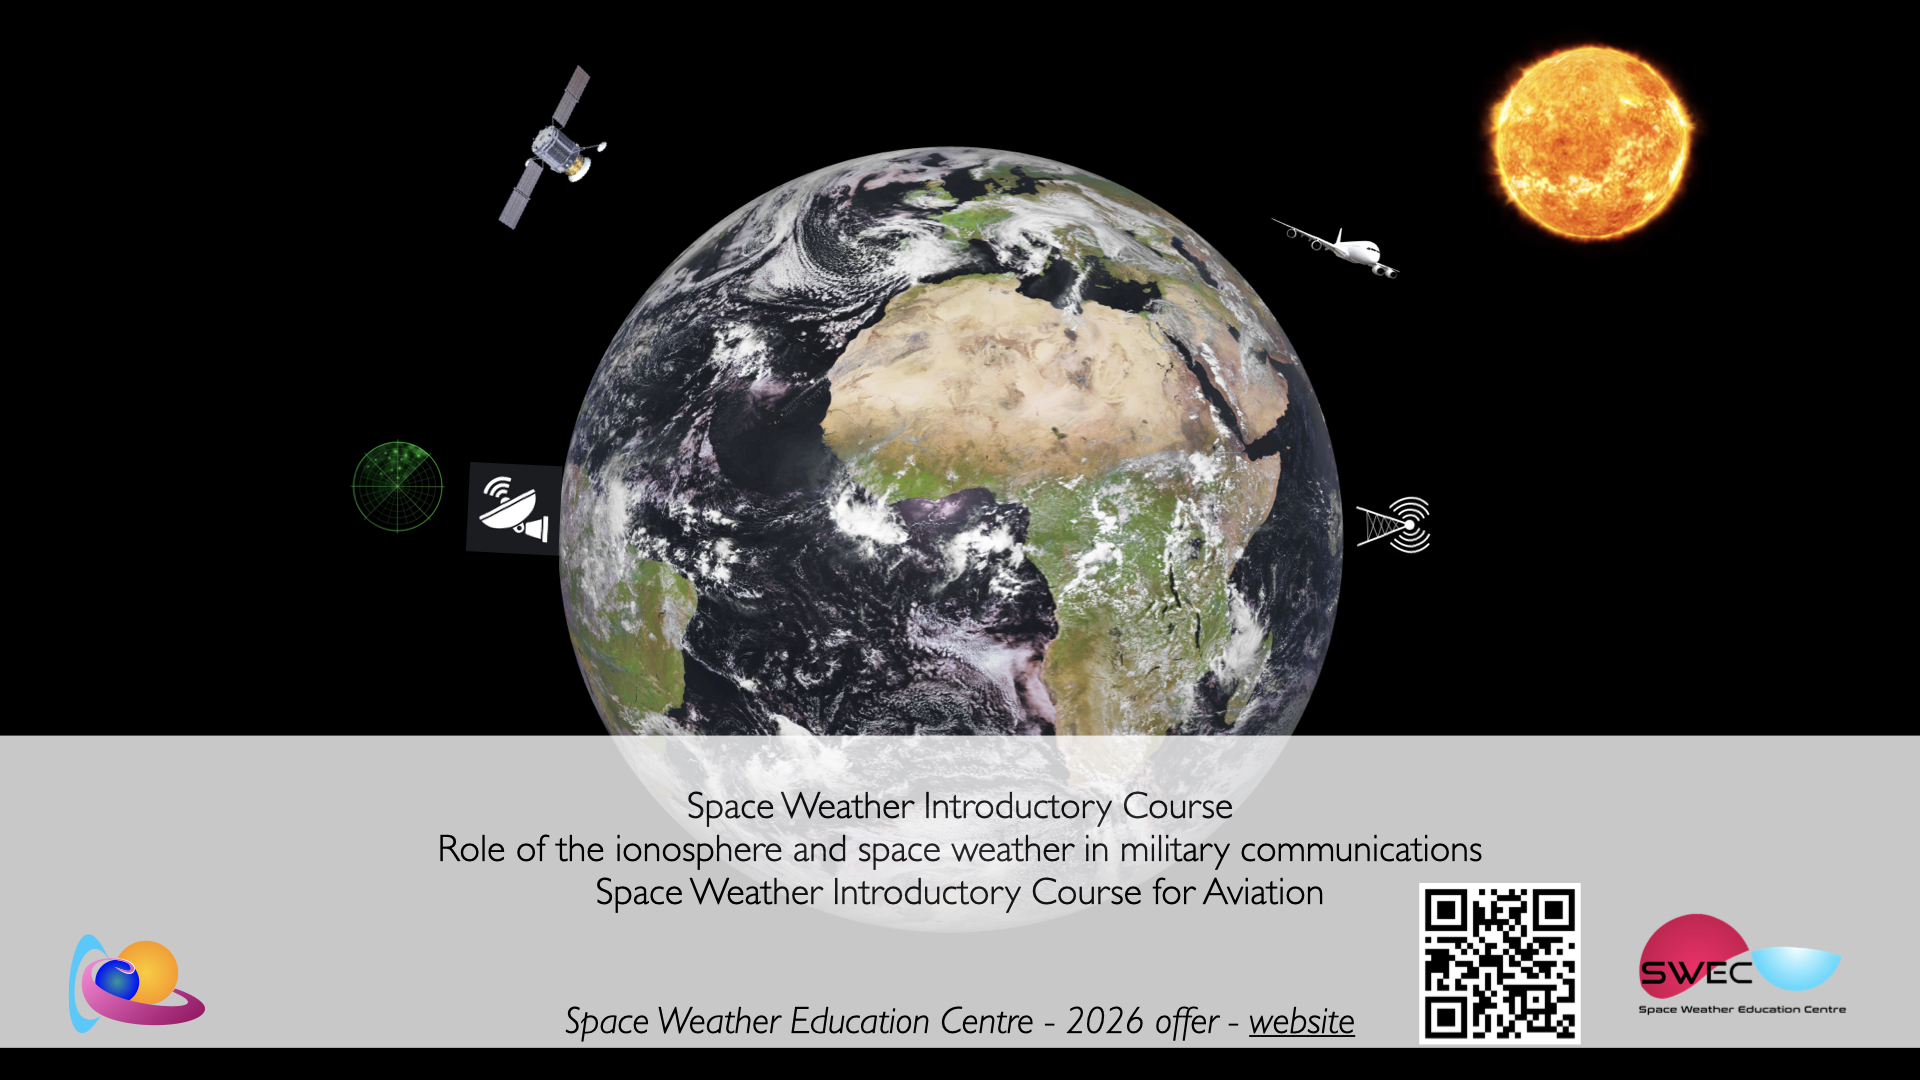
STCE course and training dates for 2026
Space weather, a natural hazard
Which space weather phenomena exist?
How long does it take for a solar storm to reach the earth?
How do we describe the strength of the storm impact on the earth?
What is the physical impact of a space storm on the earth?
Which area on the earth is impacted?
What is ionospheric weather?
How are radar systems, GNSS, radio communication, etc impacted?
Where can I find space weather bulletins?
How do I read a space weather bulletin?
The STCE can help you.
The 2026 list of training and courses by the Space Weather Education Centre is published: https://events.spacepole.be/category/4/
More on the Space Weather Education Centre: https://www.stce.be/SWEC
Review of space weather
Solar Active Regions (ARs) and flares
Solar flaring activity was moderate, with forty-eight C-class flares and seven M-class flares observed. The strongest flare was an M6.4 flare (SIDC Flare 5601) peaking at 08:43 UTC on September 28, which was associated with SIDC Sunspot Group 653 (NOAA Active Region 4232, magnetic type beta-gamma). Twenty-six (26) active regions were observed. SIDC Sunspot Groups 640, 592, 650, 653 (NOAA Active Regions 4217, 4226, 4229, 4232) were the most complex, all with magnetic type beta-gamma.
Coronal mass ejections
A few Coronal Mass Ejections (CMEs) were detected during the week. Almost all of them were either events near the west or east limb or backsided and had no impact on Earth. However, a wide, slow Coronal Mass Ejection (SIDC CME 564) was observed in LASCO/C2 and C3 coronagraph imagery around 02:00 UTC on September 24. It lifted off from the east limb.
Coronal Holes
Two small, equatorial, negative-polarity coronal holes (SIDC Coronal Holes 132 and 133) crossed the central meridian between September 24 and 25. A high-speed stream may have arrived at Earth starting on September 28, though it is unclear which of these coronal holes was associated with it.
Proton flux levels
The greater than 10 MeV proton flux was below the 10 pfu threshold throughout the week.
Electron fluxes at GEO
The greater than 2 MeV electron flux as measured by GOES 18 and GOES 19 was mostly below the 1000 pfu threshold during the week, with short intervals in which it rose above the 1000 pfu threshold. The 24-hour electron fluence was at moderate levels at the beginning of the week and gradually decreased to nominal levels during the week.
Solar wind near Earth
The solar wind parameters (ACE) were enhanced at the beginning of the week, under the influence of the high-speed stream from the mid-latitude negative polarity coronal hole (SIDC Coronal Hole 126) that crossed the central meridian on September 19. Speed values increased from approximately 300 km/s up to approximately 630 km/s. The interplanetary magnetic field values increased from 2 nT to 18 nT. The Bz component varied between -13 nT and 17 nT. A gradual return to the slow solar wind regime followed. The solar wind conditions (ACE) showed again a mild enhancement on September 28, primarily due to the arrival of a glancing blow, associated with the Coronal Mass Ejection (SIDC CME 564) observed around 02:00 UTC on September 24, and potentially influenced by the high-speed stream associated with (SIDC Coronal Hole 133) that crossed the central meridian on September 25. Speed values increased from approximately 350 km/s to approximately 440 km/s. The interplanetary magnetic field values increased from 5 nT to 11 nT. The Bz component varied between -8 nT and 11 nT. The interplanetary magnetic field angle was mostly in the negative sector during the week.
Geomagnetism
Geomagnetic conditions globally were mostly at quiet to unsettled levels (NOAA Kp 1 to 3), with an interval of active conditions (NOAA Kp 4- ) between 12:00 UTC and 15:00 UTC on September 23. Geomagnetic conditions locally were mostly at quiet to unsettled levels (K BEL 1 to 3) throughout the week.
International Sunspot Number by SILSO

The daily Estimated International Sunspot Number (EISN, red curve with shaded error) derived by a simplified method from real-time data from the worldwide SILSO network. It extends the official Sunspot Number from the full processing of the preceding month (green line), a few days more than one solar rotation. The horizontal blue line shows the current monthly average. The yellow dots give the number of stations that provided valid data. Valid data are used to calculate the EISN. The triangle gives the number of stations providing data. When a triangle and a yellow dot coincide, it means that all the data is used to calculate the EISN of that day.
Noticeable Solar Events
| DAY | BEGIN | MAX | END | LOC | XRAY | OP | 10CM | TYPE | Cat | NOAA |
| 23 | 1024 | 1034 | 1038 | S14W42 | M1.0 | SF | III/2 | 22 | 4217 | |
| 24 | 0916 | 0931 | 0944 | M1.0 | 28 | 4224 | ||||
| 24 | 1857 | 1913 | 1922 | M1.6 | 28 | 4224 | ||||
| 26 | 1949 | 2001 | 2007 | M1.6 | II/1 | 4233 | ||||
| 27 | 0329 | 0359 | 0418 | S15W10 | M1.0 | SF | VI/2 | 32 | 4226 | |
| 27 | 0418 | 0423 | 0427 | N18E77 | M1.1 | SF | 32 | 4226 | ||
| 27 | 0703 | 0714 | 0718 | N3E71 | M1.1 | SF | III/2V/3 | 4232 | ||
| 28 | 0834 | 0843 | 0849 | N3E58 | M6.4 | 1 | III/3V/3 | 4232 |
| LOC: approximate heliographic location | TYPE: radio burst type |
| XRAY: X-ray flare class | Cat: Catania sunspot group number |
| OP: optical flare class | NOAA: NOAA active region number |
| 10CM: peak 10 cm radio flux |
Geomagnetic Observations in Belgium

Local K-type magnetic activity index for Belgium based on data from Dourbes (DOU) and Manhay (MAB). Comparing the data from both measurement stations allows to reliably remove outliers from the magnetic data. At the same time the operational service availability is improved: whenever data from one observatory is not available, the single-station index obtained from the other can be used as a fallback system.
Both the two-station index and the single station indices are available here: http://ionosphere.meteo.be/geomagnetism/K_BEL/
The SIDC Space Weather Briefing
The forecaster on duty presented the SIDC briefing that gives an overview of space weather from September 22 to 28.
The pdf of the presentation: https://www.stce.be/briefings/20250929_SWbriefing.pdf
PROBA2 Observations
Solar Activity
Solar flare activity fluctuated from low to moderate during the week.
In order to view the activity of this week in more detail, we suggest to go to the following website from which all the daily (normal and difference) movies can be accessed: https://proba2.oma.be/ssa
This page also lists the recorded flaring events.
A weekly overview movie can be found here (SWAP week 809). https://proba2.sidc.be/swap/data/mpg/movies/weekly_movies/weekly_movie_2025_09_22.mp4
Details about some of this week's events can be found further below.
If any of the linked movies are unavailable they can be found in the P2SC movie repository here https://proba2.sidc.be/swap/data/mpg/movies/
Wednesday Sep 24
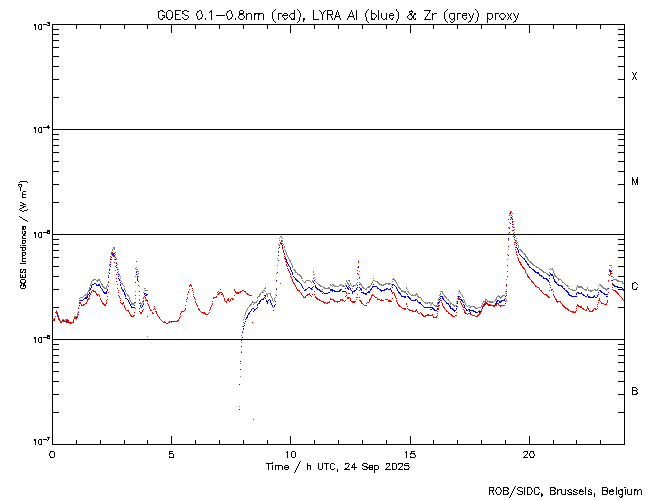

A large flare of this week was an M1.6, it was observed by LYRA (top panel) and SWAP (bottom
panel). The flare peaked on 2025-Sep-24 at 19:13 UT and occurred in the South-West part of the
solar disk, originating from active region NOAA4224. Find a SWAP movie of the event here. https://proba2.sidc.be/swap/movies/20250924_swap_movie.mp4
Review of Ionospheric Activity


VTEC time series at 3 locations in Europe from 22 Sep 2025 till 28 Sep 2025
The top figure shows the time evolution of the Vertical Total Electron Content (VTEC) (in red) during the last week at three locations:
a) in the northern part of Europe(N 61deg E 5deg)
b) above Brussels(N 50.5deg, E 4.5 deg)
c) in the southern part of Europe(N 36 deg, E 5deg)
This top figure also shows (in grey) the normal ionospheric behaviour expected based on the median VTEC from the 15 previous days.
The time series below shows the VTEC difference (in green) and relative difference (in blue) with respect to the median of the last 15 days in the North, Mid (above Brussels) and South of Europe. It thus illustrates the VTEC deviation from normal quiet behaviour.
The VTEC is expressed in TECu (with TECu=10^16 electrons per square meter) and is directly related to the signal propagation delay due to the ionosphere (in figure: delay on GPS L1 frequency).
The Sun's radiation ionizes the Earth's upper atmosphere, the ionosphere, located from about 60km to 1000km above the Earth's surface.The ionization process in the ionosphere produces ions and free electrons. These electrons perturb the propagation of the GNSS (Global Navigation Satellite System) signals by inducing a so-called ionospheric delay.
See http://stce.be/newsletter/GNSS_final.pdf for some more explanations; for more information, see https://gnss.be/SpaceWeather
STCE trainings and presentations
Courses, seminars, presentations and events with the Sun-Space-Earth system and Space Weather as the main theme. We provide occasions to get submerged in our world through educational, informative and instructive activities.
* Oct 23-25, ESWW Space Weather Training by Umea University and STCE, Kiruna, Sweden - Full
* Oct 27-31, European Space Weather Week, Umea, Sweden - https://esww.eu/
* Nov 17-19, STCE Space Weather Introductory Course, Brussels, Belgium - register: https://events.spacepole.be/event/217/ - Full
* Feb 9-11, 2026, STCE Space Weather Introductory Course, Brussels, Belgium - register: https://events.spacepole.be/event/255/
* Mar 16-18, 2026, STCE course: Role of the ionosphere and space weather in military communications, Brussels, Belgium - register: https://events.spacepole.be/event/258/
* Apr 20-21, 2026, STCE cursus: inleiding tot het ruimteweer, Brussels, Belgium - register: https://events.spacepole.be/event/260/
* Mar 23, 2026, STCE lecture: From physics to forecasting, Space Weather course, ESA Academy, Redu, Belgium
* Jun 15-17, 2026, STCE Space Weather Introductory Course, Brussels, Belgium - register: https://events.spacepole.be/event/256/
* Oct 12-14, 2026, STCE Space Weather Introductory Course, Brussels, Belgium - register: https://events.spacepole.be/event/257/
* Nov 23-25, 2026, STCE course: Role of the ionosphere and space weather in military communications, Brussels, Belgium - register: https://events.spacepole.be/event/259/
* Dec 7-9, 2026, STCE Space Weather Introductory Course for Aviation, Brussels, Belgium - register: https://events.spacepole.be/event/262/
To register for a course and check the seminar details, navigate to the STCE Space Weather Education Center: https://www.stce.be/SWEC
If you want your event in the STCE newsletter, contact us: stce_coordination at stce.be
Website: https://www.stce.be/SWEC