- Table of Content
- 1.ICAO Space Wea...
- 2.Mighty NOAA 42...
- 3.Review of Sola...
- 4.Noticeable Sol...
- 5.PROBA2 Observa...
- 6.International ...
- 7.Geomagnetic Ob...
- 8.The SIDC Space...
- 9.Review of Iono...
- 10.Upcoming Activ...
2. Mighty NOAA 4246
3. Review of Solar and Geomagnetic Activity
4. Noticeable Solar Events
5. PROBA2 Observations (13 Oct 2025 - 19 Oct 2025)
6. International Sunspot Number by SILSO
7. Geomagnetic Observations in Belgium
8. The SIDC Space Weather Briefing
9. Review of Ionospheric Activity
10. Upcoming Activities
ICAO Space Weather User Workshop
Summary
On 20 October, ICAO (https://www.icao.int/ ) -the International Civil Aviation Organization- organised a Space Weather User Workshop on the provision and use of space weather information for international civil air navigation. The STCE contributed significantly.
Introduction
ICAO, the International Civil Aviation Organization, is a specialized agency of the United Nations that coordinates the principles and techniques of international air navigation. The STCE is member of the PECASUS consortium ((https://pecasus.eu/ ) that provides specific space weather (SWx) advisories for the benefit of civil aviation. On 20 October, the ICAO organised a Space Weather User Workshop gathering airlines, air traffic organisations, regulators and global space weather (SWx) centres at the Italian Air Force Headquarters in Rome, Italy. Its aim was to engage aviation stakeholders in discussions on the ICAO Space Weather Information Service (SWIS). The discussions focused on the operational use of SWx advisories for GNSS (Global Navigation Satellite Systems, such as GPS and Galileo), High Frequency communications (HF ; 3-30 MHz), and radiation, and on upcoming format changes to make the advisories more precise for flight operations.
STCE contributions
The STCE contributed in various ways.
- First of all, Yana Maneva (ROB/SIDC – STCE/PECASUS) gave a talk on the new SWIS education and guidance materials that are used in training and briefings for aviation users.
- STCE also provided operational lessons learned from its numerous PECASUS "On Duty Centre" roles and joined the multi-agency debrief of the May 2024 storm to translate impacts into user-relevant procedures.
- With partners, the STCE/SIDC is preparing tools and training for the polygon-based advisory areas (up to six corners) and related field updates (e.g. severity linked to polygons, DAYSIDE/NIGHTSIDE keywords,...) which are now planned for November 2025. More accurate advisory geometry and clearer metadata help dispatchers, pilots and ANSPs (Air Navigation Service Providers) to localise risk faster and choose workable routes, altitudes and HF frequencies (3-30 MHz). STCE will reflect these changes in its pilot guidance and forecaster workflows to keep aviation users aligned with the evolving ICAO SWIS.
Related links
- STCE/PECASUS: user's guide to space weather advisories for pilots (overview and training resource): https://www.stce.be/PECASUS_guide4pilots
- PECASUS service (global ICAO SWx centre led by FMI): https://pecasus.eu
- STCE tailored courses on space weather impacts on aviation: https://www.stce.be/SWEC, https://events.spacepole.be/category/4/
- Yana's talk and the ICAO flyer (both PDF) are available in the online version of this newsitem at https://www.stce.be/news/787/welcome.html

Mighty NOAA 4246
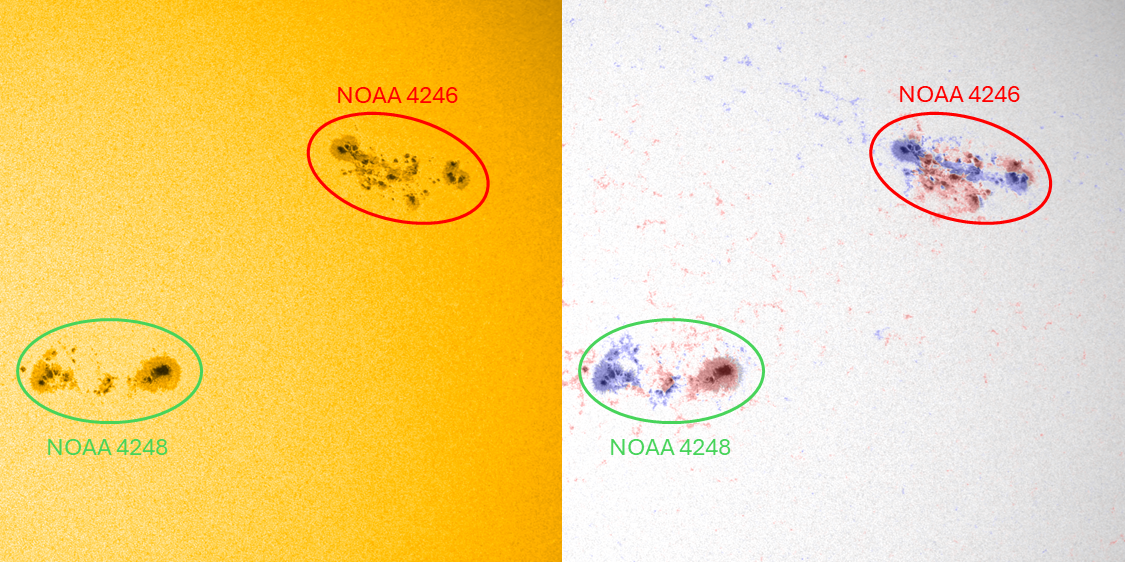
NOAA 4246 (SIDC active region 639) started to develop on 10 October into a large and complex active region. According to the SIDC space weather (SWx) forecaster (https://www.sidc.be/services/event-chains/sunspots ), this sunspot region reached the most complex classification both in white light (McIntosh ; Fkc) as in magnetograms (Mount Wilson ; Beta-Gamma-Delta). Both classifications are explained on the STCE SWx Classification page (https://www.stce.be/educational/classification ). The annotated SDO images (https://sdo.gsfc.nasa.gov/data/aiahmi/ ) underneath show NOAA 4246, i.e. the sunspot group in the upper right corner, in white light (left) and in magnetograms (right) with red indicating the positive polarity (magnetic field lines coming out of the solar surface) and blue the negative polarity (magnetic field lines returning into the solar surface). The image on the right actually has the magnetogram overlaid on the white light image, to highlight the correspondence between sunspots and their magnetic polarity. The still images are from 15 October at 04:00UTC, whereas the clip in the online version of this article (https://www.stce.be/news/786/welcome.html ) covers the period from 11 till 15 October at a cadence of 1 image per hour. For the 13-15 October period, there are are also zooms available for both NOAA 4246 and 4248.
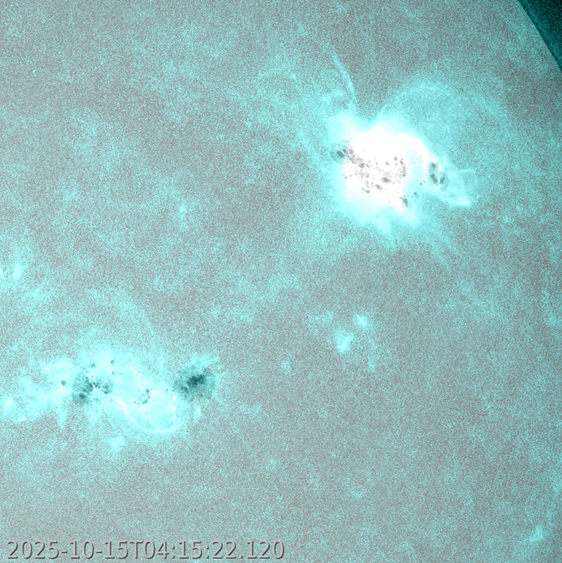
NOAA 4246 was the source of 27 M-class flares which it produced during its transit over the solar disk from 10 to 18 October, and while it was already a day behind the solar limb on 19 October. No X-class flares were recorded from this active region. This group now ranks number 6 in the list of most M-class (or stronger) producing active regions so far this solar cycle 25. The image underneath is an extreme ultraviolet (EUV) picture by SDO (AIA 131) overlaid on a white light image (SDO/HMI) and shows the strongest flare that NOAA 4246 produced: an M4.8 at 04:15UTC on 15 October. The online clip also includes an M3.7 at 07:18UTC produced by the same active region, just a few hours later. The blooming and diffraction patterns that can be seen in the imagery are instrumental (more information is in Note 1 of this STCE newsitem https://www.stce.be/news/499/welcome.html ). Some of the flares produced by NOAA 4246 during the period of 13-15 October were associated with coronal mass ejections (CMEs) that had an earth-directed component. These CMEs would eventually reach the earth environment causing minor to moderate geomagnetic storming on 18 and early 19 October.
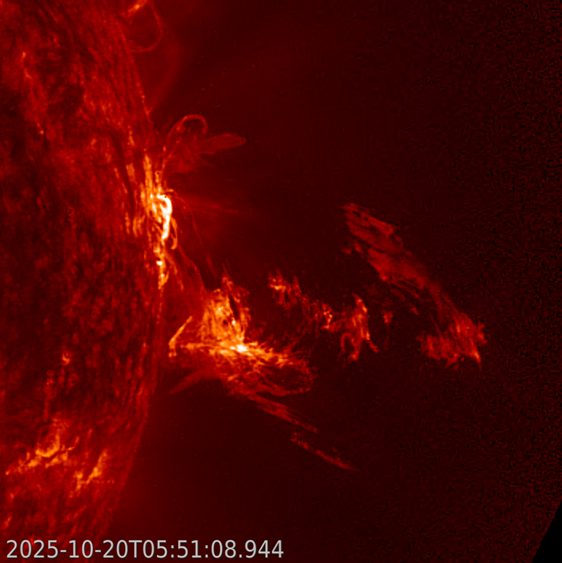
The sunspot region in the lower left corner of the white light images and magnetograms is NOAA 4248 (SIDC AR 621). Though large, it had magnetically a much simpler configuration than NOAA 4246. The region produced only 2 M-class flares, an M2 on 14 October and an M1 early on 20 October when the region was near the west limb. The EUV imagery underneath is from GOES/SUVI 304 (https://www.swpc.noaa.gov/products/goes-solar-ultraviolet-imager-suvi ) and shows the spectacular eruption at relatively cool temperatures of 80.000 degrees.
Review of Solar and Geomagnetic Activity
WEEK 1294 from 2025 Oct 13
Solar active regions and flares
Solar flaring activity was moderate to high over the week. There were 11 numbered regions on disk over the week, but many of these were magnetically simple. SIDC Sunspot Group 639 (NOAA Active Region 4246) was responsible for most of the flaring activity producing multiple M-class flares each day. This region increased in complexity from the start of the week and had magnetic type Beta-Gamma-Delta by October 14. The largest flare of the week from this region was an M4.8 flare (SIDC Flare 5780), peaking on October 15 at 04:15 UTC. This region rotated over the west limb on October 18 but continued to produce M-class flares from beyond the limb. SIDC Sunspot group 621 (NOAA Active Region 4248) was also a complex region and produced an M2.0 flare (SIDC Flare 5759) peaking on October 14 at 12:47 UTC.
Coronal mass ejections
Four Coronal Mass Ejections (CMEs) with possible earth-directed components were identified. The first CME (SIDC CME 579) was visible to the north in SOHO/LASCO-C2 data from 14:12 UTC October 13 and could be seen more clearly in STEREO-A COR2 data from 14:23 UTC. Two further CMEs (SIDC CME 580 and 581) were observed to the north in SOHO/LASCO-C2 and to the east in STEREO-A/COR2 imagery on October 15, associated with an M1.9 flare (SIDC Flare 5731) and an M1.2 flare (SIDC Flare 5740), respectively. These CMEs were mostly ahead of the Sun-Earth line but a glancing blow from a combination of these was predicted. Finally, a partial halo CME (SIDC CME 582) directed to the west was first detected in SOHO/LASCO-C2 data from 15:00 UTC on October 15 and was predicted to deliver a glancing blow at Earth.
Coronal holes
An extended negative polarity equatorial coronal hole (combined SIDC Coronal Hole 126) began to transit the central meridian on October 16.
Proton flux levels
The greater than 10 MeV proton flux was at background levels throughout the week.
Electron fluxes at GEO
The greater than 2 MeV electron flux measured by GOES 19 and 18 was above the 1000 pfu threshold between October 13 and October 17, due to the influence of the high-speed stream at the start of the week. The 24-hour electron fluence was at moderate levels at this time. From October 18 onwards, the 2 MeV electron flux reduced and remained below the 1000 pfu threshold for the rest of the week and the 24-hour electron fluence returned to nominal levels.
Solar wind
On October 13 and 14, the Earth was under the influence of the high-speed stream associated with SIDC Coronal Hole 116, which crossed the central meridian on October 08. The solar wind speed had a maximum speed near 800 km/s on October 13. From October 15, the influence of the high-speed stream began to wane and by October 17 the solar wind speed was around 400 km/s. On October 17, the interplanetary magnetic field increased from 6 nT to 12 nT at around 06:00 UTC, likely due to the influence of a glancing glow from one of the CMEs from October 13. During this time, the solar wind speed remained around 400 km/s. Further transient features in the magnetic field were observed on October 18 and 19, which are likely the combined influence arrival of CMEs from October 13 and 15. The magnetic field strength reached a maximum of 21 nT at 08:20 UTC on October 18. Bz had a minimum value of -12 nT at 09:31UTC on October 18. Bz was negative for a prolonged period between 15:15 UTC on October 18 and 03:00 UTC on October 19 with values of around -8 nT. Around this time, the solar wind speed gradually increased to values around 550 km/s where it remained till the end of the week, as the high-speed stream from SIDC Coronal Hole 126 began to influence the Earth.
Geomagnetism
Geomagnetic conditions reached active to minor storm conditions on October 13, due to the ongoing high-speed stream influence. Conditions reduced to mostly quiet to unsettled levels on October 15 to 17. From October 18, active to minor storm conditions were observed with one period of moderate storm levels globally (Kp 6), between 18:00 and 21:00 UTC on October 18, in response to the magnetic structures in the solar wind and the extended period of negative Bz, likely associated with the ICME arrivals. Locally, only minor storm conditions were observed (K Bel 5). The geomagnetic conditions then reduced to unsettled conditions by the end of the week on October 19.
Noticeable Solar Events
| DAY | BEGIN | MAX | END | LOC | XRAY | OP | 10CM | TYPE | Cat | NOAA |
| 13 | 0512 | 0526 | 0539 | N4E8 | M1.9 | SN | III/2 | 59 | 4248 | |
| 13 | 0459 | 0526 | 0545 | N22W17 | M1.9 | 1 | III/2 | 58 | 4246 | |
| 13 | 0855 | 0919 | 0931 | N22W17 | M2.7 | 1F | 58 | 4246 | ||
| 13 | 1304 | 1318 | 1339 | N23W20 | M1.2 | 1F | II/2III/2 | 58 | 4246 | |
| 14 | 0035 | 0041 | 0044 | N25W25 | M2.0 | SF | 58 | 4246 | ||
| 14 | 1238 | 1247 | 1256 | N6W7 | M2.0 | 1 | 59 | 4248 | ||
| 14 | 2028 | 2036 | 2045 | M3.1 | 58 | 4246 | ||||
| 15 | 0349 | 0415 | 0436 | N24W41 | M4.8 | 2 | CTM/1 | 58 | 4246 | |
| 15 | 0705 | 0718 | 0726 | N24W41 | M3.7 | 1N | III/2 | 58 | 4246 | |
| 15 | 1401 | 1410 | 1441 | M1.1 | III/2 | 58 | 4246 | |||
| 15 | 2155 | 2228 | 2305 | M2.7 | 58 | 4246 | ||||
| 15 | 2337 | 2345 | 2352 | N23W57 | M2.4 | S | 58 | 4246 | ||
| 16 | 0017 | 0021 | 0024 | N23W57 | M1.1 | S | 58 | 4246 | ||
| 16 | 1353 | 1408 | 1422 | N21W67 | M1.3 | SF | 58 | 4246 | ||
| 16 | 1900 | 1916 | 1936 | N22W68 | M1.1 | SF | 58 | 4246 | ||
| 16 | 2312 | 2319 | 2328 | N22W68 | M1.0 | SF | 58 | 4246 | ||
| 17 | 0115 | 0128 | 0140 | N24W66 | M1.5 | 1F | III/2 | 58 | 4246 | |
| 17 | 1227 | 1245 | 1301 | M1.1 | VI/2 | 58 | 4246 | |||
| 17 | 1422 | 1432 | 1436 | N22W75 | M1.0 | SF | 58 | 4246 | ||
| 17 | 1614 | 1632 | 1647 | M1.3 | 58 | 4246 | ||||
| 17 | 1647 | 1658 | 1708 | M1.2 | 58 | 4246 | ||||
| 17 | 1855 | 1905 | 1912 | N22W78 | M1.1 | S | 58 | 4246 | ||
| 18 | 0023 | 0040 | 0049 | M1.0 | 58 | 4246 | ||||
| 18 | 0226 | 0239 | 0247 | M1.1 | 58 | 4246 | ||||
| 18 | 0632 | 0639 | 0644 | M1.2 | 58 | 4246 | ||||
| 18 | 0649 | 0658 | 0704 | M1.3 | 58 | 4246 | ||||
| 18 | 1037 | 1051 | 1059 | M1.5 | 58 | 4246 | ||||
| 19 | 0146 | 0156 | 0204 | M1.0 | 58 | 4246 | ||||
| 19 | 2003 | 2015 | 2026 | M1.8 | 58 | 4246 |
| LOC: approximate heliographic location | TYPE: radio burst type |
| XRAY: X-ray flare class | Cat: Catania sunspot group number |
| OP: optical flare class | NOAA: NOAA active region number |
| 10CM: peak 10 cm radio flux |
PROBA2 Observations (13 Oct 2025 - 19 Oct 2025)
Solar Activity
Solar flare activity was at a moderate level during the week.
In order to view the activity of this week in more detail, we suggest to go to the following website from which all the daily (normal and difference) movies can be accessed: https://proba2.oma.be/ssa
This page also lists the recorded flaring events.
A weekly overview movie (SWAP week 812) can be found here: https://proba2.sidc.be/swap/data/mpg/movies/weekly_movies/weekly_movie_2025_10_13.mp4.
Details about some of this week's events can be found further below.
If any of the linked movies are unavailable they can be found in the P2SC movie repository here: https://proba2.oma.be/swap/data/mpg/movies/.
Wednesday October 15
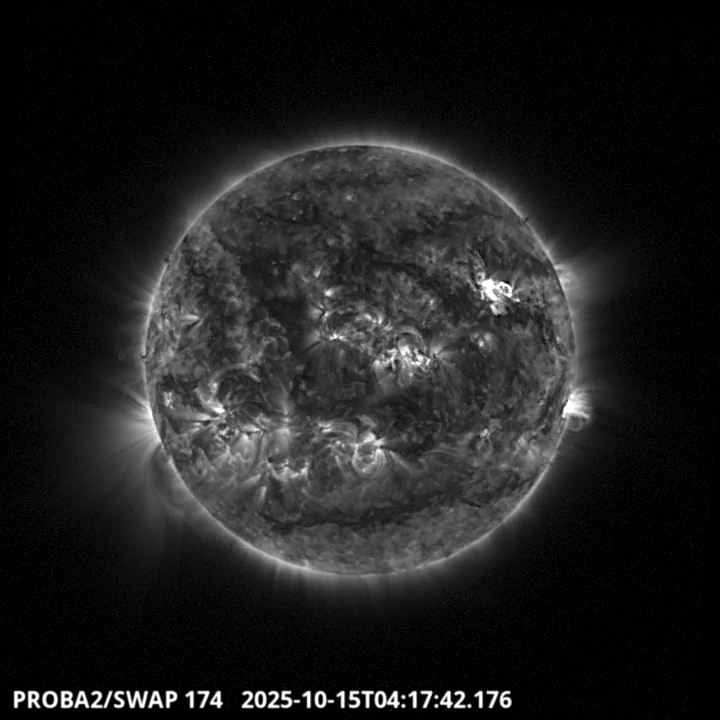
The largest flare of this week was an M4.8, and it was observed by LYRA (top panel) and SWAP (bottom panel). The flare peaked on 2025-Oct-15 at 04:15 UT and occurred in the north-western quadrant of the Sun, originating from active region NOAA4246 (SIDC 639).
Find a SWAP movie of the event here: https://proba2.sidc.be/swap/movies/20251015_swap_movie.mp4.
International Sunspot Number by SILSO
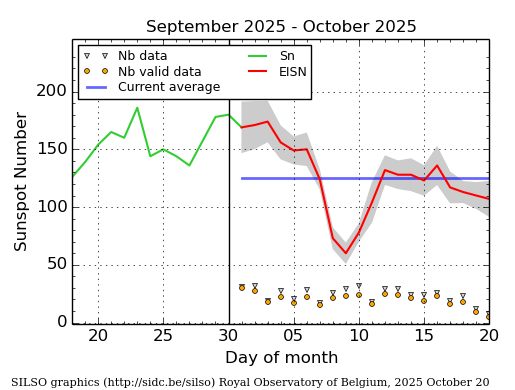
The daily Estimated International Sunspot Number (EISN, red curve with shaded error) derived by a simplified method from real-time data from the worldwide SILSO network. It extends the official Sunspot Number from the full processing of the preceding month (green line), a few days more than one solar rotation. The horizontal blue line shows the current monthly average. The yellow dots give the number of stations that provided valid data. Valid data are used to calculate the EISN. The triangle gives the number of stations providing data. When a triangle and a yellow dot coincide, it means that all the data is used to calculate the EISN of that day.
Geomagnetic Observations in Belgium
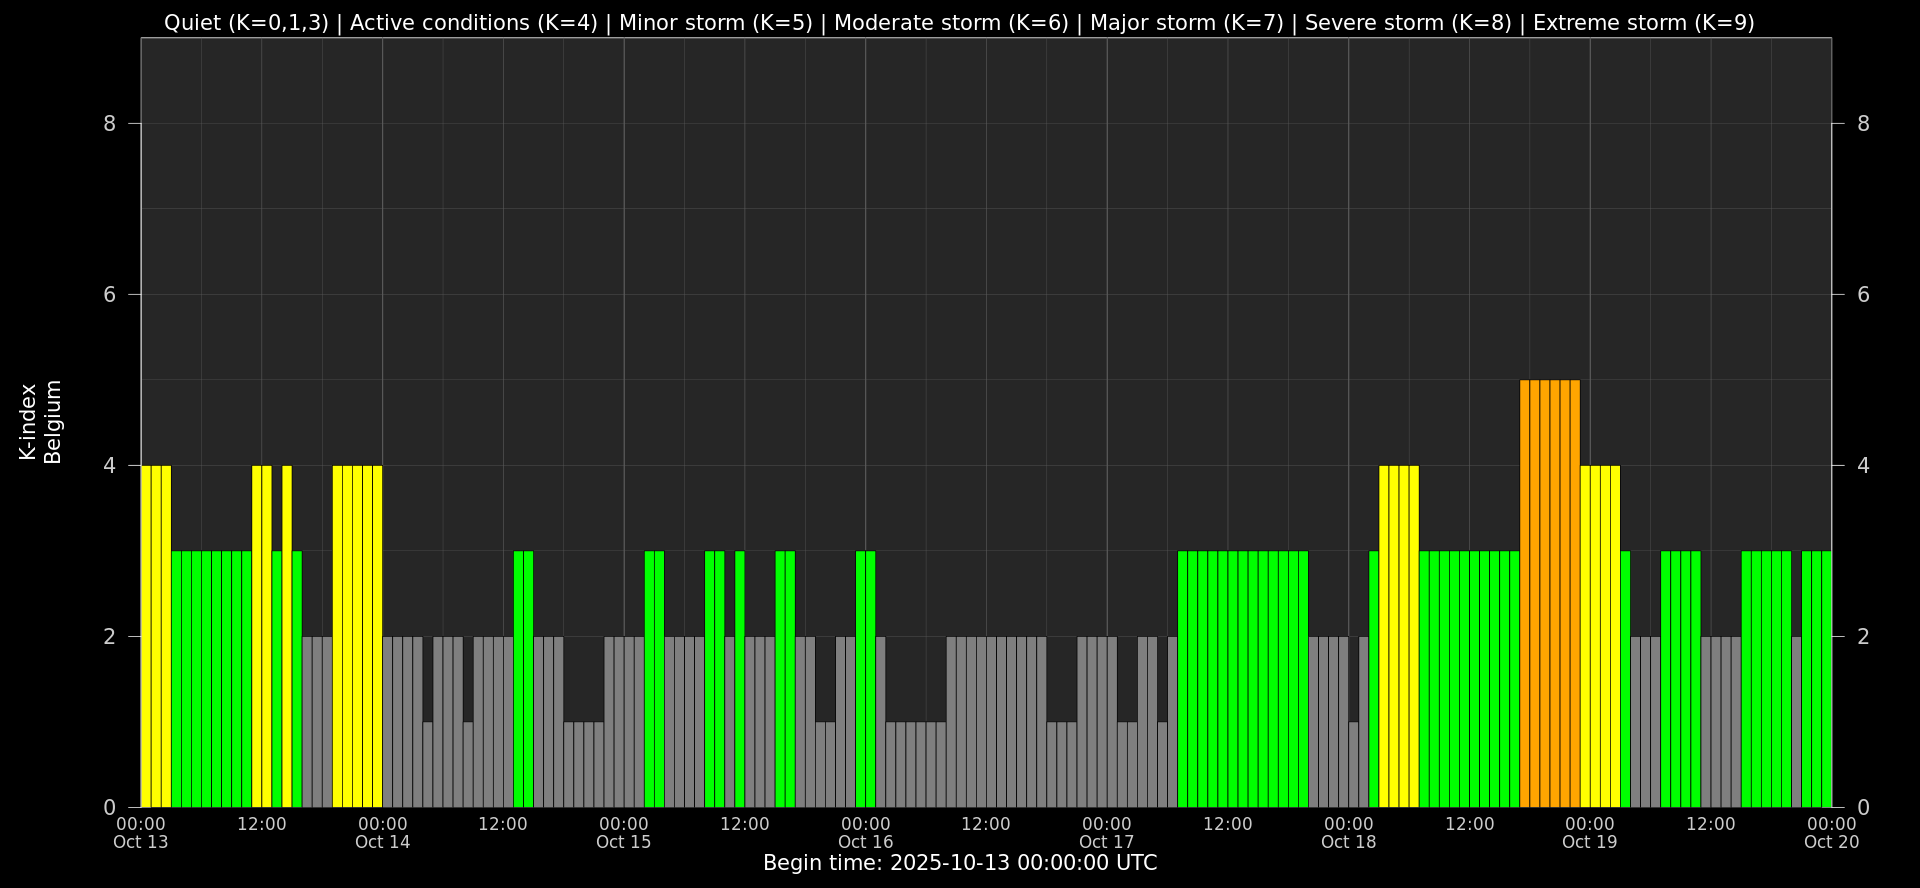
Local K-type magnetic activity index for Belgium based on data from Dourbes (DOU) and Manhay (MAB). Comparing the data from both measurement stations allows to reliably remove outliers from the magnetic data. At the same time the operational service availability is improved: whenever data from one observatory is not available, the single-station index obtained from the other can be used as a fallback system.
Both the two-station index and the single station indices are available here: http://ionosphere.meteo.be/geomagnetism/K_BEL/
The SIDC Space Weather Briefing
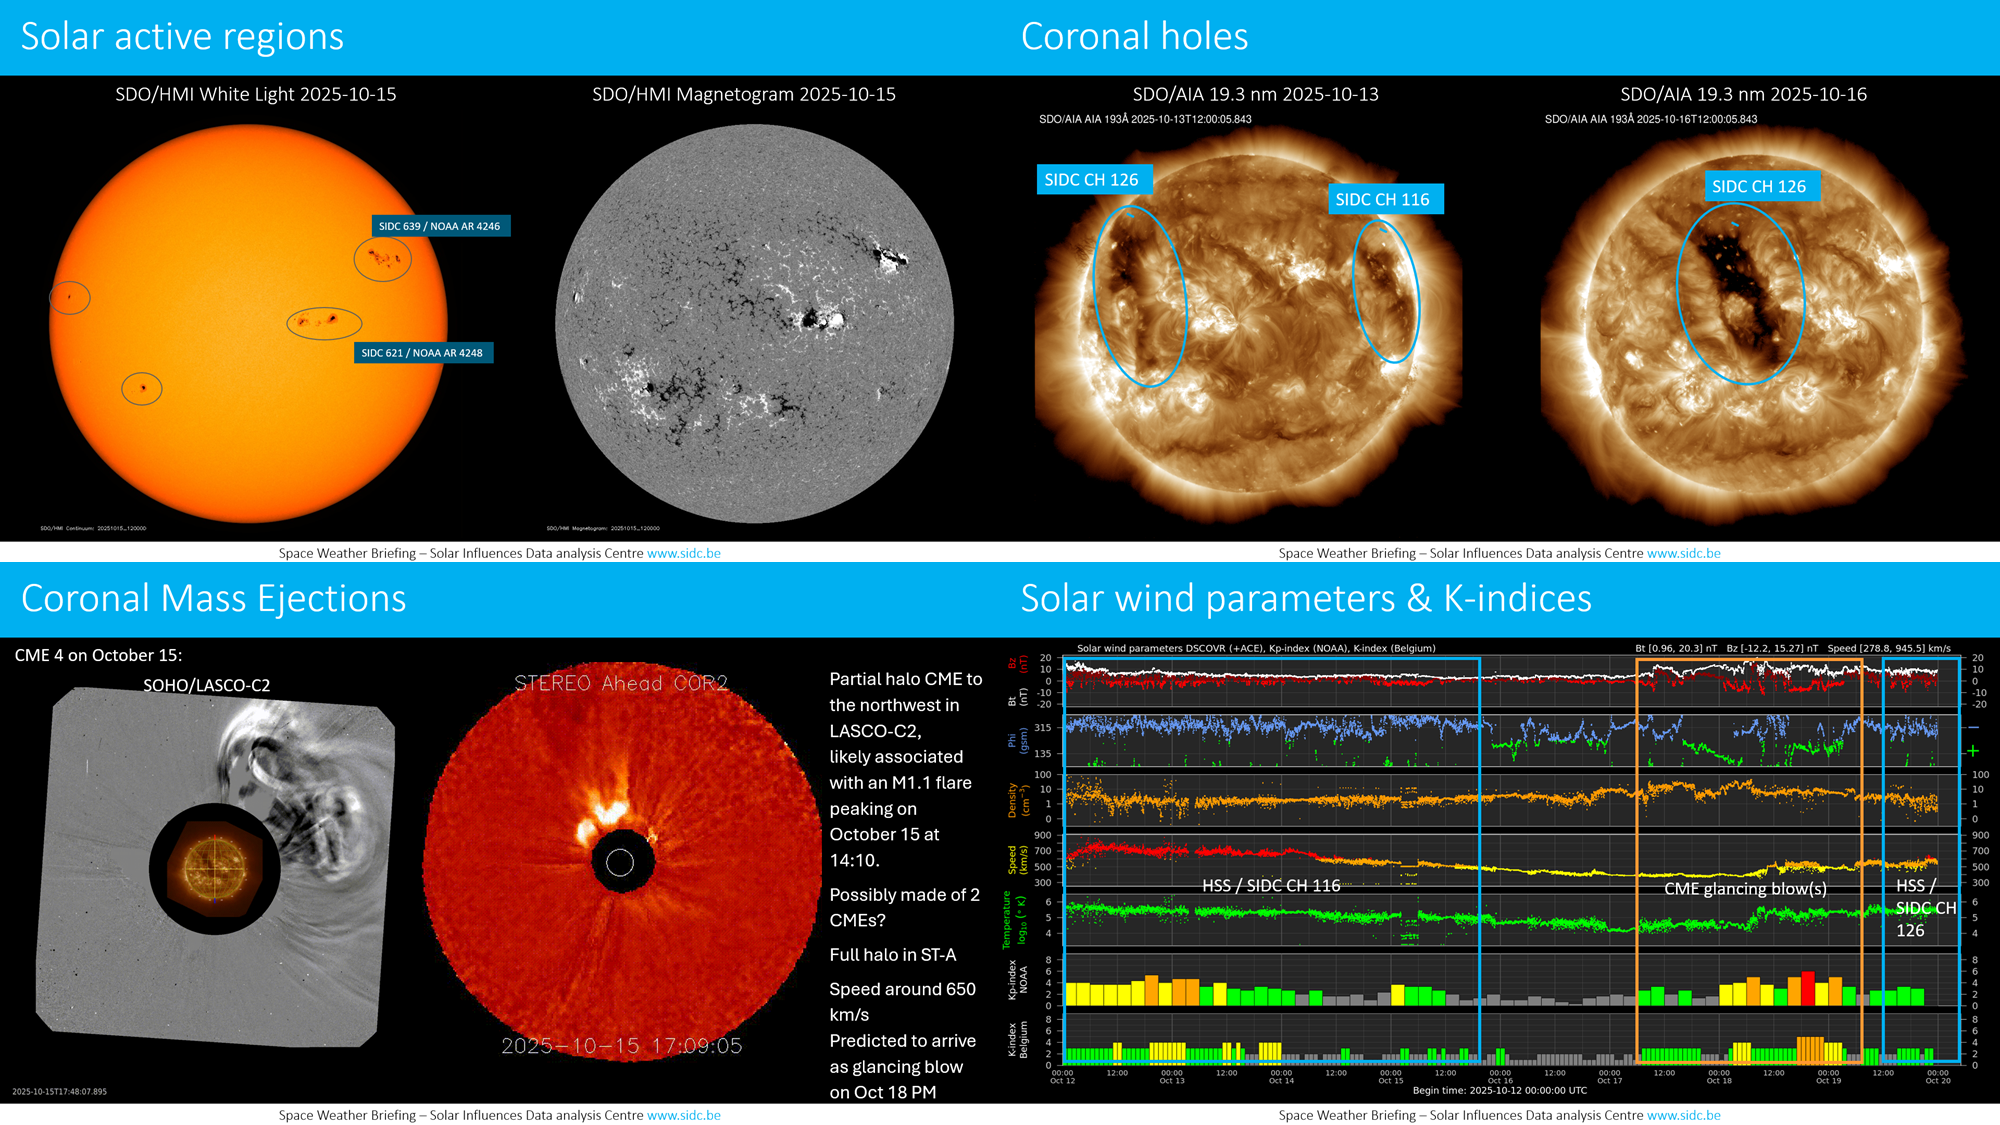
The forecaster on duty presented the SIDC briefing that gives an overview of space weather from 13 till 19 October.
The pdf of the presentation can be found here: https://www.stce.be/briefings/20251020_SWbriefing.pdf
Review of Ionospheric Activity


VTEC time series at 3 locations in Europe from 13 Oct 2025 till 19 Oct 2025
The top figure shows the time evolution of the Vertical Total Electron Content (VTEC) (in red) during the last week at three locations:
a) in the northern part of Europe(N 61deg E 5deg)
b) above Brussels(N 50.5deg, E 4.5 deg)
c) in the southern part of Europe(N 36 deg, E 5deg)
This top figure also shows (in grey) the normal ionospheric behaviour expected based on the median VTEC from the 15 previous days.
The time series below shows the VTEC difference (in green) and relative difference (in blue) with respect to the median of the last 15 days in the North, Mid (above Brussels) and South of Europe. It thus illustrates the VTEC deviation from normal quiet behaviour.
The VTEC is expressed in TECu (with TECu=10^16 electrons per square meter) and is directly related to the signal propagation delay due to the ionosphere (in figure: delay on GPS L1 frequency).
The Sun's radiation ionizes the Earth's upper atmosphere, the ionosphere, located from about 60km to 1000km above the Earth's surface.The ionization process in the ionosphere produces ions and free electrons. These electrons perturb the propagation of the GNSS (Global Navigation Satellite System) signals by inducing a so-called ionospheric delay.
See http://stce.be/newsletter/GNSS_final.pdf for some more explanations; for more information, see https://gnss.be/SpaceWeather
Upcoming Activities
Courses, seminars, presentations and events with the Sun-Space-Earth system and Space Weather as the main theme. We provide occasions to get submerged in our world through educational, informative and instructive activities.
* Oct 23-25, ESWW Space Weather Training by Umea University and STCE, Kiruna, Sweden - Full
* Oct 27-31, European Space Weather Week, Umea, Sweden - https://esww.eu/
* Nov 17-19, STCE Space Weather Introductory Course, Brussels, Belgium - register: https://events.spacepole.be/event/217/ - Full
* Feb 9-11, 2026, STCE Space Weather Introductory Course, Brussels, Belgium - register: https://events.spacepole.be/event/255/
* Mar 16-18, 2026, STCE course: Role of the ionosphere and space weather in military communications, Brussels, Belgium - register: https://events.spacepole.be/event/258/
* Apr 20-21, 2026, STCE cursus: inleiding tot het ruimteweer, Brussels, Belgium - register: https://events.spacepole.be/event/260/
* Mar 23, 2026, STCE lecture: From physics to forecasting, Space Weather course, ESA Academy, Redu, Belgium
* Jun 15-17, 2026, STCE Space Weather Introductory Course, Brussels, Belgium - register: https://events.spacepole.be/event/256/
* Oct 12-14, 2026, STCE Space Weather Introductory Course, Brussels, Belgium - register: https://events.spacepole.be/event/257/
* Nov 23-25, 2026, STCE course: Role of the ionosphere and space weather in military communications, Brussels, Belgium - register: https://events.spacepole.be/event/259/
* Dec 7-9, 2026, STCE Space Weather Introductory Course for Aviation, Brussels, Belgium - register: https://events.spacepole.be/event/262/
To register for a course and check the seminar details, navigate to the STCE Space Weather Education Center: https://www.stce.be/SWEC
If you want your event in the STCE newsletter, contact us: stce_coordination at stce.be