- Table of Content
- 1.NOAA 4274's re...
- 2.A solar promin...
- 3.Review of spac...
- 4.PROBA2 Observa...
- 5.International ...
- 6.Noticeable Sol...
- 7.Geomagnetic Ob...
- 8.The SIDC Space...
- 9.Review of Iono...
- 10.STCE training ...
2. A solar prominence hovers over the Sun
3. Review of space weather
4. PROBA2 Observations
5. International Sunspot Number by SILSO
6. Noticeable Solar Events
7. Geomagnetic Observations in Belgium
8. The SIDC Space Weather Briefing
9. Review of Ionospheric Activity
10. STCE training courses and seminars
NOAA 4274's report card
Over the last 2 weeks, eruptions from NOAA 4274 (SIDC Sunspot Group 687) have determined space weather conditions. This active region produced no less than 5 X-class flares, amply discussed in related STCE newsitems (https://www.stce.be/news ). So, it seems time to provide an overview of the eruptions and associated characteristics. Please note that some of these numbers are preliminary (e.g. Dst index), or have been somewhat averaged (e.g. the GLE % of the neutron monitors). Some of the material is available in the online version of this newsitem at https://www.stce.be/news/792/welcome.html
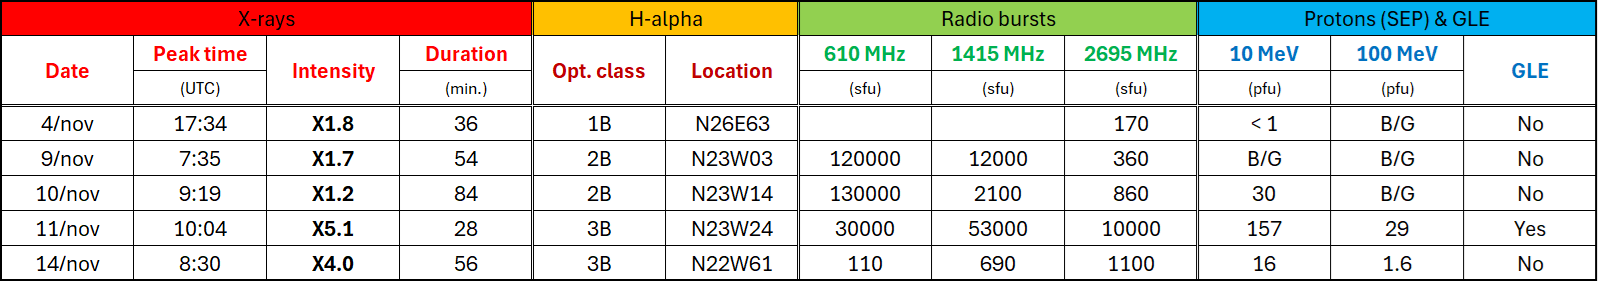
Table 1
- In the first table, the first 4 columns provide details of the time, intensity and duration of the 5 X-class flares (GOES). The strongest flare was the X5.1 event on 11 November, but the X-class flare with the longest duration took place on 10 November and lasted 84 minutes, a so-called long-duration event (LDE).
- The optical class (NOAA/SWPC) provides info on the size (area) and brightness of the eruption in H-alpha, as explained at https://www.stce.be/educational/classification#optical "SF" is the smallest and faintest type of flare, "4B" the largest and brightest event. Also the location of the flare can be deduced from H-alpha observations, which is not possible from GOES x-ray flux data. NOAA 4274 was located in the northern (N) solar hemisphere, and moved from the eastern (E) into the western (W) solar hemisphere.
- The next 3 columns provide information on the intensity of any associated radio burst (NOAA/USAF). The 3 frequencies displayed were chosen for various reasons. GNSS frequencies (Global Navigation Satellite Systems, such as GPS or Galileo) may be affected if strong radio bursts occur near 1415 MHz, in particular if the intensity is over 10000 sfu. The frequency of 2695 MHz was chosen because it is close to 2800 MHz, a frequency corresponding to the 10.7 cm radio flux which is often used as an input parameter for the calculation of the satellite drag. Finally, the 610 MHz frequency was chosen because the highest intensities during the eruptions from NOAA 4274 were recorded at this frequency.
- The last 3 columns provide particle fluxes for protons with energies greater than 10 MeV and 100 MeV, and if a Ground Level Enhancement (GLE) was recorded. These fluxes concern the peaks induced by the solar eruptions (SEP - Solar Energetic Particles event), thus not caused by the passage of the associated coronal mass ejections. Then they are called ESP ( Energetic Storm Particle event) which -if any- are given in Table 2. See this STCE newsitem (https://www.stce.be/news/733/welcome.html ) for more details on SEP and ESP.
- The GLE associated with the X5.1 flare is the largest of the 5 GLEs recorded so far this solar cycle, with the greater than 500 MeV proton flux, i.e. the driver behind these enhancements, being a factor 7 to 10 larger than the flux from the previous GLEs. The resulting percentage increase in neutron counts was up to 75%-150% at some locations (chart online), compared to only about 10% from the second strongest GLE on 11 May last year (see the website of the University of Oulu at https://gle.oulu.fi/#/ ). We have to go back until 13 December 2006 to find a GLE of similar intensity.
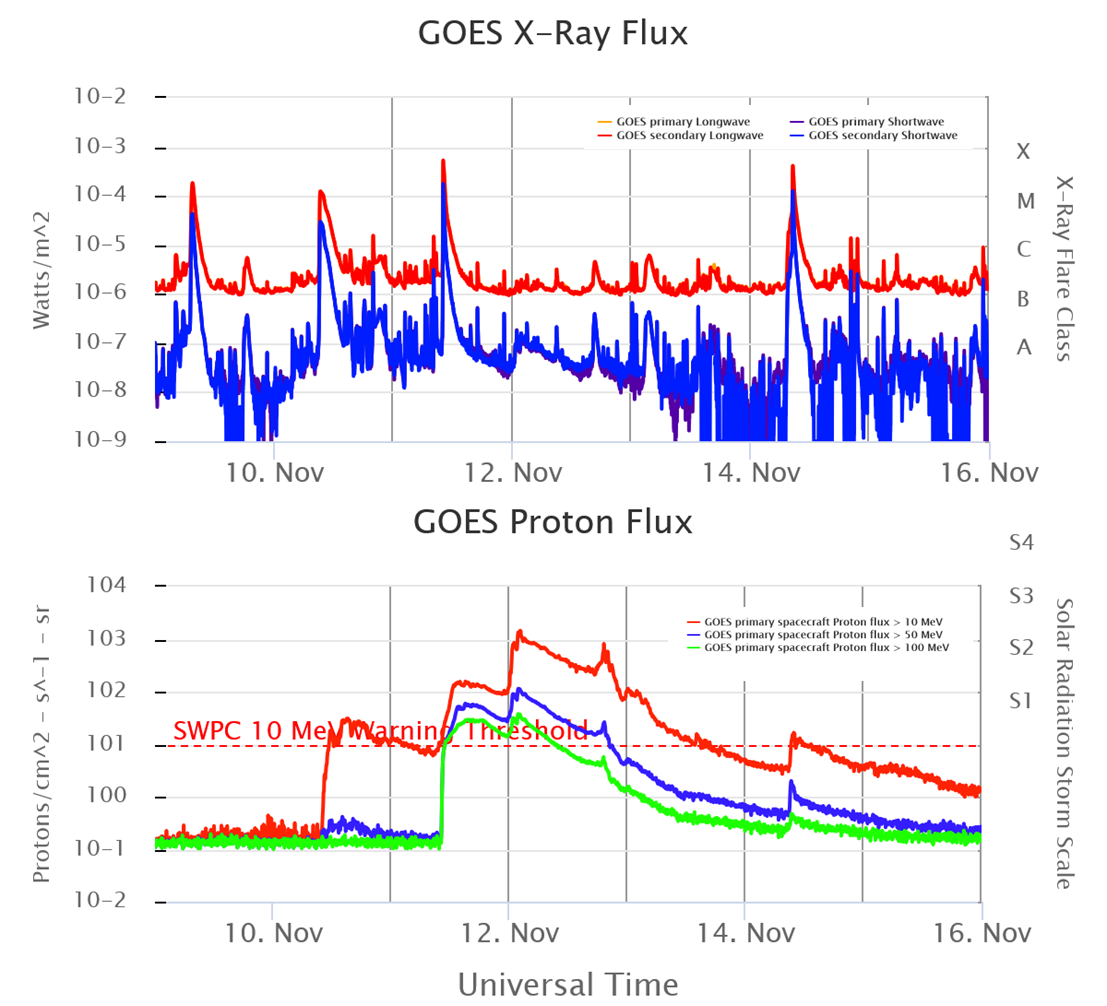
The table is followed by a plot combining the x-ray evolution with the proton flux, covering the period from 9 to 15 November (SWPD/SWx TREC). The proton flux increases on 10, 11 and 14 November are associated with the X-class flares (SEP), whereas the brief spikes early and late on 12 November (ESP) are due to the passage of the CMEs related to the 10 and 11 November X-class events.
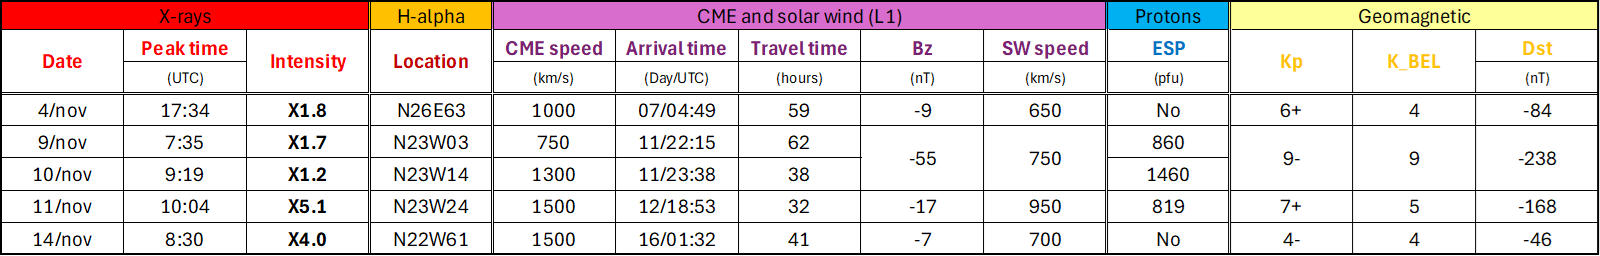
Table 2
- In the second table, the first 4 columns repeat info from the X-ray and H-alpha events, just to make clear which X-class flares we are talking.
- The next 5 columns provide info over the associated CME: its speed as it departed from the Sun (SIDC - https://www.sidc.be/index.php), and the solar wind characteristics as this interplanetary CME passed the L1 point (location of DSCOVR and ACE). These include the time of arrival (UTC), travel time (hours), the most negative excursion of Bz (the north-south component of the interplanetary magnetic field), and the (averaged) maximum speed. There was no Fast Transit Event observed, i.e. no CME covered the Sun-earth distance in less than 24 hours. The next column provides information on the greater than 10 MeV proton flux induced by the passage of the CME ("ESP").
- The last 3 columns provide geomagnetic information: the maximum observed Kp and the local K index for Belgium (K_BEL), as well as the minimum observed Dst (see the STCE SWx classification page at https://www.stce.be/educational/classification#geomag for more information on these indices).
- Note that the Bz value of -55 nT that eventually would result in the severe geomagnetic storm on 12 November (Kp = 9-) is slightly stronger than the -50 nT recorded during the May 2024 storm. However, the latter storm remained much longer at this value, and was thus able to create an extremely severe geomagnetic storm (Kp = 9o). The solar wind speed of 950 km/s is unusually high -even for a CME passing the Earth- and is comparable to the speed of the May 2024 CME. The Dst index reached a minimum value of only -238 nT, much weaker than the -406 nT registered during the May 2024 storm.
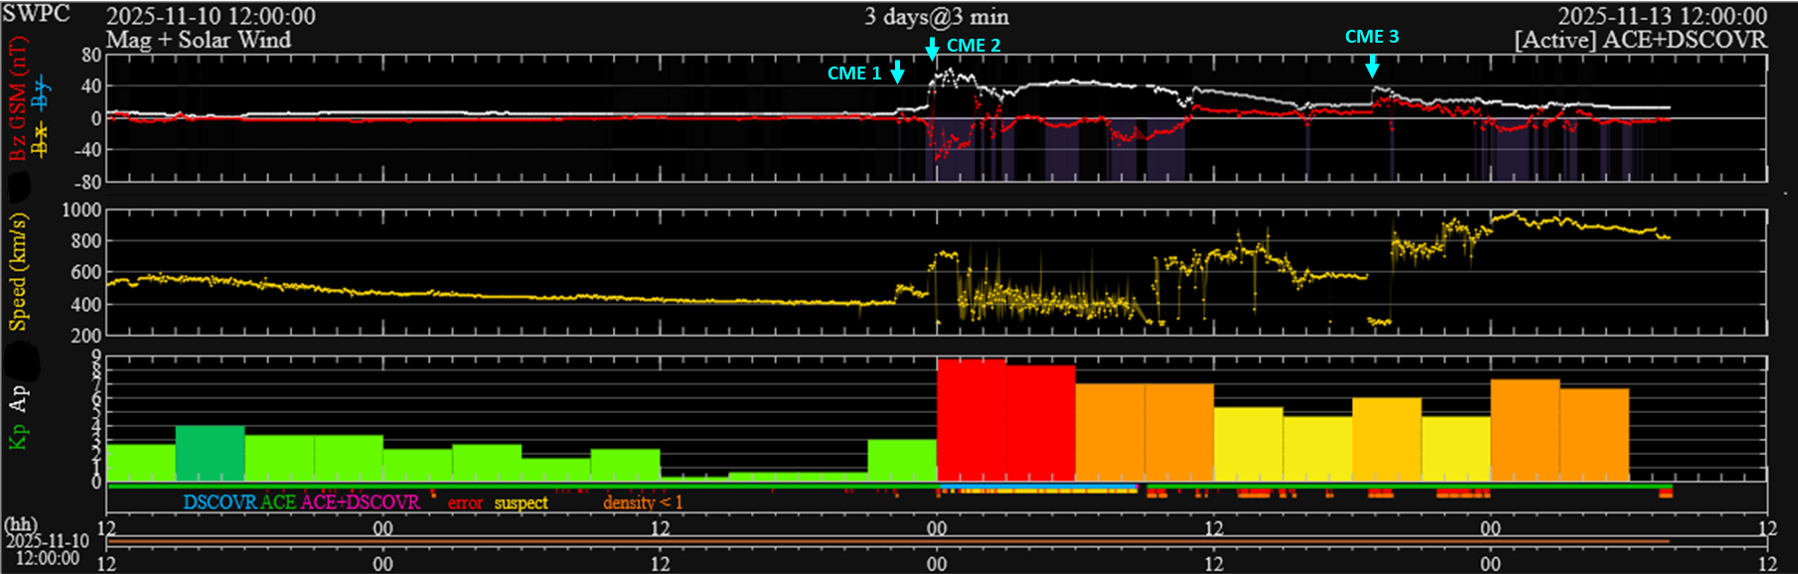
The evolution of the solar wind parameters and Kp index is shown in the charts underneath. The coronal mass ejection (CME) related to the X5 flare from 11 November arrived at the DSCOVR spacecraft on 12 November at 18:53 UTC ("CME3" in the annotated chart underneath). The solar wind speed increased to values around 950 km/s, significantly faster than "CME2" which was the source of the severe geomagnetic storm (Kp = 9-) early on 12 November. However, the magnetic field strength of "CME3" was much weaker (39 nT vs 61 nT ; white curve) and its north-south orientation (Bz ; red curve) was mainly positive, preventing the build-up of a (extremely) severe storm. Eventually, Bz would reach -17 nT (CME 2: -55 nT !!) for a brief 2-hour period early on 13 November, resulting in "only" a strong geomagnetic storm (Kp = 7+ ; bottom panel of the chart).
Impacts
- Aurora were observed well away from their natural habitat, i.e. the northern lights were observed at middle and southern latitudes. Reports from red aurora came from Florida and Texas in the United States, and as far south as Catalonia (Spain), Austria and Switzerland in Europe. Most reports emphasized that the aurora were not as splendid as during the May 2024 storm.
- HF communications were severely disturbed over Iceland early on 12 November, coinciding with the highest proton fluxes and the main phase of the severe geomagnetic storm.
- The launch of the New Glenn mission was delayed by 1 day in view of the ongoing space weather activity and the expected powerful hit by the CME related to the X5 flare (screenshot online).
- Sensors on board some spacecraft got affected by the inclement space weather. The sensor on board GOES measuring the energetic electrons got affected by the GLE (chart online). This effect was expected by NOAA/SWPC as they write on the related website "The greater than 2 MeV electron channel may be contaminated by solar energetic protons. Starting with GOES-16, this effect is due to protons with energies above several hundred MeV and is weaker than it was on earlier GOES satellites. However, as of December 2024, this effect has not been quantified during a large S3 or S4 solar proton event." It looks like the 11 November GLE offers a fine case for study. Also the sensor recording solar wind speed, density and temperature on board the DSCOVR and ACE spacecraft was affected soon after the second, most powerful CME struck late on 11 November. SOHO/CELIAS solar wind data were not affected (https://space.umd.edu/pm/ ).
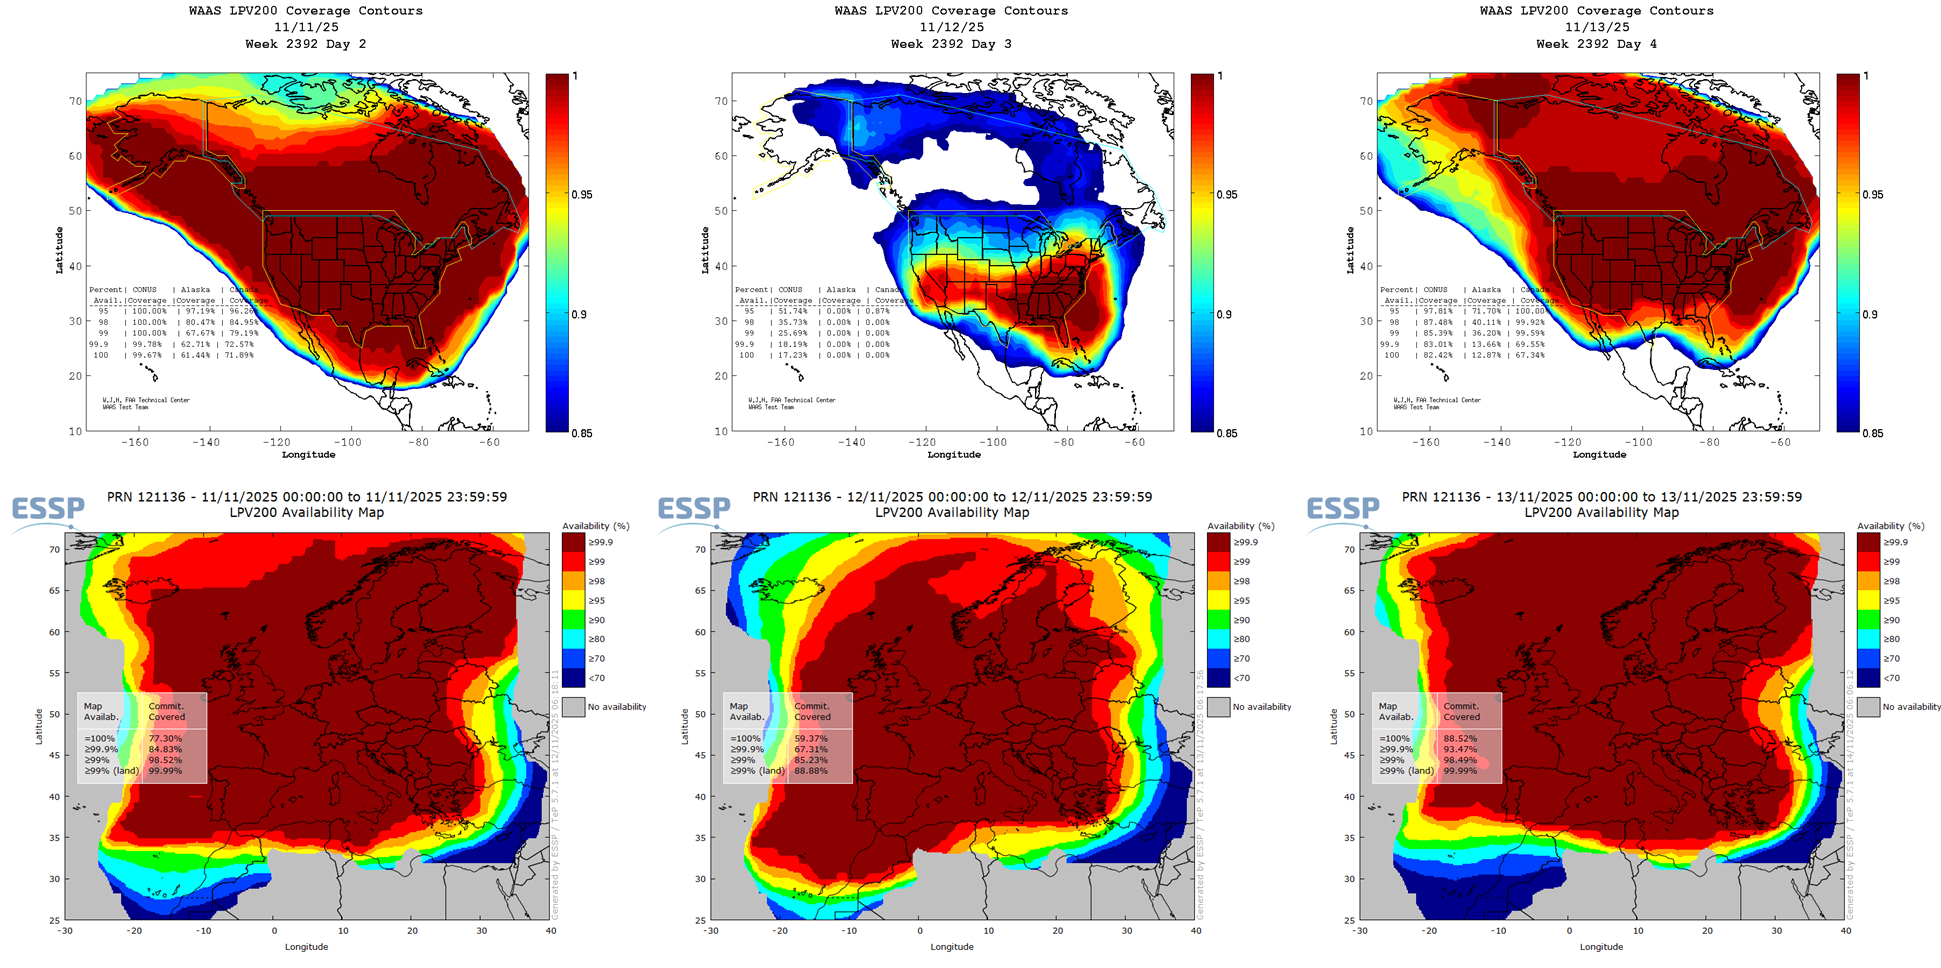
- Certain GNSS applications (Global Navigation Satellite Systems, such as GPS and Galileo) were disturbed. This was for example reflected in the reduced availability of some GNSS-based aviation tools, such as LPV200 - the vertically-guided landing approach aid for airplanes to as low as 200 feet (61 meters) above ground level (WAAS , Canada and United States , http://www.nstb.tc.faa.gov/index.htm ; EGNOS , Europe , https://egnos-user-support.essp-sas.eu/new_egnos_ops/index.php ; STCE newsitem https://www.stce.be/news/616/welcome.html for more info). A brown colour is good availability, blue means significantly degraded. The effect was especially pronounced for WAAS, as can be seen in the top row of the graph underneath covering 11 to 13 November. However, the perturbation was not as strong as during the May and October 2024 storms when WAAS was not available at all for several hours. Standing-by for reports on impacts such as on farmers or drones.
A solar prominence hovers over the Sun
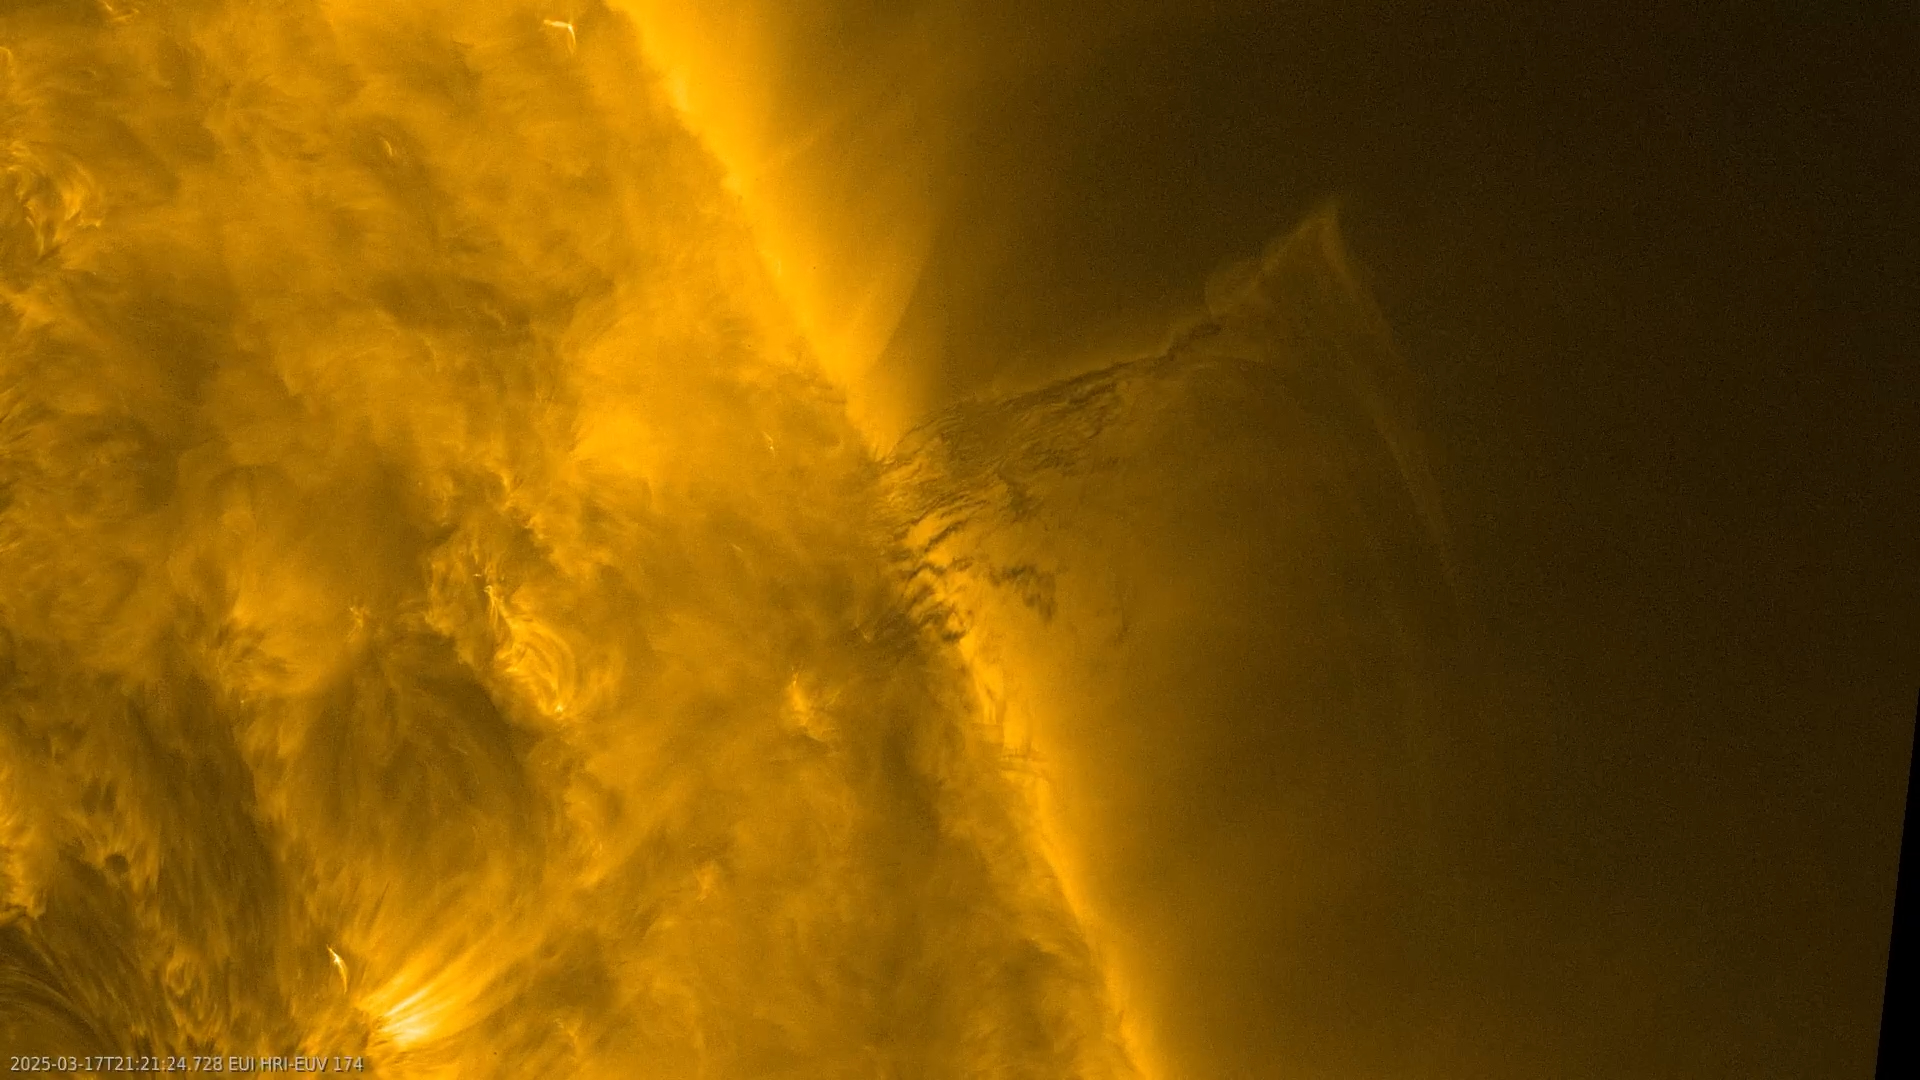
The Sun is always mesmerising to watch, but Solar Orbiter captured a special treat on camera: a dark prominence sticking out from the side of the Sun. The dark-looking material is dense plasma trapped by the Sun's complex magnetic field. Solar prominences and filaments extend for tens of thousands of kilometres, several times the diameter of Earth.
Solar Orbiter recorded this video with its Extreme Ultraviolet Imager (EUI) instrument on 17 March 2025. At the time, the spacecraft was around 63 million km from the Sun, similar to planet Mercury.
Solar Orbiter is a space mission of international collaboration between ESA and NASA. The EUI instrument is led by the Royal Observatory of Belgium (ROB).
Full story on: https://www.esa.int/ESA_Multimedia/Videos/2025/11/A_solar_prominence_hovers_over_the_Sun
Review of space weather
Solar Active Regions (ARs) and flares
Solar activity was high and eased from 15 Nov to low and moderate level. The main source was SIDC Sunspot Group 687 (NOAA Active Region 4274), which produced the X1.2 flare on 10 Nov, the X5.1 flare on 11 Nov, and the X4.1 flare on 14 Nov, together with several M-class flares including an M1.3 flare late on 14 Nov and an M3.1 flare on 16 Nov. By 16 Nov, SIDC Sunspot Group 687 pasted the west limb near N24W94. Additional C-class activity came from SIDC Sunspot Groups 689 and 690.
Coronal mass ejections
Multiple Coronal Mass Ejections (CME) were observed associated with the SIDC Sunspot Group 687 (NOAA Active Region 4274) flaring activity.
A halo CME followed the X1.2 flare (SIDC CME 559) on 10 Nov.
A halo CME (SIDC CME 600) was associated with the X5.1 flare on 11 Nov. A type II radio burst was observed on 11 Nov around 10:40 UTC.
A fast CME was linked to the X4.1 flare on 14 Nov.
Coronal Holes
SIDC Coronal Hole 126, a negative-polarity structure at mid-latitude in the northern hemisphere, crossed the central meridian on 13 to 14 Nov and moved onto to the western part of the solar disk.
Proton flux levels
A greater than 10 MeV proton event began at 11:30 UTC on 10 Nov following the X1.2 flare and remained above 10 pfu through 11 Nov, with higher energy channels showing prompt responses and a hard spectrum during the strongest activity.
Fluxes decreased on 13 Nov toward the threshold, then a new but relatively weak enhancement followed the X4.1 flare on 14 Nov with grater than 10 MeV again near or slightly above 10 pfu.
By 15 to 16 Nov the grater than 10 MeV flux had fallen below the threshold and trended toward the background.
Electron fluxes at GEO
The grater than 2 MeV electron flux stayed mostly below the 1000 pfu threshold, hovering near it at times around 11 Nov, then remained below through the end of the week. The 24-hour fluence was generally at normal to moderate levels and showed only brief variations related to the CME passages and the onset of a high-speed flow.
Solar wind at L1
The solar wind was moderately fast on 10 Nov.
Late on 11 Nov, two shocks associated with halo CMEs passed the L1 point. These shocks made the solar wind speed to rise to 720 km/s and the total magnetic field to rise to about 63 nT with intervals of strong southward Bz.
On 12 Nov around 19:00UTC, another shock was seen in the in situ solar wind data. This shock was linked to the 11 Nov halo CME. The solar wind speed was briefly near 920 km/s, Bt near 40 nT, and Bz reaching about -16 nT.
The wind gradually relaxed on 13 to 15 Nov from about 880 to 580 km/s, then showed a fresh enhancement early on 16 Nov to about 727 km/s with Bt near 18 nT and predominantly northward Bz, before settling around 650 to 680 km/s.
Geomagnetism
The geomagnetic activity ranged from quiet conditions to a severe storm. A brief active period occurred on 10 Nov. We experienced a severe storm on 12 Nov around 00:00 to 03:00 UTC with NOAA Kp at 9- and local K BEL up to 9. This geomagnetic storm was the consequence of the CME impacts from 11 to 12 Nov.
Conditions declined on 13 Nov through active and minor storm levels, then were mostly quiet to unsettled on 14 to 15 Nov. A glancing CME passage and elevated solar wind on 16 Nov produced unsettled to active conditions with NOAA Kp peaking at 4 around 00:00 to 03:00 UTC.
PROBA2 Observations
Solar Activity
Solar flare activity fluctuated from low to high during the week.
In order to view the activity of this week in more detail, we suggest to go to the following website from which all the daily (normal and difference) movies can be accessed: https://proba2.oma.be/ssa
This page also lists the recorded flaring events.
A weekly overview movie (SWAP week 816) can be found here: https://proba2.sidc.be/swap/data/mpg/movies/weekly_movies/weekly_movie_2025_11_10.mp4.
Details about some of this week's events can be found further below.
If any of the linked movies are unavailable they can be found in the P2SC movie repository here: https://proba2.oma.be/swap/data/mpg/movies/.
Friday November 14
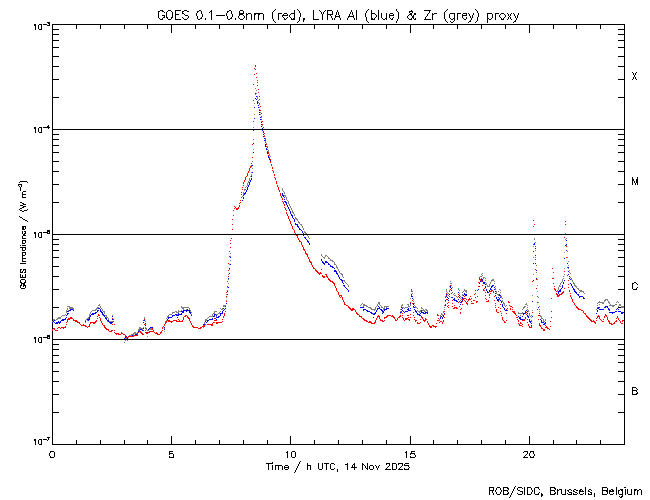
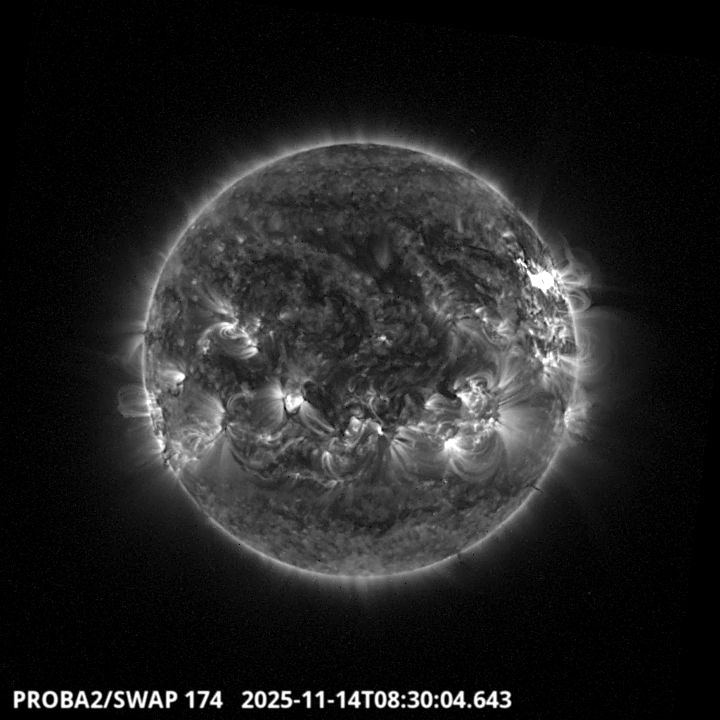
The largest flare of this week was an X5.1 on 2025-Nov-11, but the one that was reliably observed by LYRA (top panel) and by SWAP (bottom panel) was an X4.0. This second flare peaked on 2025-Nov-14 at 08:30 UT and occurred in the north-western quadrant of the Sun, originating from active region NOAA4274 (SIDC 687).
Find a SWAP movie of the event here: https://proba2.sidc.be/swap/movies/20251114_swap_movie.mp4.
International Sunspot Number by SILSO

The daily Estimated International Sunspot Number (EISN, red curve with shaded error) derived by a simplified method from real-time data from the worldwide SILSO network. It extends the official Sunspot Number from the full processing of the preceding month (green line), a few days more than one solar rotation. The horizontal blue line shows the current monthly average. The yellow dots give the number of stations that provided valid data. Valid data are used to calculate the EISN. The triangle gives the number of stations providing data. When a triangle and a yellow dot coincide, it means that all the data is used to calculate the EISN of that day.
Noticeable Solar Events
| DAY | BEGIN | MAX | END | LOC | XRAY | OP | 10CM | TYPE | Cat | NOAA |
| 10 | 0855 | 0919 | 1019 | N23W14 | X1.2 | 2B | III/3II/3IV/2 | 4274 | ||
| 10 | 1946 | 1957 | 2003 | N21W20 | M1.5 | 2N | VI/2 | 4274 | ||
| 11 | 0802 | 0809 | 0813 | N21W31 | M1.4 | SF | 4274 | |||
| 11 | 0949 | 1004 | 1017 | N23W24 | X5.1 | 3B | II/3VI/3III/2 | 4274 | ||
| 14 | 0744 | 0830 | 0840 | X4.0 | III/2II/3IV/2 | 89 | 4274 | |||
| 14 | 2004 | 2012 | 2016 | M1.3 | 89 | 4274 | ||||
| 14 | 2122 | 2131 | 2134 | M1.3 | 89 | 4274 | ||||
| 16 | 0749 | 0817 | 0832 | M3.1 | 89 | 4274 |
| LOC: approximate heliographic location | TYPE: radio burst type |
| XRAY: X-ray flare class | Cat: Catania sunspot group number |
| OP: optical flare class | NOAA: NOAA active region number |
| 10CM: peak 10 cm radio flux |
Geomagnetic Observations in Belgium

Local K-type magnetic activity index for Belgium based on data from Dourbes (DOU) and Manhay (MAB). Comparing the data from both measurement stations allows to reliably remove outliers from the magnetic data. At the same time the operational service availability is improved: whenever data from one observatory is not available, the single-station index obtained from the other can be used as a fallback system.
Both the two-station index and the single station indices are available here: http://ionosphere.meteo.be/geomagnetism/K_BEL/
The SIDC Space Weather Briefing
The forecaster on duty presented the SIDC briefing that gives an overview of space weather from November 10 to 16.
The pdf of the presentation can be found here: https://www.stce.be/briefings/20251117_SWbriefing.pdf
Review of Ionospheric Activity

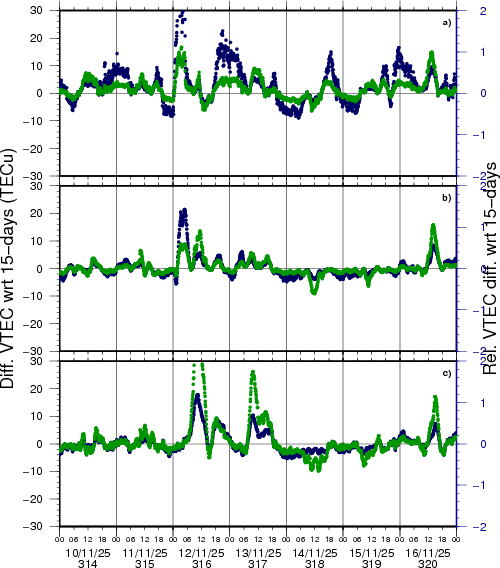
VTEC time series at 3 locations in Europe from 10 Nov 2025 till 16 Nov 2025
The top figure shows the time evolution of the Vertical Total Electron Content (VTEC) (in red) during the last week at three locations:
a) in the northern part of Europe(N 61deg E 5deg)
b) above Brussels(N 50.5deg, E 4.5 deg)
c) in the southern part of Europe(N 36 deg, E 5deg)
This top figure also shows (in grey) the normal ionospheric behaviour expected based on the median VTEC from the 15 previous days.
The time series below shows the VTEC difference (in green) and relative difference (in blue) with respect to the median of the last 15 days in the North, Mid (above Brussels) and South of Europe. It thus illustrates the VTEC deviation from normal quiet behaviour.
The VTEC is expressed in TECu (with TECu=10^16 electrons per square meter) and is directly related to the signal propagation delay due to the ionosphere (in figure: delay on GPS L1 frequency).
The Sun's radiation ionizes the Earth's upper atmosphere, the ionosphere, located from about 60km to 1000km above the Earth's surface.The ionization process in the ionosphere produces ions and free electrons. These electrons perturb the propagation of the GNSS (Global Navigation Satellite System) signals by inducing a so-called ionospheric delay.
See http://stce.be/newsletter/GNSS_final.pdf for some more explanations; for more information, see https://gnss.be/SpaceWeather
STCE training courses and seminars
Courses, seminars, presentations and events with the Sun-Space-Earth system and Space Weather as the main theme. We provide occasions to get submerged in our world through educational, informative and instructive activities.
* Feb 9-11, 2026, STCE Space Weather Introductory Course, Brussels, Belgium - register: https://events.spacepole.be/event/255/
* Mar 16-18, 2026, STCE course: Role of the ionosphere and space weather in military communications, Brussels, Belgium - register: https://events.spacepole.be/event/258/
* Apr 20-21, 2026, STCE cursus: inleiding tot het ruimteweer, Brussels, Belgium - register: https://events.spacepole.be/event/260/
* Mar 23, 2026, STCE lecture: From physics to forecasting, Space Weather course, ESA Academy, Redu, Belgium
* Jun 15-17, 2026, STCE Space Weather Introductory Course, Brussels, Belgium - register: https://events.spacepole.be/event/256/
* Oct 12-14, 2026, STCE Space Weather Introductory Course, Brussels, Belgium - register: https://events.spacepole.be/event/257/
* Nov 23-25, 2026, STCE course: Role of the ionosphere and space weather in military communications, Brussels, Belgium - register: https://events.spacepole.be/event/259/
* Dec 7-9, 2026, STCE Space Weather Introductory Course for Aviation, Brussels, Belgium - register: https://events.spacepole.be/event/262/
To register for a course and check the seminar details, navigate to the STCE Space Weather Education Center: https://www.stce.be/SWEC
If you want your event in the STCE newsletter, contact us: stce_coordination at stce.be
Website: https://www.stce.be/SWEC