- Table of Content
- 1.Perspective
- 2.Review of Sola...
- 3.International ...
- 4.Noticeable Sol...
- 5.PROBA2 Observa...
- 6.Geomagnetic Ob...
- 7.The SIDC Space...
- 8.Review of Iono...
- 9.Upcoming Activ...
2. Review of Solar and Geomagnetic Activity
3. International Sunspot Number by SILSO
4. Noticeable Solar Events
5. PROBA2 Observations
6. Geomagnetic Observations in Belgium
7. The SIDC Space Weather Briefing
8. Review of Ionospheric Activity
9. Upcoming Activities
Perspective
The strong X1.9 flare of 18 January this year was associated with a severe solar radiation storm (see this news item at https://www.stce.be/news/801/welcome.html ). The greater than 10 MeV proton flux (labelled "P10" in this news item) reached a maximum of 37.000 pfu (1 pfu = 1 proton flux unit = 1 proton per second, per square cm, and per steradian). This is higher than that of the famous Halloween events in October 2003 (29.500 pfu). We have to go back all the way to 23-24 March 1991 (that's 35 years ago...) to find an even stronger proton event, when P10 reached 43.000 pfu - the strongest observed by GOES satellites in half a century of observations!
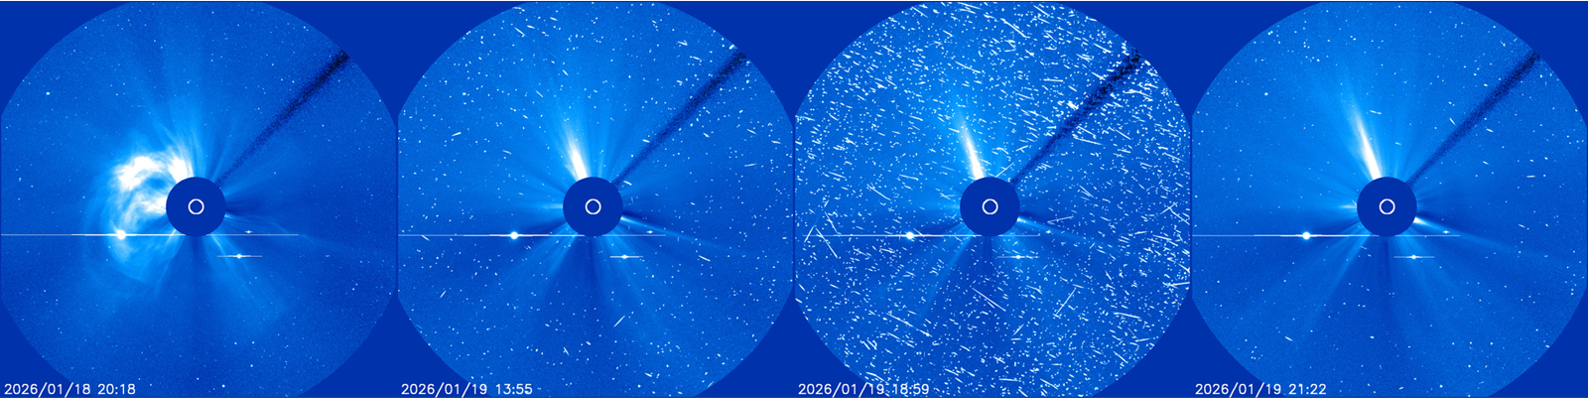
The effect of the large number of protons was quite obvious in the images made by the coronagraphs on board of SOHO (https://soho.nascom.nasa.gov/home.html ). The images underneath cover the period from noon on 18 until noon on 20 January. The flare peaked around 18:00UTC, and the magnetic cloud (CME or coronal mass ejection) can already be seen shortly afterwards. The protons generated by the eruption can be "seen" as bright flashing dots in the images as the particles impacted the camera pixels. This "noise" in the images continued its gradual increase during the next day, as the shock of the earth-directed CME continued to accelerate particles which were also registered by the GOES instruments as a further increasing proton flux (P10). As soon as the shock had passed the earth environment (after around 20:00UTC on 19 January), the proton flux quickly fell off, and the noise in the coronagraphic images followed suit. Note that -in general- the CME shock is efficient at accelerating high-energy protons (100 MeV or more) when it is close to the Sun, but as it propagates away, it becomes only efficient at accelerating low-energy particles (P10).
One would expect -from historical events- that such severe proton events go together with hazardous radiation conditions for astronauts and passengers in planes flying over the north pole. The typical space weather examples cited are the Bastille Day event (14-15 July 2000) and the Halloween events, when astronauts had to seek shelter in the inner compartments of the International Space Station, and planes on polar routes were diverted to more southerly flight paths in order to avoid the radiation hazard from these particles. Indeed, when these proton events are accompanied by protons with energies of 500 MeV or more, one can detect secondary particles such as neutrons at the Earth surface. This is called a Ground Level Enhancement (GLE), i.e. an increase in the natural radiation at the surface of the Earth.
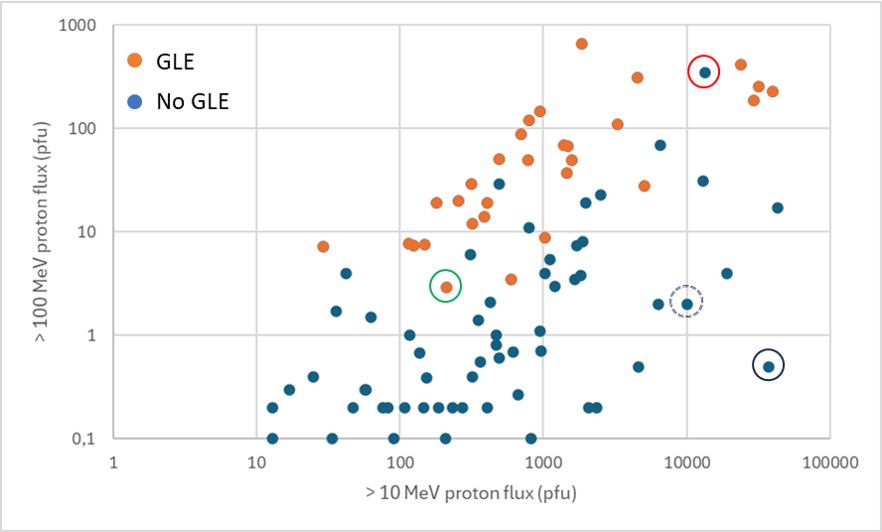
However, this was not so much the case for the January 2026 event, when the protons with energies greater than 100 MeV proton flux (labelled "P100" in this news item) remained near background levels for the entire duration. This can be seen in the plot underneath, covering most of the moderate and stronger proton events from the maximum of solar cycle 22 onwards (data from NOAA/SWPC - https://www.ngdc.noaa.gov/stp/space-weather/interplanetary-data/solar-proton-events/SEP%20page%20code.html ). The P100 value was chosen, as it is more easily available than fluxes of protons with higher energies. The horizontal axis represents P10, the vertical axis represents P100. For each event, the maximum P10 and P100 values were taken. Note that both of these axes are on a logarithmic scale. If a GLE (Oulu GLE database - https://gle.oulu.fi/#/ ) was associated with the proton event, then the data point got an orange colour. It's clear that the general relationship holds true: the higher P10, the higher P100 and -if the P100 exceeds about 5 to 10 pfu- usually a GLE follows.
But there are exceptions. The most obvious is the 19 January 2026 event, i.e. the circled dot at the lower right of the plot. Clearly, this sheep is far away from the flock. The reason for this (or at least one of the contributing factors) is the very high speed of the CME, transiting the Sun-Earth distance in barely 25 hours. The shock of this fast CME then drove the P10 to well above the typical values for such an event. These are extraordinary circumstances! Indeed, a moderately strong solar flare (with very low P100) that gets nonetheless accompanied by a very fast CME which in turn drives the P10 to unusually high values: for sure this is something not seen every day. But it happens from time to time, another example being the 20-21 February 1994 event (the blue dot in the dashed circle) where the CME made the Sun-Earth transit in 31 hours. In all these cases, despite the very high P10, radiation hazard for astronauts and for passengers/crew on polar flights was significantly lower than during the Bastille Day or Halloween storms. Of course, the high P10 strongly affected the High Frequency Communication (HF Com ; 3-30 MHz) over the polar cap, which may have been a reason to divert the planes away from the poles anyway.
The plot underneath also shows some proton events with a very high P100, without resulting in a GLE. This is in part because a high P100 does not necessarily mean that there is also a sufficient number of high-energy particles (500 or more MeV) necessary to cause a GLE. This certainly explains a few proton events that have a P100 around 10 pfu but that eventually did not result in a GLE. Even then, there still remain some true anomalies. For example, during the 9 November 2000 event (red circled dot), the P100 reached a staggering 347 pfu. It was found that for this event, also the greater than 700 MeV proton flux was strongly enhanced. Yet, no GLE was observed! Another anomaly is the 6 May 1998 event (green circled orange dot), where no enhancement in the greater than 700 MeV proton flux was observed, yet the proton event still managed to produce a GLE. Studies such as by Thakur et al. (2016 - https://doi.org/10.1007/s11207-015-0830-9 ) have suggested that a series of factors such as the phase of the solar cycle, the height of the CME-shock formation, ... may all have combined into the materialization of these anomalies.
Review of Solar and Geomagnetic Activity
WEEK 1309 from 2026 Jan 26
Solar Active Regions (ARs) and flares
The solar flaring activity over the past week was at low levels through most of the week with background C-class flaring. High levels of activity were reached on Feb 01 with a registered M6.6 flare (SIDC Flare 6792), peak time 10:02 UTC. A short-lived X1.0 flare (SIDC 6796) with start time 12:25 UTC, peak time 12:33 UTC and end time 12:37 UTC was recorded in the GOES 19 X ray flux data on Feb 01.
There were more than 20 active regions on the visible solar disk, most of them relatively simple, classified as magnetic type alpha or beta. SIDC Sunspot Group 784 (NOAA Active Region 4366) was by far the largest, most complex and most active sunspot group throughout the entire week. It emerged on disk near the north-east limb on Jan 30 and exhibited rapid flux emergence, quickly growing in size, complexity and number of sunspots. It was classified as magnetic type beta-gamma-delta and was responsible for the high flaring activity observed at the end of the week.
Coronal mass ejections
No Earth-directed coronal mass ejections (CMEs) were detected in the available coronagraph imagery throughout the week.
Coronal Holes
The negative polarity coronal hole (SIDC 147), which first crossed the central meridian on Jan 24 continued to reside there until Jan 26. A high speed stream emanating from it was expected to arrive at Earth late UTC on Jan 27 or Jan 28.
A small positive polarity coronal hole emerged on the disk (SIDC 148) and decayed before becoming geo-effective.
Two negative polarity coronal holes returned onto disk on Jan 31 (SIDC 136) and Feb 01 (SIDC 142) and might reach geo-effective position by mid next week.
Proton flux levels
The greater than 10 MeV GOES proton flux as measured by GOES 18 was below 10 pfu radiation storm thresholds throughout the entire week. The week started with the greater than 10 MeV GOES proton flux on a gradual decrease towards nominal levels, recovering from the strong proton event registered last week. The greater than 10 MeV GOES proton flux returned to background levels on Jan 27 and remained there for the rest of the week.
Electron fluxes at GEO
The greater than 2 MeV electron flux as measured by GOES 18 and GOES 19 was exceeding the 1000 pfu threshold throughout most of the week. The corresponding electron fluence was at moderate levels for most of the week, reaching borderline with high levels.
Solar wind
The solar wind conditions (as measured by ACE) reflected a waning influence from a high-speed stream (HSS) related to a positive polarity coronal hole (SIDC 146) at the beginning of the week. A sector boundary crossing was observed on Jan 27 and clear signatures of fast HSS were registered in situ in the solar wind data on Jan 28. The HSS was related to a negative polarity coronal hole (SIDC 147), which first crossed the central meridian late on Jan 24. Related to this HSS arrival the magnitude of the interplanetary magnetic field (B) reached a maximum value of 13.6 nT on Jan 28, with a minimum value of the north-south component (Bz) of -12.2 nT. The solar wind speed has reached a maximum of 781 km/s.
The orientation of the interplanetary magnetic field was directed mostly away from the Sun at the beginning of the week and then switched direction towards the Sun with the sector boundary crossing on Jan 27. The corresponding B phi angle switched from the positive to the negative sector, reflecting the polarities of the geo-effective coronal holes. The solar wind parameters returned to background slow solar wind conditions on Jan 31 and remained at slow solar wind conditions thereafter.
Geomagnetism
The geomagnetic conditions at the beginning of the week started at quiet to unsettled levels related to the waning influence of a high-speed stream related to coronal hole SIDC 146. Locally over Belgium isolated active periods were reached on Jan 25 and Jan 26. Quiet to unsettled conditioned were registered on Jan 27 until the expected arrival of a high speed stream from a negative polarity coronal hole (SIDC 147), which resulted in further active conditions with minor storm levels being registered late UTC on Jan 28. Predominantly unsettled to active conditions were registered on Jan 29 and mostly quiet conditions followed thereafter.
International Sunspot Number by SILSO

The daily Estimated International Sunspot Number (EISN, red curve with shaded error) derived by a simplified method from real-time data from the worldwide SILSO network. It extends the official Sunspot Number from the full processing of the preceding month (green line), a few days more than one solar rotation. The horizontal blue line shows the current monthly average. The yellow dots give the number of stations that provided valid data. Valid data are used to calculate the EISN. The triangle gives the number of stations providing data. When a triangle and a yellow dot coincide, it means that all the data is used to calculate the EISN of that day.
Noticeable Solar Events
| DAY | BEGIN | MAX | END | LOC | XRAY | OP | 10CM | TYPE | Cat | NOAA |
| 01 | 0152 | 0205 | 0212 | M1.7 | 4366 | |||||
| 01 | 0331 | 0341 | 0350 | M1.0 | CTM/1 | 4366 | ||||
| 01 | 0408 | 0420 | 0435 | M1.9 | 4366 | |||||
| 01 | 0953 | 1002 | 1006 | M6.6 | 4366 | |||||
| 01 | 1028 | 1042 | 1050 | M2.4 | 4366 | |||||
| 01 | 1152 | 1212 | 1220 | M6.7 | 4366 | |||||
| 01 | 1225 | 1233 | 1237 | X1.0 | 4366 | |||||
| 01 | 1244 | 1250 | 1256 | M5.8 | 4366 | |||||
| 01 | 1418 | 1425 | 1429 | M1.5 | 4366 | |||||
| 01 | 1537 | 1548 | 1557 | M1.5 | 4366 | |||||
| 01 | 1557 | 1605 | 1616 | M5.1 | 4366 | |||||
| 01 | 1732 | 1735 | 1740 | M1.1 | 4366 | |||||
| 01 | 1743 | 1758 | 1815 | M2.5 | 4366 | |||||
| 01 | 1815 | 1819 | 1822 | M2.1 | 4366 | |||||
| 01 | 1848 | 1856 | 1902 | M1.9 | 4366 | |||||
| 01 | 1912 | 1922 | 1934 | M1.8 | 4366 | |||||
| 01 | 2020 | 2030 | 2039 | M2.2 | 4366 | |||||
| 01 | 2312 | 2327 | 2344 | M1.3 | 4366 | |||||
| 01 | 2344 | 2357 | 0004 | X8.1 | 4366 |
| LOC: approximate heliographic location | TYPE: radio burst type |
| XRAY: X-ray flare class | Cat: Catania sunspot group number |
| OP: optical flare class | NOAA: NOAA active region number |
| 10CM: peak 10 cm radio flux |
PROBA2 Observations
Solar Activity
Solar flare activity fluctuated from low to high during the week.
In order to view the activity of this week in more detail, we suggest to go to the following website from which all the daily (normal and difference) movies can be accessed here: https://proba2.oma.be/ssa
This page also lists the recorded flaring events.
A weekly overview movie can be found here (SWAP week 827): https://proba2.sidc.be/swap/data/mpg/movies/weekly_movies/weekly_movie_2026_01_26.mp4
Details about some of this week's events can be found further below.
If any of the linked movies are unavailable they can be found in the P2SC movie repository here: https://proba2.oma.be/swap/data/mpg/movies/
Sunday Feb 01
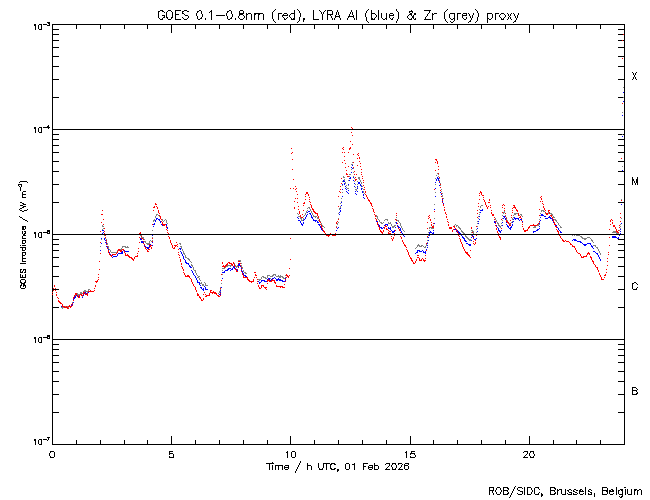
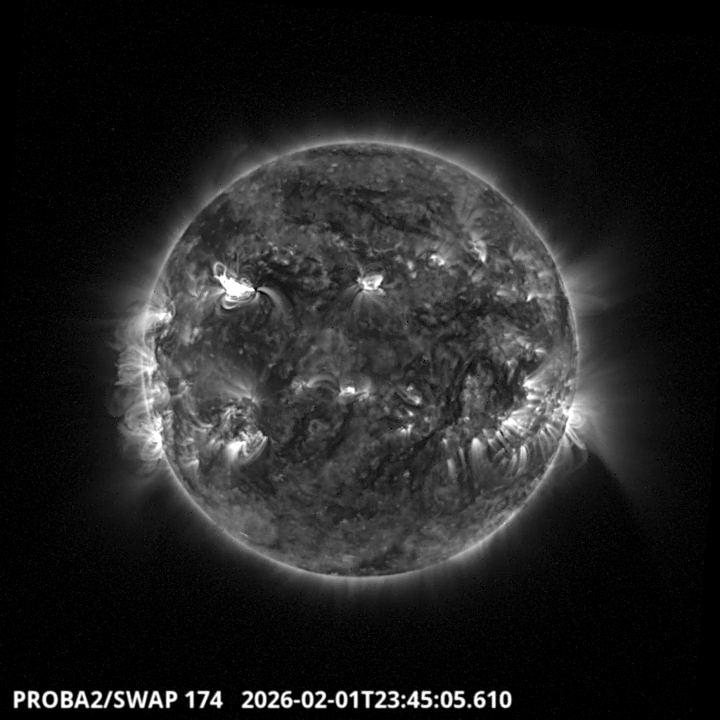
The highest flare of the numerous flares of this day was an X8.1, and it was observed by LYRA
(top panel) and SWAP (bottom panel). The flare peaked on 2026-Feb-01 at 23:57 UT and
occurred in the North East part of the solar disc, originating from active region NOAA4366 (SIDC
784). Find a SWAP movie of the event here: https://proba2.sidc.be/swap/movies/20260201_swap_movie.mp4
Geomagnetic Observations in Belgium

Local K-type magnetic activity index for Belgium based on data from Dourbes (DOU) and Manhay (MAB). Comparing the data from both measurement stations allows to reliably remove outliers from the magnetic data. At the same time the operational service availability is improved: whenever data from one observatory is not available, the single-station index obtained from the other can be used as a fallback system.
Both the two-station index and the single station indices are available here: http://ionosphere.meteo.be/geomagnetism/K_BEL/
The SIDC Space Weather Briefing
The forecaster on duty presented the SIDC briefing that gives an overview of space weather from January 26 to February 1.
The pdf of the presentation can be found here: https://www.stce.be/briefings/20260202_SWbriefing.pdf
Review of Ionospheric Activity


VTEC time series at 3 locations in Europe from 26 Jan 2026 till 1 Feb 2026
The top figure shows the time evolution of the Vertical Total Electron Content (VTEC) (in red) during the last week at three locations:
a) in the northern part of Europe(N 61deg E 5deg)
b) above Brussels(N 50.5deg, E 4.5 deg)
c) in the southern part of Europe(N 36 deg, E 5deg)
This top figure also shows (in grey) the normal ionospheric behaviour expected based on the median VTEC from the 15 previous days.
The time series below shows the VTEC difference (in green) and relative difference (in blue) with respect to the median of the last 15 days in the North, Mid (above Brussels) and South of Europe. It thus illustrates the VTEC deviation from normal quiet behaviour.
The VTEC is expressed in TECu (with TECu=10^16 electrons per square meter) and is directly related to the signal propagation delay due to the ionosphere (in figure: delay on GPS L1 frequency).
The Sun's radiation ionizes the Earth's upper atmosphere, the ionosphere, located from about 60km to 1000km above the Earth's surface.The ionization process in the ionosphere produces ions and free electrons. These electrons perturb the propagation of the GNSS (Global Navigation Satellite System) signals by inducing a so-called ionospheric delay.
See http://stce.be/newsletter/GNSS_final.pdf for some more explanations; for more information, see https://gnss.be/SpaceWeather
Upcoming Activities
Courses, seminars, presentations and events with the Sun-Space-Earth system and Space Weather as the main theme. We provide occasions to get submerged in our world through educational, informative and instructive activities.
* Feb 9-11, 2026, STCE Space Weather Introductory Course, Brussels, Belgium - register: https://events.spacepole.be/event/255/, fully booked
* Feb 18, 2026, STCE Public Lecture on Proba-3, Volkssterrenwacht Beisbroek, Bruges, Belgium
* Mar 16-18, 2026, STCE course: Role of the ionosphere and space weather in military communications, Brussels, Belgium - register: https://events.spacepole.be/event/258/
* Apr 20-21, 2026, STCE cursus: inleiding tot het ruimteweer, Brussels, Belgium - register: https://events.spacepole.be/event/260/
* Mar 23, 2026, STCE lecture: From physics to forecasting, Space Weather course, ESA Academy, Redu, Belgium
* Jun 15-17, 2026, STCE Space Weather Introductory Course, Brussels, Belgium - register: https://events.spacepole.be/event/256/
* Oct 12-14, 2026, STCE Space Weather Introductory Course, Brussels, Belgium - register: https://events.spacepole.be/event/257/
* Nov 23-25, 2026, STCE course: Role of the ionosphere and space weather in military communications, Brussels, Belgium - register: https://events.spacepole.be/event/259/
* Dec 7-9, 2026, STCE Space Weather Introductory Course for Aviation, Brussels, Belgium - register: https://events.spacepole.be/event/262/
To register for a course and check the seminar details, navigate to the STCE Space Weather Education Center: https://www.stce.be/SWEC
If you want your event in the STCE newsletter, contact us: stce_coordination at stce.be
Website: https://www.stce.be/SWEC