- Table of Content
- 1.Confined and e...
- 2.PROBA-2 sees a...
- 3.Review of Sola...
- 4.International ...
- 5.PROBA2 Observa...
- 6.Noticeable Sol...
- 7.Geomagnetic Ob...
- 8.Review of Iono...
- 9.The SIDC Space...
- 10.Upcoming Activ...
2. PROBA-2 sees an annular eclipse
3. Review of Solar and Geomagnetic Activity
4. International Sunspot Number by SILSO
5. PROBA2 Observations
6. Noticeable Solar Events
7. Geomagnetic Observations in Belgium
8. Review of Ionospheric Activity
9. The SIDC Space Weather Briefing
10. Upcoming Activities
Confined and eruptive flares
One of the most puzzling observations during the previous solar cycle (SC24) was the lack of any coronal mass ejection (CME) associated with the 8 X-class flares (see STCE SWx Classification page at https://www.stce.be/educational/classification#xray ) produced by NOAA 12192 in October 2014. Several STCE newsitems have been dedicated to this sunspot region's activity and its lack of associated CMEs, e.g. this one at https://www.stce.be/news/280/welcome.html
One of the ways to divide solar flares is into two distinct classes: eruptive flares are associated with CMEs, and confined flares that lack CMEs. Because eruptive flares are the principal source of major space weather effects at Earth, relatively little attention was paid to confined flares until this big, flare-productive sunspot group NOAA 12192 transited the solar disk. Despite producing 4 dozen of M-class flares and 8 X-class flares (rescaled x-ray peaks; see https://www.ngdc.noaa.gov/stp/satellite/goes/doc/GOES_XRS_readme.pdf ), all but four (M-class) flares were confined. For context, approximately half of all M-class flares and about 90% of the X-class flares have associated CMEs. The relative absence of CMEs in the large flares from NOAA 12192 has been attributed to magnetic suppression of eruptions by strong magnetic fields overlying the spot group (Chen et al. 2015 - https://iopscience.iop.org/article/10.1088/2041-8205/808/1/L24 ).
An example of an eruptive and a confined flare can be found underneath. On top is an M9.4 flare that was produced on 10 November 2024 by NOAA 13889. The left portion of the image is an extreme ultraviolet image (SDO/AIA 131) of the flare overlaid onto a white light image (SDO/HMI) of the sunspot group. On the right is a radio spectrogram obtained by the Radio-Astronomy Station in Humain, Belgium (HuRAS - https://www.sidc.be/humain/home ). The horizontal axis represents time, covering 30 minutes and starting just before the flare's peak in soft x-rays (12:06 UTC). The vertical axis displays frequency covering the range from 437 to 45 MHz. Note that the lowest frequencies are on top, such that structures leaving the Sun's atmosphere are moving upwards and to the right in this spectrogram. A clear disturbance, what is called a Type II radio burst, can be seen from 12:10 until 12:23 UTC. This type of radio burst is often associated with a CME shock (see the STCE SWx Classification page at https://www.stce.be/educational/classification#radio for more info), and a CME was later indeed observed in coronagraphic images.


The lower portion of the image above is an example of a confined flare. It concerns an X2.9 flare that peaked on 27 October 2014 at 14:47 UTC and that was produced by NOAA 12192. The lay-out is identical to that of the M9 flare, with the SDO images about an hour after the flare's maximum intensity. In this case however, it's clear that there's no disturbance whatsoever in the observed radio frequency range, hinting at the absence of a CME shock. Indeed, no CME was seen in the subsequent coronagraphic imagery.
Recent research by Cliver et al. (2025 - https://iopscience.iop.org/article/10.3847/1538-4357/adfbe5 ) has further finetuned the way that radio waves may help in distinguishing confined from eruptive flares, with all flares in the study having a peak intensity of at least M5.0. They used observations from the US Air Force's Radio Solar Telescope Network (RSTN - https://www.swpc.noaa.gov/products/solar-and-geophysical-event-reports ) -which monitors eight fixed frequencies (from 245 MHz to 15400 MHz) at four locations spanning the globe-, as well as Wind Waves observations at 1 MHz. They found that confined flares typically have a peak 410 MHz emission of less than 10 sfu (solar flux units) above background, whereas eruptive flares characteristically have a peak of 410 MHz emission above this level. This can be seen in the scatter plot underneath left, with the peak flux in the 4995-15400 MHz range on the vertical axis, and the peak 410 MHz flux on the horizontal axis. Confined and eruptive flares are shown in the graph by resp. red (21) and blue (30) data points. The dashed line indicates the threshold of 10 sfu (at 410 MHz) above which a solar flare is usually associated with a CME.
From the 1 MHz data, they concluded that to first order, confined flares lack emission above background at 1 MHz while eruptive flares have strong emission at this frequency. This can be seen in the bar diagram underneath right, with vertically the number of events and on the horizontal axis the intensity at 1 MHz (note the logarithmic scale!). According to the authors, because the plasma frequency at 1 MHz corresponds to a height of about 7 solar radii above the solar "surface", the absence of such emission in confined flares implies a lack of open magnetic field lines and escaping flare-accelerated electrons. Thus the underlying reconnection must be between closed magnetic loops, ruling out interchange reconnection between open and closed field lines for confined flares. The strong 1 MHz emission for the eruptive flares is then attributed to shock acceleration on open fields surrounding the expanding CME.
Though the study is based on a fairly limited number of data points, and the diagrams show a few exceptions, the found relationships may nonetheless provide additional support in an early distinction whether or not a CME is associated with a strong solar flare.

This newsitem was inspired on the research article by Cliver et al. (2025 - https://iopscience.iop.org/article/10.3847/1538-4357/adfbe5 ) as well as the condensed version of this article at CESRA / Solar Radio Science Highlights (https://www.astro.gla.ac.uk/users/eduard/cesra/?p=4159 ). The figure above was taken from these articles.
PROBA-2 sees an annular eclipse
On February 17, an annular eclipse took place. This is an eclipse where the appparent diameter of the occulting Moon is smaller than that of the Sun, making the Sun appear as a ring (annulus in latin). Unfortunately, from Earth, annularity was only visible over Antarctica. Given clear skies, observers in Argentina, Chili and much of Southern Africa were able to see a partial eclipse.
From space, the view was quite different! Thanks to its fast sun-synchronous orbit, the PROBA-2 satellite crosses the eclipse zone multiple times, allowing it to capture several unique perspectives. During its second passage, just over 93% of the solar disk was occulted by the Moon in an annular eclipse, producing the striking “ring of fire” effect. This was followed up by a nearly total eclipse in the third passage. To top it off, PROBA2 observed two small eclipses during the first and the fourth passages.
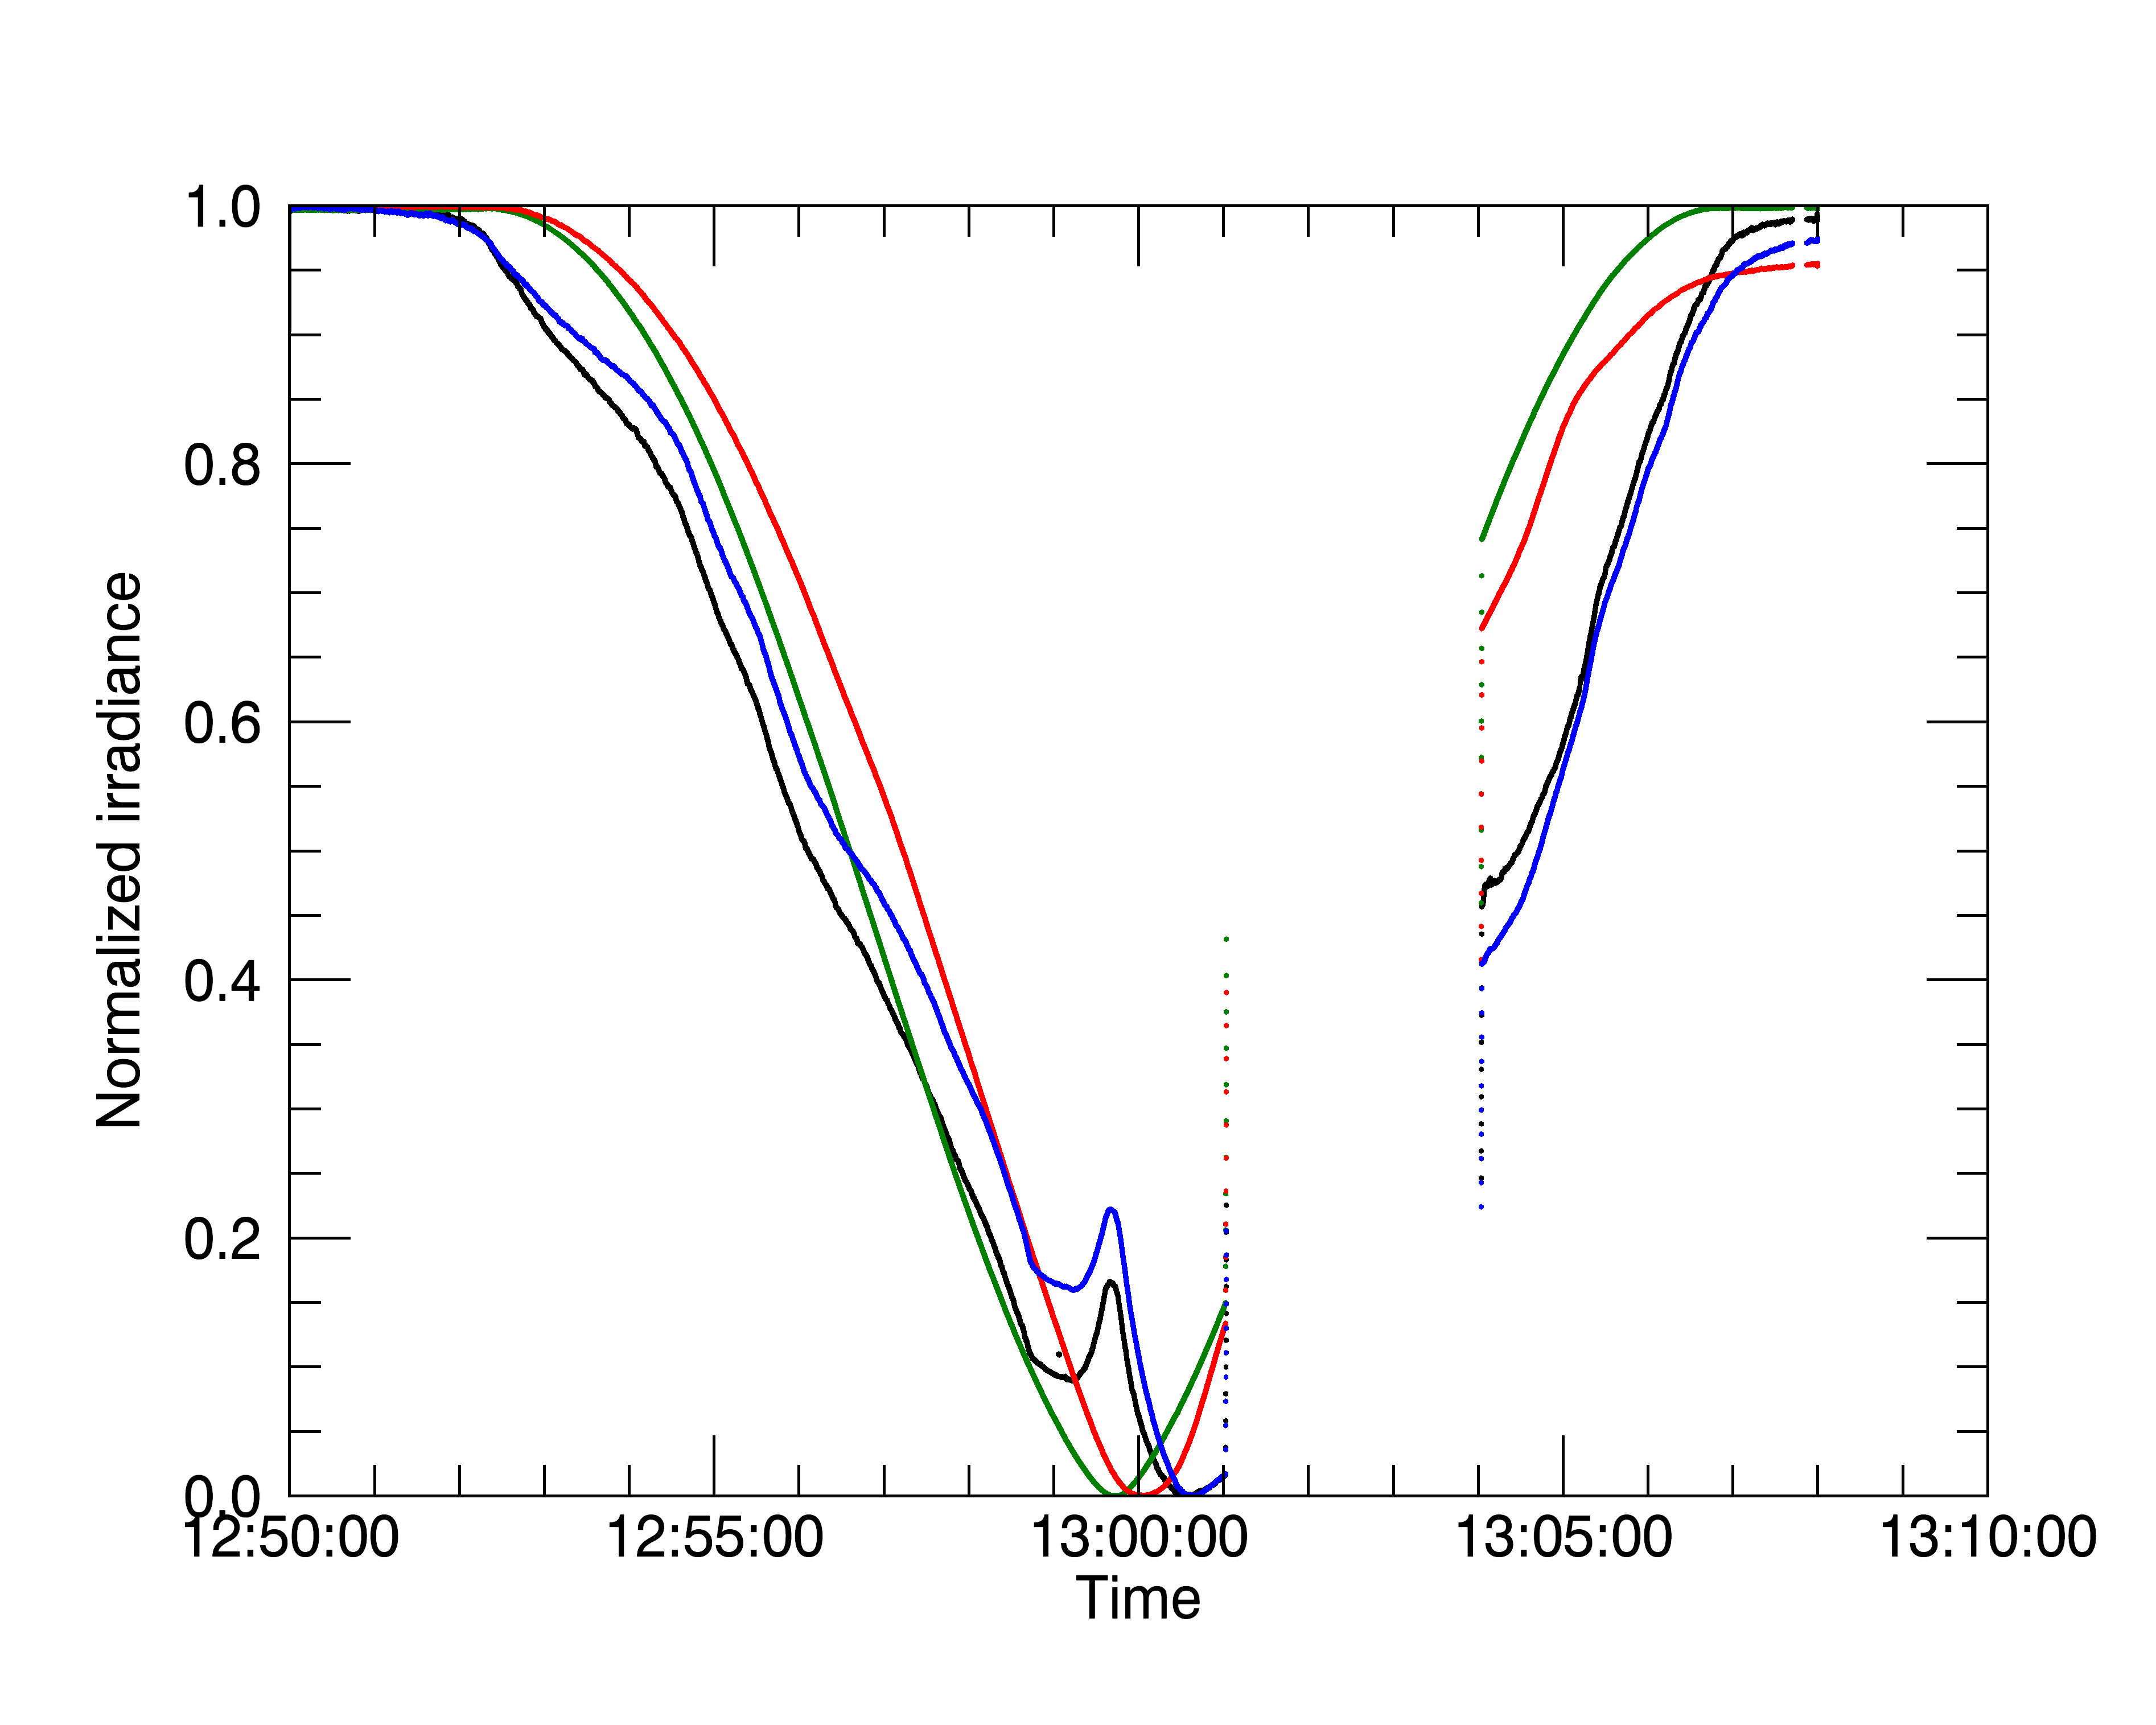
Naturally, high-cadence observations were planned with both SWAP and LYRA instruments and the data was processed as soon as they arrived on the ground. As with earlier eclipses, LYRA conducted a dedicated campaign using one of its backup units to obtain higher-quality measurements. The images below show the dips in the signal measured by the four channels of LYRA when the Moon passes in front of the Sun during the second and third transits through the eclipse zone. Some manoeuvres of the spacecraft were filtered out (corresponding to gaps in the time series).
In these plots, the colours correspond respectively to the zirconium (black — closest to the SWAP passband), aluminium (blue), Lyman-α (red), and Herzberg (green) channels of the instrument. In the two UV channels (red and green), which are relatively insensitive to the presence of active regions on the solar surface, the lunar occultation produces a very smooth, regular profile. In the other two channels, the signal shows additional variations corresponding to the Moon passing in front of regions of differing solar activity.

SWAP operated in high-cadence mode, capturing on average one image every 20 seconds and caught the ring of fire at 11:31 UT. Watch the full movie with the 4 eclipse passages here: https://proba2.sidc.be/Events/2026-Feb-17-SolarEclipse/movies/swap_eclipse_2026_02_17_logos_lossless.mp4

Review of Solar and Geomagnetic Activity
WEEK 1311 from 2026 Feb 09
Solar Active Regions (ARs) and flares
The Solar flaring activity was at low to moderate levels throughout the week, with 21 C-class flares and 7 M-class flares. There were 21 sunspot groups observed on the visible solar disk. SIDC SG 784 (NOAA AR 4366), SIDC SG 790 (NOAA AR 4373) and SIDC SG 762 (NOAA AR 4374) produced most of the flaring activity. The largest flare was a M2.8 flare, peaking on February 09 at 02:27 UTC, which was produced by SIDC SG 784. This region produced 6 of the 7 M-class flares.
Coronal mass ejections
No Earth directed Coronal Mass Ejections (CMEs) were observed throughout the week.
Coronal Holes
One positive polarity (SIDC CH 146) and four negative polarity (SIDC CH 137, 142, 149, and 150) coronal holes were present on the solar disk in the past week.
Returning equatorial SIDC Coronal Hole 146 (equatorial coronal hole with a positive polarity) started crossing the central meridian on February 12 (other crossing times : January 24, January 16).
SIDC Coronal Hole 150 (equatorial coronal hole with a negative polarity) started crossing the central meridian on February 14.
Proton flux levels
The greater than 10 MeV proton flux remained below the 10 pfu threshold throughout the week.
Electron fluxes at GEO
The greater than 2 MeV electron flux, as measured by GOES-19 fluctuated above and below the 1000 pfu threshold from the start of the week until February 15 after which it stayed below the threshold for the rest of the period. The 24-hour electron fluence was at moderate levels at the start of the week until February 13 and then stayed at normal level until the end of the week.
Solar wind
At the beginning of the week, the Earth was inside a slow solar wind regime, with solar wind speeds around 450 km/s and the total interplanetary magnetic field ranging from 4 to 10 nT.
The solar wind parameters became disturbed by the arrival of a high-speed stream on February 14 associated with SIDC Coronal Hole 146, with the solar wind speed rising to 722 km/s and the total interplanetary magnetic field to 15 nT, with the Bz reaching a minimum of – 14 nT.
The phi-angle was in the negative sector at the start of the week until February 13 when it switched to the positive sector for the rest of the week.
Geomagnetism
The geomagnetic conditions were at quiet to active levels (Kp 1-4 and K BEL 1-4) at the start of the week. They reached minor storm conditions locally (K BEL 5) on February 10 and minor storm conditions globally and locally (Kp 5 and K BEL 5) on February 14.
International Sunspot Number by SILSO

The daily Estimated International Sunspot Number (EISN, red curve with shaded error) derived by a simplified method from real-time data from the worldwide SILSO network. It extends the official Sunspot Number from the full processing of the preceding month (green line), a few days more than one solar rotation. The horizontal blue line shows the current monthly average. The yellow dots give the number of stations that provided valid data. Valid data are used to calculate the EISN. The triangle gives the number of stations providing data. When a triangle and a yellow dot coincide, it means that all the data is used to calculate the EISN of that day.
PROBA2 Observations
Solar Activity
Solar flare activity fluctuated from low to moderate during the week.
In order to view the activity of this week in more detail, we suggest to go to the following website from which all the daily (normal and difference) movies can be accessed: https://proba2.oma.be/ssa
This page also lists the recorded flaring events.
A weekly overview movie can be found here (SWAP week 829): https://proba2.sidc.be/swap/data/mpg/movies/weekly_movies/weekly_movie_2026_02-09.mp4
Details about some of this week's events can be found further below.
If any of the linked movies are unavailable they can be found in the P2SC movie repository here: https://proba2.oma.be/swap/data/mpg/movies/
Monday Feb 09

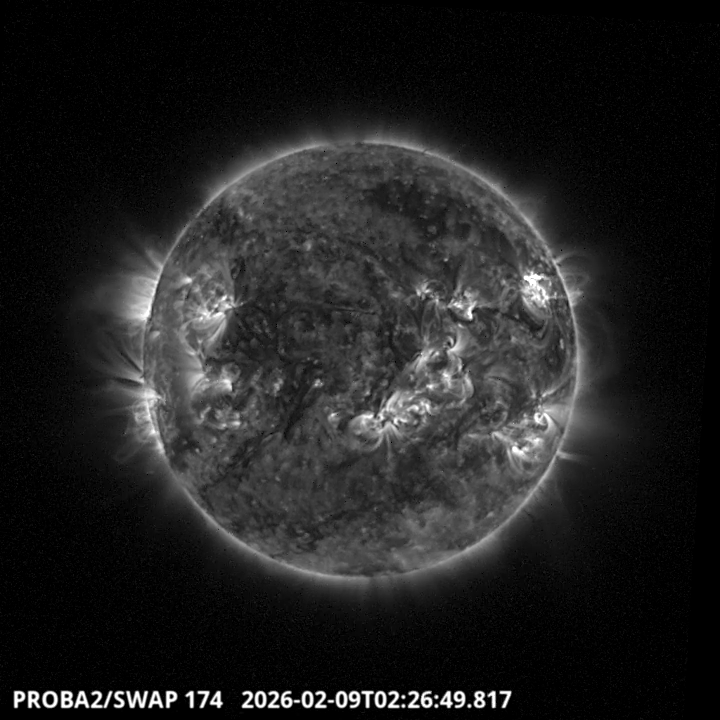
The largest flare of this week was an M2.8, and it was observed by LYRA (top panel) and SWAP (bottom panel). The flare peaked on 2026-Feb-09 at 02:27 UT and occurred on the North West side of the solar disk, originating from active region NOAA4366 (SIDC 784). Find a SWAP movie of the event here: https://proba2.sidc.be/swap/movies/20250209_swap_movie.mp4
Sunday Feb 15
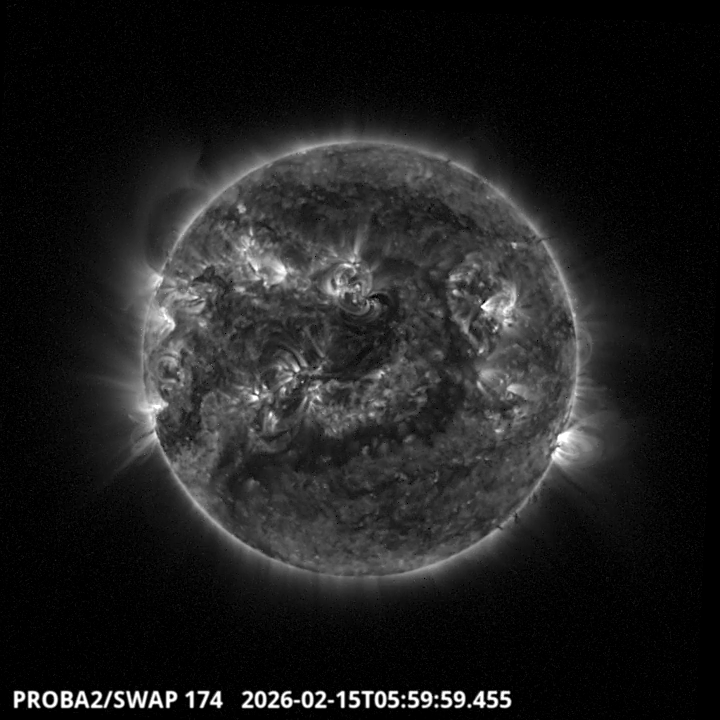
Elongated coronal hole from the South East side until the North West side of the solar disk.
Find a SWAP movie of the event here: https://proba2.sidc.be/swap/movies/20250215_swap_movie.mp4
Noticeable Solar Events
| DAY | BEGIN | MAX | END | LOC | XRAY | OP | 10CM | TYPE | Cat | NOAA |
| 09 | 0214 | 0227 | 0248 | M2.8 | 10 | 4366 | ||||
| 11 | 0029 | 0044 | 0050 | M1.1 | VI/2 | 10 | 4366 | |||
| 11 | 0050 | 0057 | 0059 | M1.3 | ||||||
| 10 | 2356 | 0009 | 0020 | M1.2 | 10 | 4366 | ||||
| 11 | 1247 | 1312 | 1325 | M1.4 | 10 | 4366 | ||||
| 12 | 0229 | 0240 | 0250 | M1.4 | III/2 | 4366 | ||||
| 13 | 0828 | 0858 | 0920 | N11W16 | M1.0 | SF | VI/2 | 17 | 4373 |
| LOC: approximate heliographic location | TYPE: radio burst type |
| XRAY: X-ray flare class | Cat: Catania sunspot group number |
| OP: optical flare class | NOAA: NOAA active region number |
| 10CM: peak 10 cm radio flux |
Geomagnetic Observations in Belgium
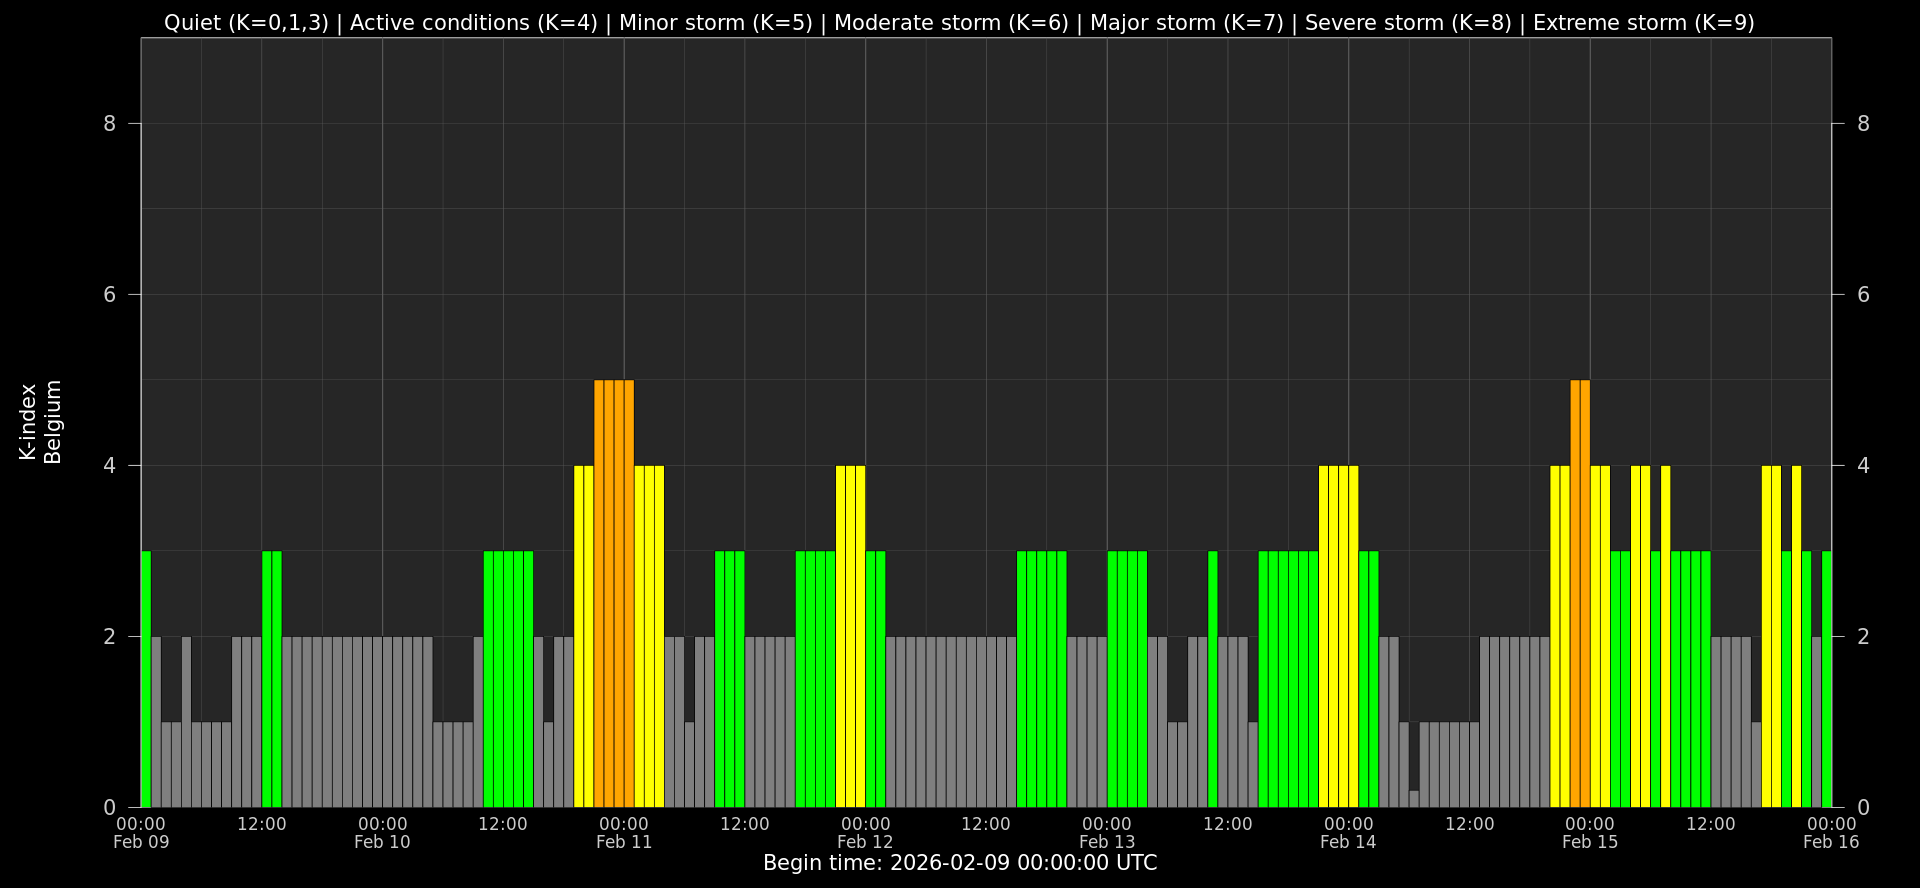
Local K-type magnetic activity index for Belgium based on data from Dourbes (DOU) and Manhay (MAB). Comparing the data from both measurement stations allows to reliably remove outliers from the magnetic data. At the same time the operational service availability is improved: whenever data from one observatory is not available, the single-station index obtained from the other can be used as a fallback system.
Both the two-station index and the single station indices are available here: http://ionosphere.meteo.be/geomagnetism/K_BEL/
Review of Ionospheric Activity


VTEC time series at 3 locations in Europe from 9 Feb 2026 till 15 Feb 2026
The top figure shows the time evolution of the Vertical Total Electron Content (VTEC) (in red) during the last week at three locations:
a) in the northern part of Europe(N 61deg E 5deg)
b) above Brussels(N 50.5deg, E 4.5 deg)
c) in the southern part of Europe(N 36 deg, E 5deg)
This top figure also shows (in grey) the normal ionospheric behaviour expected based on the median VTEC from the 15 previous days.
The time series below shows the VTEC difference (in green) and relative difference (in blue) with respect to the median of the last 15 days in the North, Mid (above Brussels) and South of Europe. It thus illustrates the VTEC deviation from normal quiet behaviour.
The VTEC is expressed in TECu (with TECu=10^16 electrons per square meter) and is directly related to the signal propagation delay due to the ionosphere (in figure: delay on GPS L1 frequency).
The Sun's radiation ionizes the Earth's upper atmosphere, the ionosphere, located from about 60km to 1000km above the Earth's surface.The ionization process in the ionosphere produces ions and free electrons. These electrons perturb the propagation of the GNSS (Global Navigation Satellite System) signals by inducing a so-called ionospheric delay.
See http://stce.be/newsletter/GNSS_final.pdf for some more explanations; for more information, see https://gnss.be/SpaceWeather
The SIDC Space Weather Briefing
The forecaster on duty presented the SIDC briefing that gives an overview of space weather from February 9 to 15.
The pdf of the presentation can be found here: https://www.stce.be/briefings/20260216_SWbriefing.pdf

Upcoming Activities
Courses, seminars, presentations and events with the Sun-Space-Earth system and Space Weather as the main theme. We provide occasions to get submerged in our world through educational, informative and instructive activities.
* Feb 28, 2026, In het oog van de ruimtestorm, Workshop Talim, Beringen, Belgium
* Feb 28, 2026, In het oog van de ruimtestorm, Workshop Talim, Genk, Belgium
* Mar 16-18, 2026, STCE course: Role of the ionosphere and space weather in military communications, Brussels, Belgium - register: https://events.spacepole.be/event/258/
* Apr 20-21, 2026, STCE cursus: inleiding tot het ruimteweer, Brussels, Belgium - register: https://events.spacepole.be/event/260/
* Mar 23, 2026, STCE lecture: From physics to forecasting, Space Weather course by ESA Academy, Redu, Belgium
* Mar 25, 2026, The Belgian Space Weather Centre, Space Weather course by ESA Academy, Brussels, Belgium
* Jun 15-17, 2026, STCE Space Weather Introductory Course, Brussels, Belgium - register: https://events.spacepole.be/event/256/
* Oct 12-14, 2026, STCE Space Weather Introductory Course, Brussels, Belgium - register: https://events.spacepole.be/event/257/
* Nov 23-25, 2026, STCE course: Role of the ionosphere and space weather in military communications, Brussels, Belgium - register: https://events.spacepole.be/event/259/
* Dec 7-9, 2026, STCE Space Weather Introductory Course for Aviation, Brussels, Belgium - register: https://events.spacepole.be/event/262/
To register for a course and check the seminar details, navigate to the STCE Space Weather Education Center: https://www.stce.be/SWEC
If you want your event in the STCE newsletter, contact us: stce_coordination at stce.be
Website: https://www.stce.be/SWEC