- Table of Content
- 1.Low 10.7 cm ra...
- 2.The Moon in si...
- 3.PROBA2 Observa...
- 4.Review of sola...
- 5.The Internatio...
- 6.Review of geom...
- 7.Geomagnetic Ob...
- 8.Review of iono...
- 9.Future Events
2. The Moon in sight
3. PROBA2 Observations (16 Jan 2017 - 22 Jan 2017)
4. Review of solar activity
5. The International Sunspot Number
6. Review of geomagnetic activity
7. Geomagnetic Observations at Dourbes (16 Jan 2017 - 22 Jan 2017)
8. Review of ionospheric activity (16 Jan 2017 - 22 Jan 2017)
9. Future Events
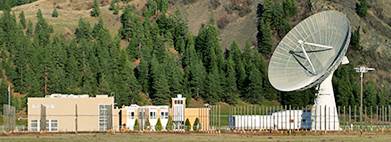
Low 10.7 cm radio flux
Every day, the Dominion Radio Astrophysical Observatory (DRAO) in Penticton, BC, Canada, measures and publishes the values of the 10.7 cm solar radio flux on their website at http://www.spaceweather.ca/solarflux/sx-4a-en.php . The wavelengths around 10.7 cm (frequencies around 2800 MHz) are ideal for monitoring the solar activity, as they are very sensitive to conditions in the upper chromosphere and at the base of the corona. As a result, this radio flux is widely used in solar research and space weather applications. It is measured three times daily: around 17UT (18UT in winter), 20UT (local noon at Penticton), and 23UT (22UT in winter). The 20UT value is usually taken as the radio flux for that particular day.
The radio flux actually consists of three components. One is related to radio bursts associated with solar eruptions, which makes the flux values suddenly change over minutes to hours. Another is a more gradual variation primarily related to the active regions and the overall solar cycle evolution. This is the so-called slowly varying or "S" component, and varies over several days to years. The final contribution comes from the quiet sun background emission. It makes that, even when the sunspot number is zero for several days as during a solar cycle minimum, the 10.7 cm radio flux is not zero but at a (flat) level around 65 sfu (solar flux units, with 1 sfu = 10-22 W m-2 Hz-1 : see http://www.spaceweather.gc.ca/solarflux/sx-3-en.php ).
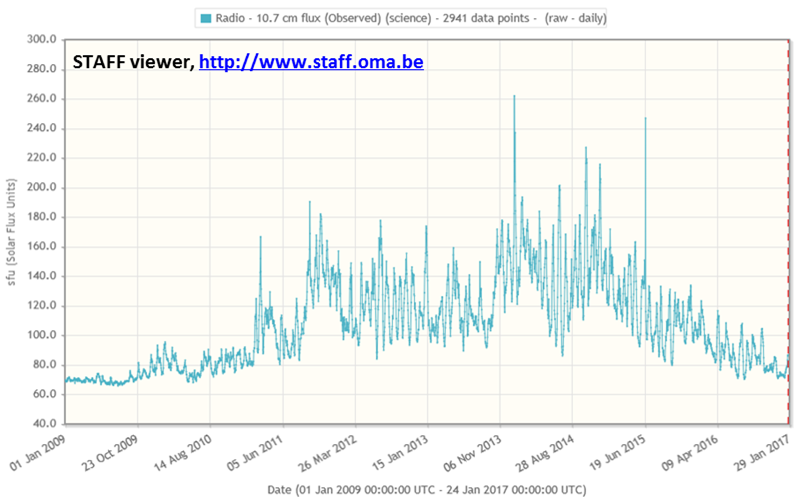
As a result of the low solar activity during the last few months, very low radio fluxes have been recorded. For example, on 9 January 2017, the observed radio flux was only 71.2 sfu. On 28 July 2016, the lowest value since the most recent solar cycle maximum was observed (70.3 sfu). These are values not seen since the end of the previous solar cycle minimum period in 2010, as can be deduced from the graph above showing the daily observed radio fluxes. The two spikes that are prominently present in 2014 and 2015 correspond to strong, long duration flares just before local noon at Penticton (20UT), resp. on 4 January 2014 with an M4.0 flare peaking at 19:46UT, and on 22 June 2015 with a M6.5 flare peaking at 18:23UT.
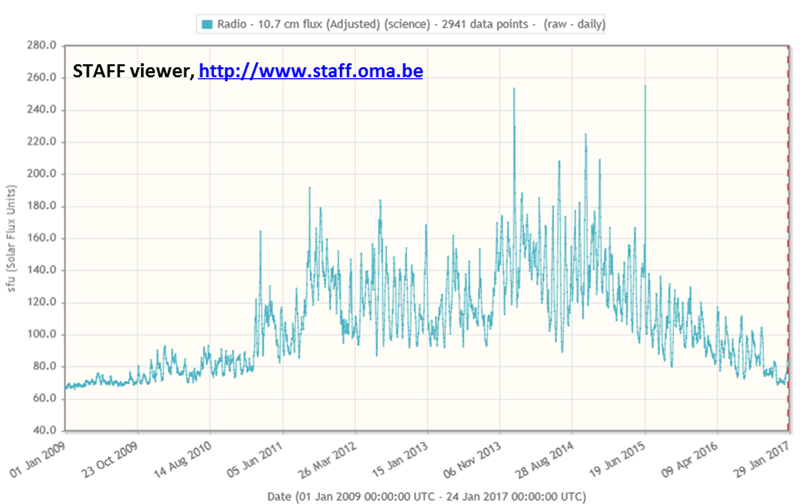
However, radio fluxes have to be compared on equal footing. Indeed, as the orbit of the Earth around the Sun is not a circle but an ellipse, the Earth is sometimes closer to and sometimes further away from the Sun than average. During its point closest to the Sun ("perihelium") early in January, the Earth is about 3.3% or 5 million km closer to the Sun than during its "aphelium" in July when it is furthest from the Sun. For the same radio emission from the Sun, the Earth will clearly receive less radiation when it is further from the Sun, and more when it is closer to the Sun. Hence, the daily observed radio flux has to be corrected for this difference in distance. The new value is called the adjusted radio flux, i.e. adjusted to the same distance of 1 astronomical unit or the average Sun-Earth distance. The graph above was compiled from these adjusted values. It shows that the 12 December 2016 (68.6 sfu) and 9 January 2017 (68.9 sfu) were the lowest since the last solar cycle maximum. In fact, we have to go back all the way to 30 August 2009 to find an even lower value (68.5 sfu) than that of 12 December 2016. A sobering thought that the new solar cycle minimum is gradually approaching.
Credits - The above text was freely inspired on the information and data available at the DRAO website (http://www.spaceweather.ca/solarflux/sx-4a-en.php ) and on the paper "The 10.7 cm solar radio flux (F10.7)" by K. F. Tapping (2013, http://adsabs.harvard.edu/abs/2013SpWea..11..394T ). The charts were created using STAFF viewer, http://www.staff.oma.be
The Moon in sight
This is an exceptional picture of the moon. Because it is made with a solar telescope!
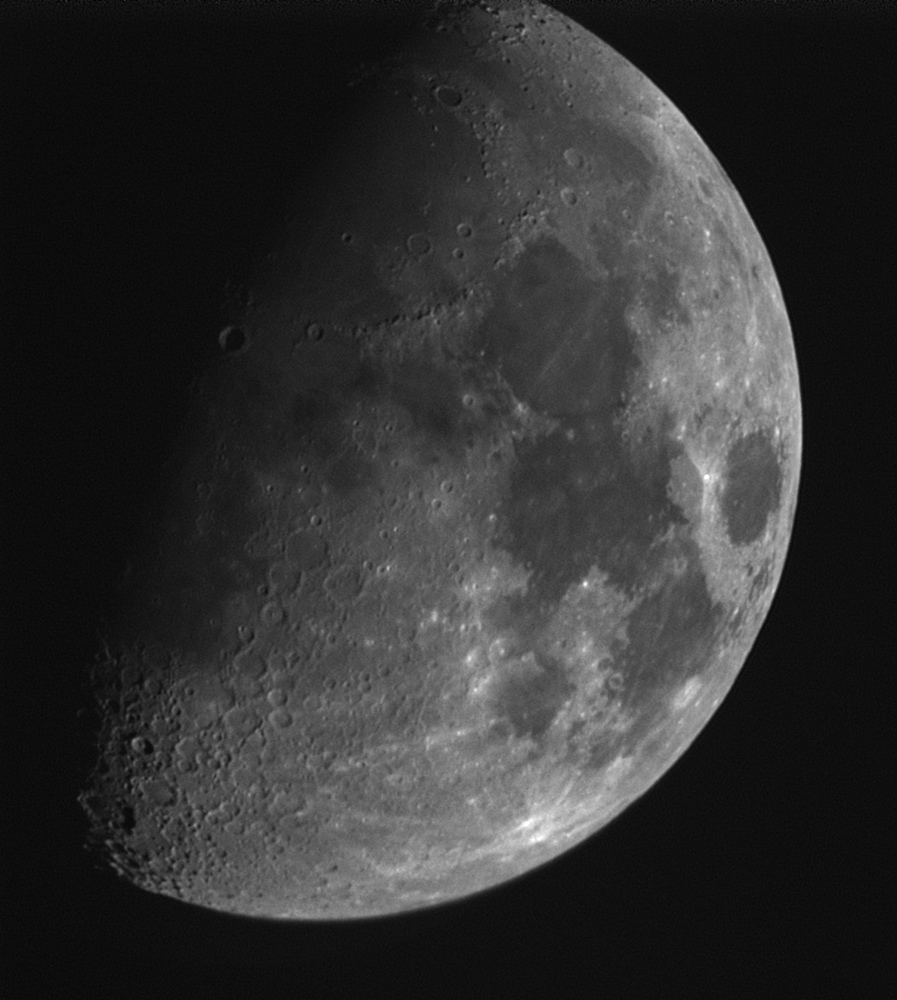
The difficulty lies in the fact that in a solar telescope something like 99,97% of the light of the object you are studying is blocked. Otherwise the camera can burn. This blocking of the light is not a problem when you look at the sun which is a very bright object. The moon is different as it doesn't produce any light. The moon just reflects sunlight.
So, Emil Kraaikamp - the person who made this picture and works at the STCE - used an exposure time of 5 seconds for each picture in a series of 50 contrary to the exposure time in the order of milliseconds for solar pictures! He also had to increase the gain (=brightness magnification) of the camera, resulting in noisy images.
In those 5 seconds, things are changing: the moon moves a little bit in the firmament and the telescope is not able to perfectly follow the moon. If you expose longer, this makes a big difference and results in a blurry picture.
By stacking 50 of these pictures with the 50 moons on top of each other, Emil was able to avoid most of this blurring and at the same time get rid of the noise.
Enjoy this amazing picture!
PROBA2 Observations (16 Jan 2017 - 22 Jan 2017)
Solar Activity
Solar flare activity fluctuated between very low and low during the week.
In order to view the activity of this week in more detail, we suggest to go to the following website from which all the daily (normal and difference) movies can be accessed: http://proba2.oma.be/ssa
This page also lists the recorded flaring events.
A weekly overview movie can be found here (SWAP week 356):
http://proba2.sidc.be/swap/data/mpg/movies/weekly_movies/weekly_movie_2017_01_16.mp4
Details about some of this week’s events, can be found further below.
If any of the linked movies are unavailable they can be found in the P2SC movie repository here:
http://proba2.oma.be/swap/data/mpg/movies/
Thursday Jan 19
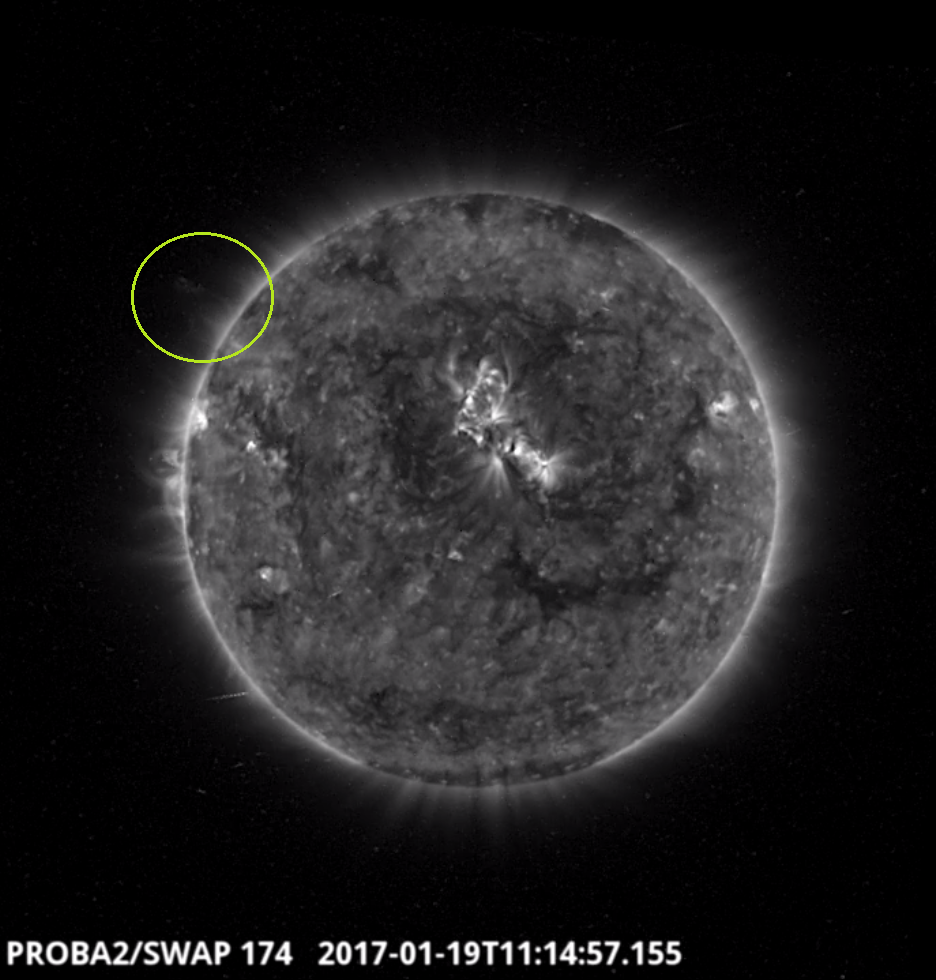
An eruption was observed by SWAP on the east limb of the Sun on 2017-Jan-19 at 14:57 UT
Find a movie of the event here (SWAP movie): http://proba2.oma.be/swap/data/mpg/movies/20170119_swap_movie.mp4
Saturday 21 Jan
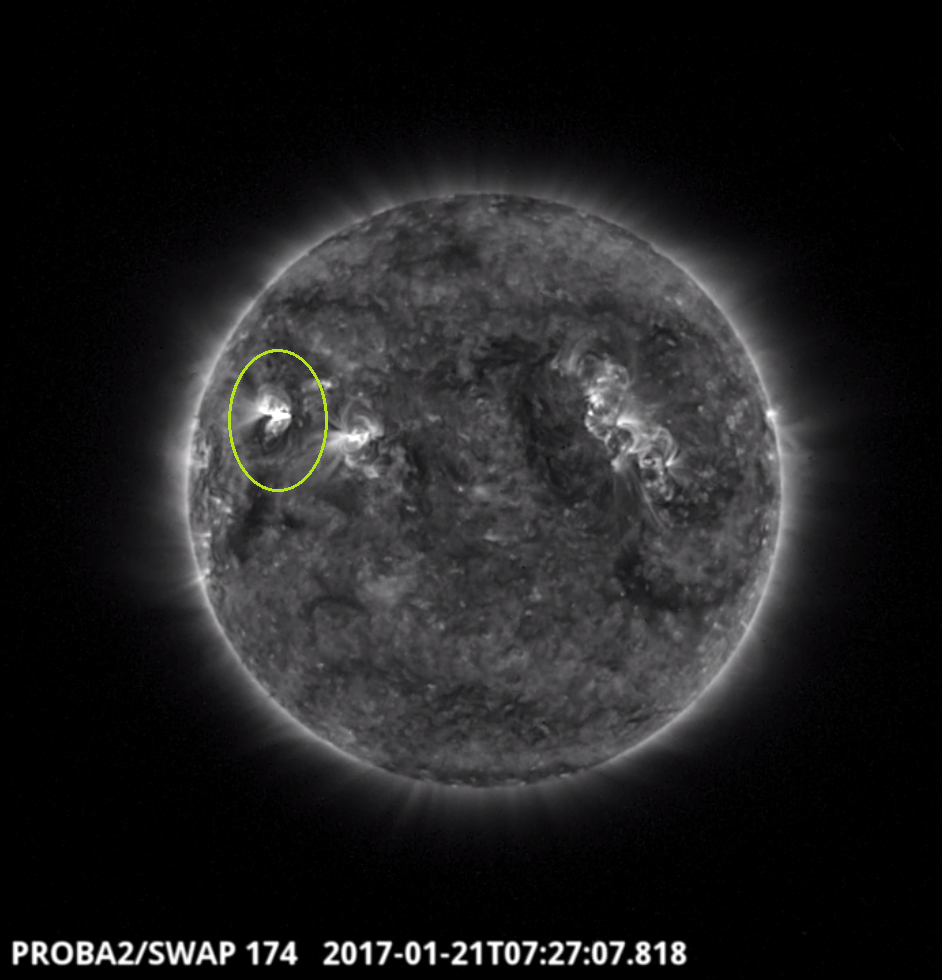
C9.3 class flare was observed by SWAP in the Eastern hemisphere of the Sun on 2017-Jan-21 at 07:27 UT
Find a movie of the events here (SWAP movie): http://proba2.oma.be/swap/data/mpg/movies/20170121_swap_movie.mp4
Review of solar activity
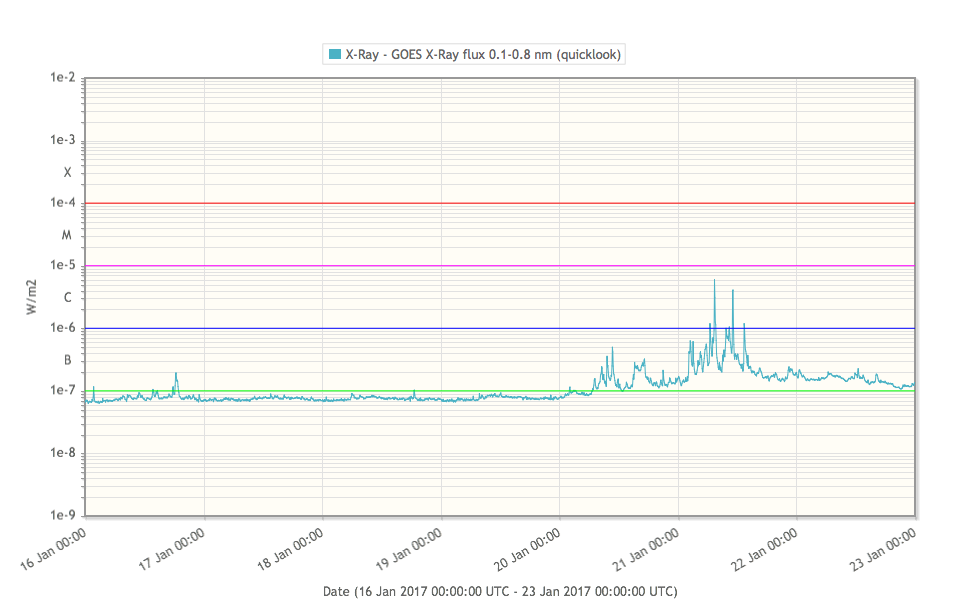
Solar activity was low with 22 B-class and 6 C-class reported. The majority of the flares, as well as the strongest reported flare C9.3 (peak at 07:26 UT on January 21), originated from the Catania sunspot group 81 (NOAA AR 2628).
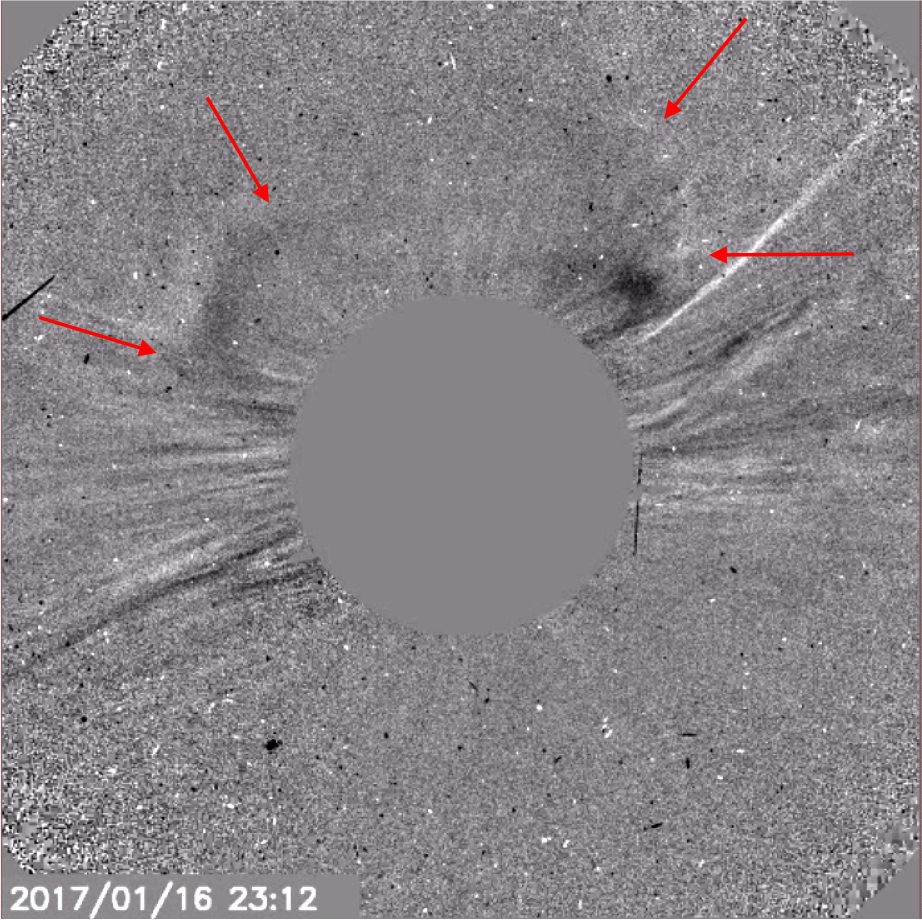
One partial halo CME was observed. It came into the FOV of SOHO LASCO C2 on January 16 straight after the data gap, around 21:30 UT. The solar counterpart of this stealth-like CME is unclear. Since the CME was faint and slow and since the bulk of the CME mass was directed northward from the Sun-Earth line, it did not arrive on Earth.
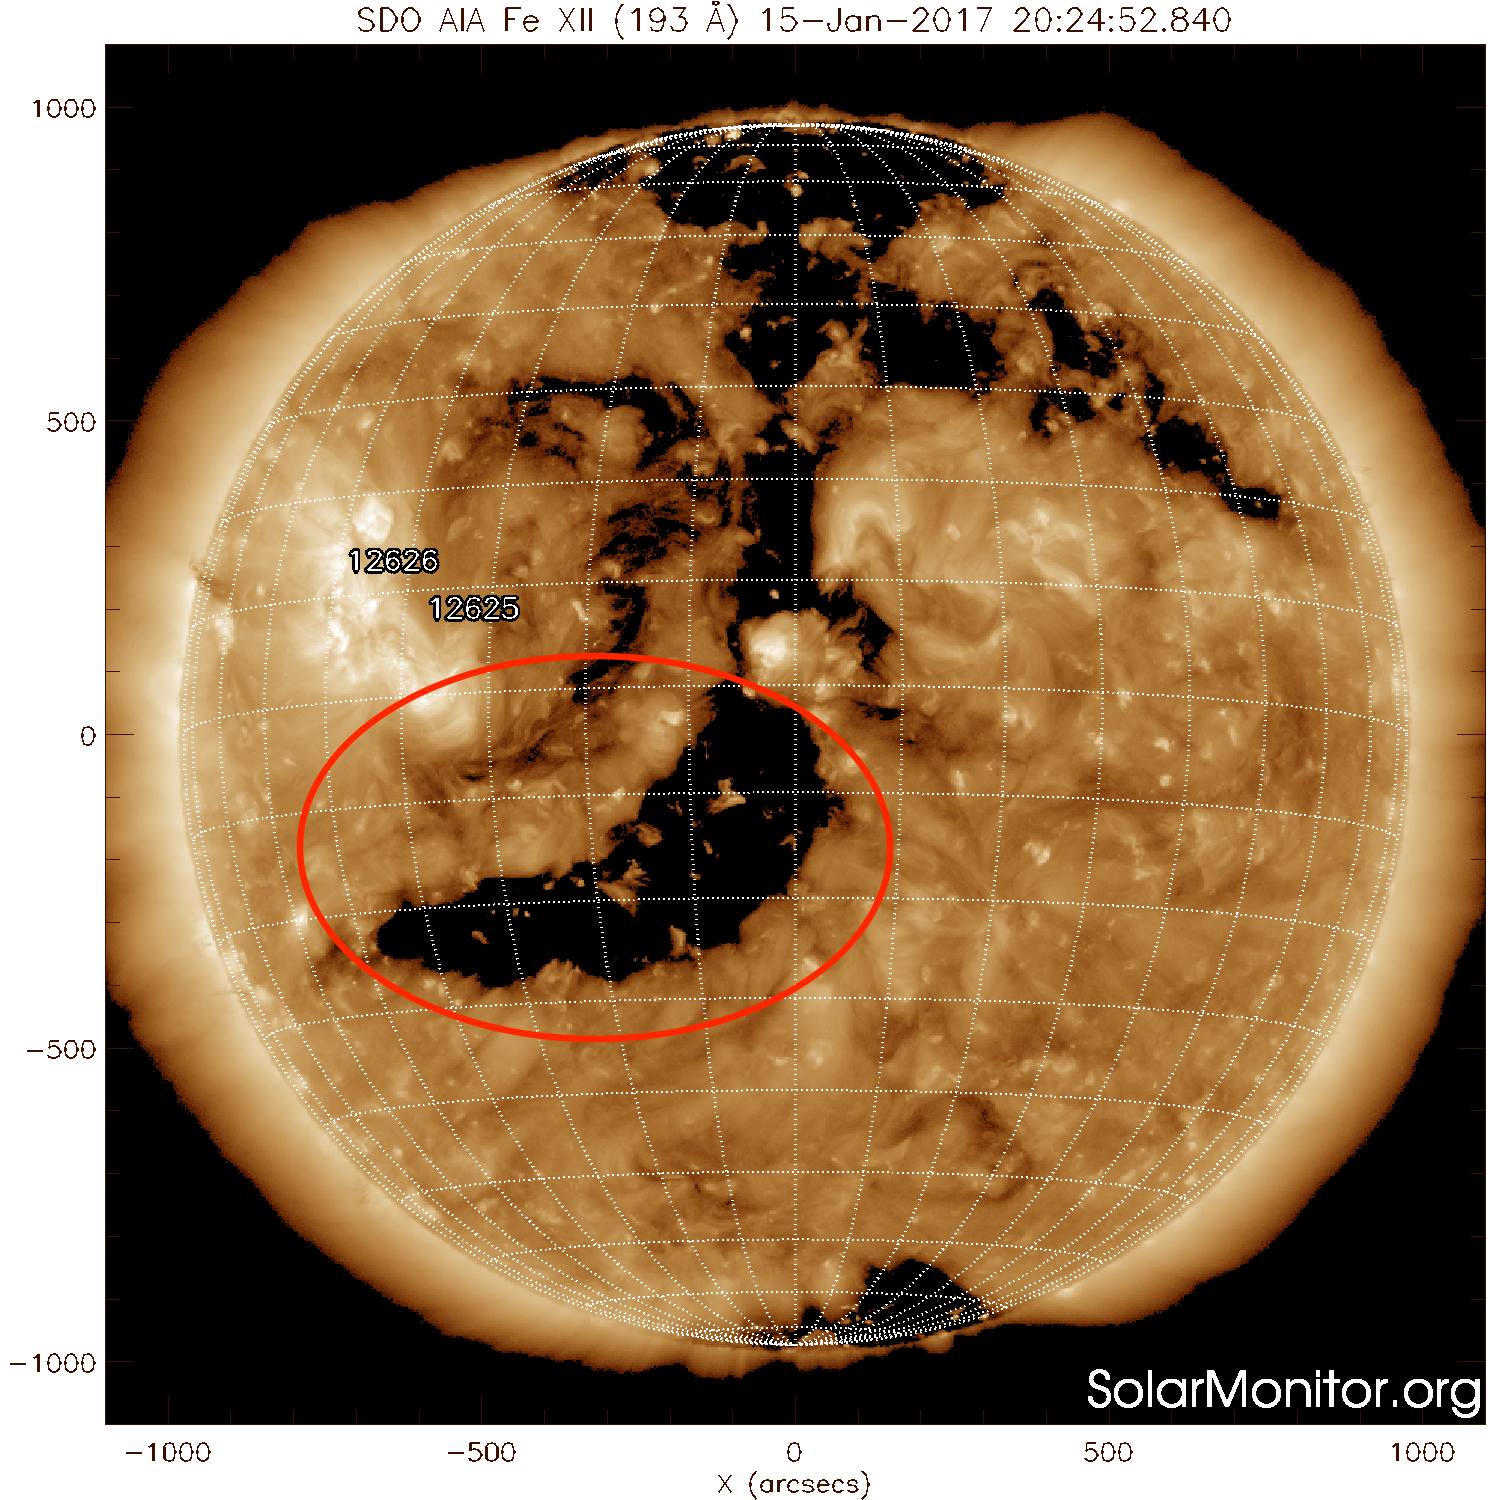
The equatorial coronal hole with the elongated extension towards the south, reached the central meridian on January 16. It was the source of the fast solar wind which influence Earth this week - check the part 'review of geomagnetic activity'.
The International Sunspot Number
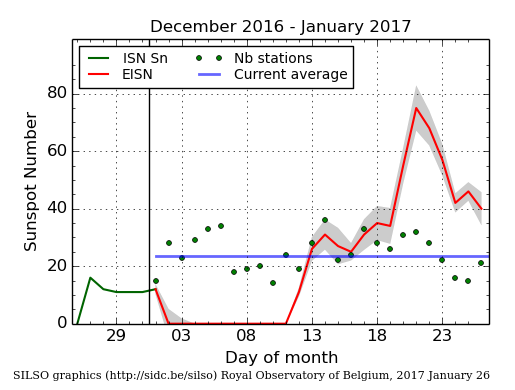
The daily Estimated International Sunspot Number (EISN, red curve with shaded error) derived by a simplified method from real-time data from the worldwide SILSO network. It extends the official Sunspot Number from the full processing of the preceding month (green line). The plot shows the last 30 days (about one solar rotation). The horizontal blue line shows the current monthly average, while the green dots give the number of stations included in the calculation of the EISN for each day.
Review of geomagnetic activity
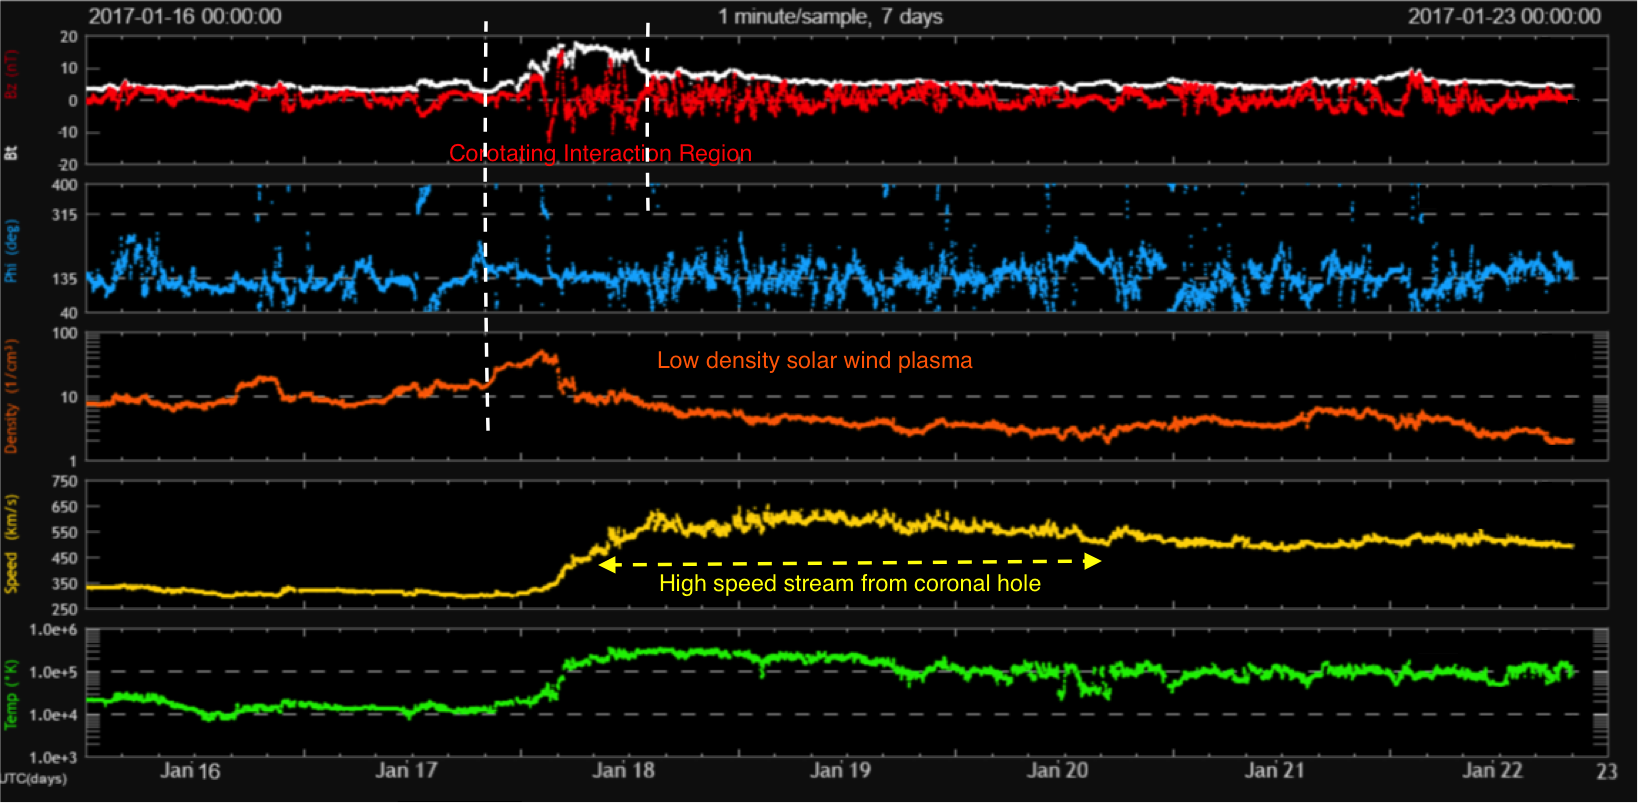
At the beginning of the week Earth was inside a slow solar wind flow. January 17, the solar wind speeded up, simultaneously with the temperature and the interplanetary magnetic field magnitude (up to 18 nT). The density lowered as expected when a fast solar wind arrives. In the afternoon of January 18, solar wind speed reached the maximum value of about 620 km/s. This speed was maintained for the next two days. The last two days of the week, the solar wind speed decreased slightly to 500 km/s.
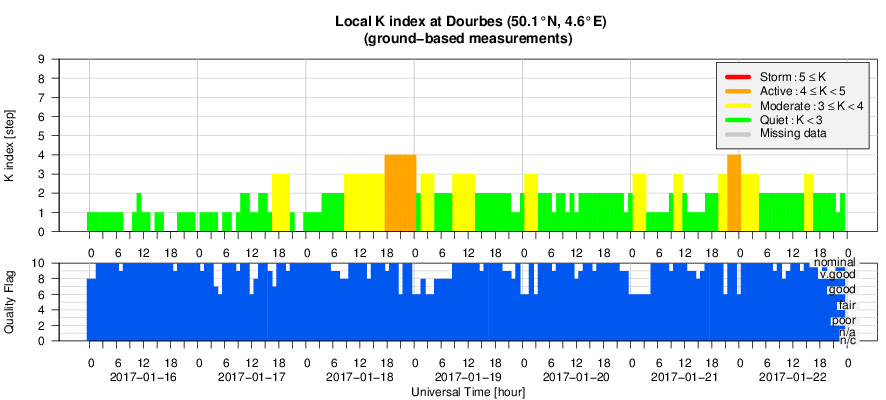
Due to intervals of negative values of the Bz component of the interplanetary magnetic field and the fast solar wind, active geomagnetic conditions were reported in the evening of January 18 and around midnight of January 21 (local station at Dourbes reported K=4 and NOAA reported Kp=4).
Geomagnetic Observations at Dourbes (16 Jan 2017 - 22 Jan 2017)
Review of ionospheric activity (16 Jan 2017 - 22 Jan 2017)
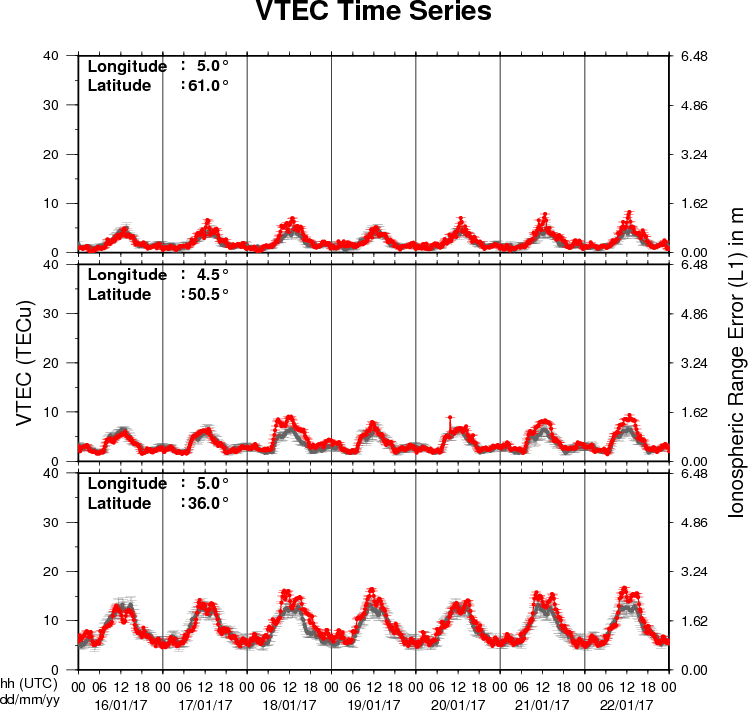
The figure shows the time evolution of the Vertical Total Electron Content (VTEC) (in red) during the last week at three locations:
a) in the northern part of Europe(N61°, 5°E)
b) above Brussels(N50.5°, 4.5°E)
c) in the southern part of Europe(N36°, 5°E)
This figure also shows (in grey) the normal ionospheric behaviour expected based on the median VTEC from the 15 previous days.
The VTEC is expressed in TECu (with TECu=10^16 electrons per square meter) and is directly related to the signal propagation delay due to the ionosphere (in figure: delay on GPS L1 frequency).
The Sun's radiation ionizes the Earth's upper atmosphere, the ionosphere, located from about 60km to 1000km above the Earth's surface.The ionization process in the ionosphere produces ions and free electrons. These electrons perturb the propagation of the GNSS (Global Navigation Satellite System) signals by inducing a so-called ionospheric delay.
See http://stce.be/newsletter/GNSS_final.pdf for some more explanations ; for detailed information, see http://gnss.be/ionosphere_tutorial.php
Future Events
For more details, see http://www.spaceweather.eu/en/event/future
International CCMC-LWS Workshop in Cape Canaveral, Florida (USA)
Start : 2017-04-03 - End : 2017-04-07
The goal of this working meeting is to address the need to
quantify and to track progress over time in the field of space
weather and to establish internationally recognized metrics that
are meaningful to end-users and developers. Defining a set of
appropriate metrics is important to track advancements in space
weather understanding and predictive capabilities.
This meeting is a part of the unfolding activities of the
International Forum for Space Weather Capabilities Assessment that
brings together space environment experts, model and application
developers, data providers, forecasters and end-users. The goals of
this community-wide forum include addressing challenges in
model-data comparisons and evaluating the current state of space
environment predictive capabilities. Workshop attendance is
encouraged but is not a requirement for joining forum teams.
Website:
http://ccmc.gsfc.nasa.gov/CCMC-LWS_Meeting/
Solar Orbiter Workshop 7: Exploring the solar environs in Granada, Spain
Start : 2017-04-03 - End : 2017-04-06
This event will be hosted by the Instituto de Astrofisica de
Andalucia - CSIC. Please mind that on April 7th the 20th SWT
meeting will take place at the same venue.
Website: Unkown
URSI General Assembly in Montreal, Canada
Start : 2017-08-19 - End : 2017-08-26
For the thirty-second time since the inception of URSI, Radio
Scientists from across the world will get together for the URSI
General Assembly and Scientific Symposium. This triennial gathering
will take place from 19th to 26th of August 2017, in Montreal,
Canada. This conference is a unique opportunity to learn about
recent advances in all fields of Radio Science, as covered by all
ten URSI Commissions.
Among the different sessions, please note:
* 'Radio Science for Space Weather'
Conveners: M. Messerotti, V. Pierrard
* 'Remote Sensing and Modeling of the Earth's Plasmasphere
and Plasmapause'
Conveners: A. M. Jorgensen, V. Pierrard, B. Heilig
The abstract deadline is 30 January 2017
Website: http://www.ursi2017.org
Workshops on Radiation Monitoring for the International Space Station in Torino, Italy
Start : 2017-09-05 - End : 2017-09-07
The Workshop on Radiation Monitoring for the International Space
Station is an annual meeting to discuss the scientific definition
of an adequate radiation monitoring package and its use by the
scientific community on the ISS. Types of instruments and research
topics need to be defined in order to optimise the radiation safety
of the ISS crew.
Website: http://wrmiss.org/
European Space Weather Week 14
Start : 2017-11-27 - End : 2017-12-01
The ESWW is the main annual event in the European Space Weather
calendar. It is the European forum for Space Weather as proven by
the high attendance to the past editions. The agenda will be
composed of plenary/parallel sessions, working meetings and
dedicated events for service end-users. The ESWW will again adopt
the central aim of bringing together the diverse groups in Europe
working on different aspects of Space Weather.
Website:
http://www.stce.be/esww14/