- Table of Content
- 1.A stretched co...
- 2.PROBA2 Observa...
- 3.Review of sola...
- 4.The Internatio...
- 5.Geomagnetic Ob...
- 6.Review of iono...
- 7.Future Events
2. PROBA2 Observations (13 Feb 2017 - 19 Feb 2017)
3. Review of solar and geomatic activity
4. The International Sunspot Number
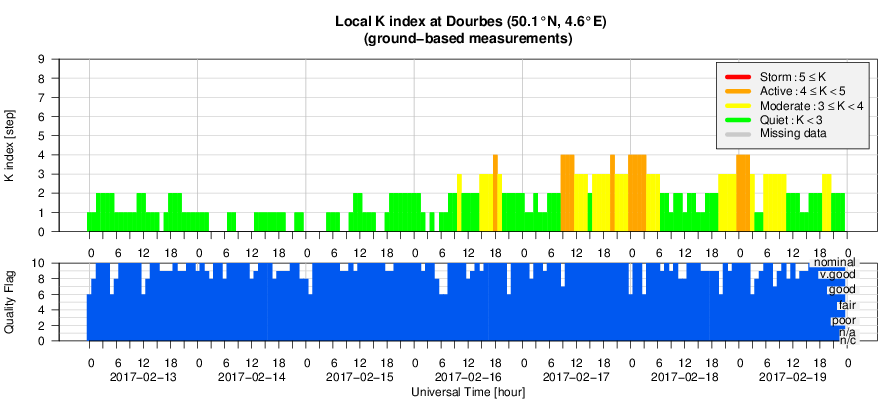
5. Geomagnetic Observations at Dourbes (13 Feb 2017 - 19 Feb 2017)
6. Review of ionospheric activity (13 Feb 2017 - 19 Feb 2017)
7. Future Events
A stretched coronal hole
Once again, a coronal hole (CH) is making the headlines! This time, it is not its surface area or the speed of the associated particle stream that is particularly impressive, but its width. Coronal holes are regions in the hot solar atmosphere ("corona") where the plasma density at that temperature is very low compared to its surroundings, and thus they look like dark shapes in the corona. Linked to unipolar, open magnetic fields stretching into space, they are the source of the high-speed solar wind and can create geomagnetic disturbances. The wider the coronal hole, the longer any effects of the high speed stream will last.
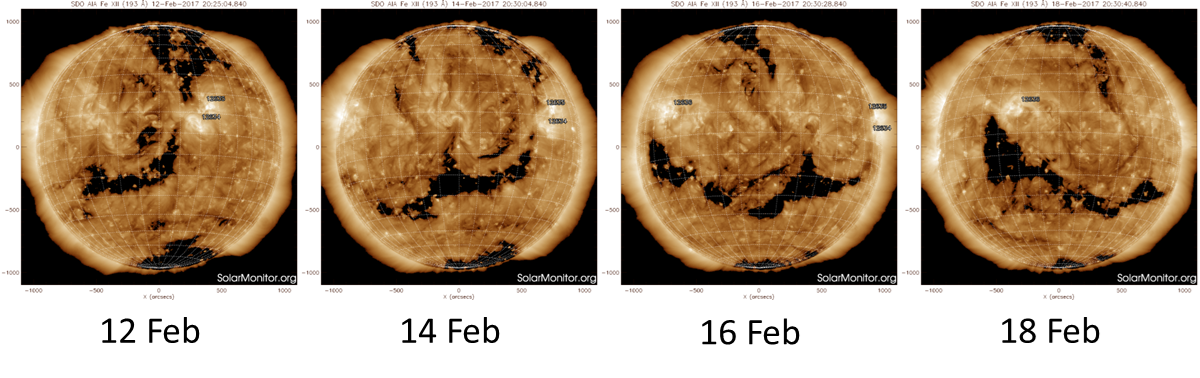
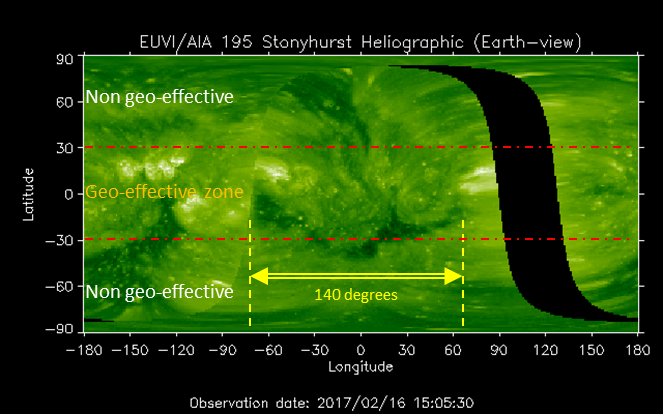
The figure above shows the Sun in extreme ultraviolet (EUV) as seen with SDO's AIA instrument at 19.3nm, corresponding to temperatures in the corona of more than 1 million degrees. It shows the coronal hole as it transits the central meridian from 12 till 18 February, with an interval of 2 days. Unlike the usual polar extensions and trans-equatorial CHs, which are long and generally extending in the north-south direction, this CH is long too but extending in the east-west direction. In fact, as can be seen from the EUV synoptic map underneath, this particular CH stretches about 140 degrees, or more than a third of the solar circumference. This means a length of at least 1.5 million km or more than 4 times the earth-moon distance.
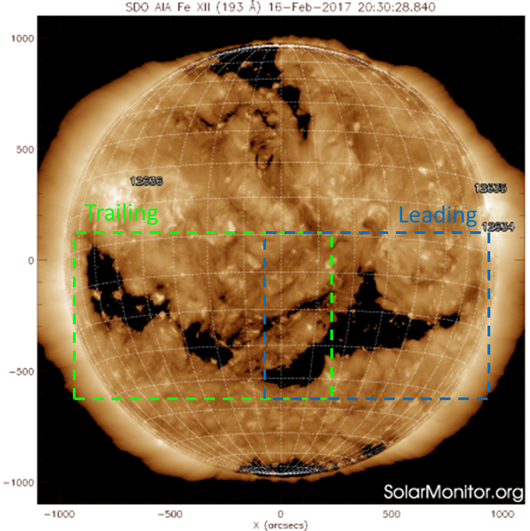
The CH has the same magnetic polarity as the northern polar CH. In fact, the leading part of the current elongated CH developed from the remnants of the extension from the northern polar CH. The trailing portion of the elongated CH developed from a small, isolated equatorial CH. Hence, the CH started to develop late November from these isolated patches, and continued to grow and reaching out to each other since. The image underneath shows the leading and trailing portion of the CH on 16 February, with the subsequent images showing the Sun in EUV one Carrington rotation apart, with the top and bottom row picturing respectively the trailing and leading portions of the CH.
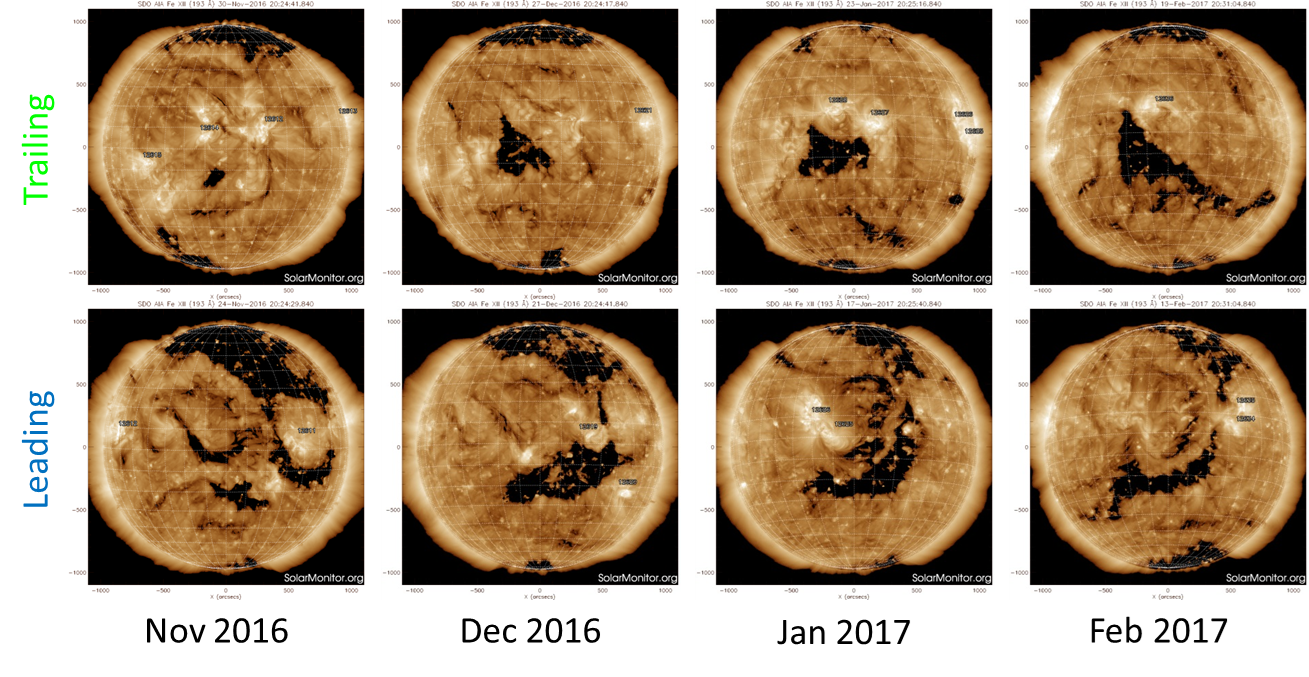
Such stretched CHs usually result in long lasting effects from the associated high speed stream (HSS). However, in this case, the middle portion of this stretched CH is narrow and relatively far away from the solar equator (35-40 degrees), which is believed too far south to be in a geo-effective position. Hence, the HSS from the leading portion of the CH started to influence the earth environment on 17 February, with maximum speeds near 600 km/s. The wind speed then gradually decreased till background values of 450 km/s late on 20 February. The wind speed is expected to pick up again around 23-24 February, following the arrival of the HSS related to the trailing portion of the CH.
PROBA2 Observations (13 Feb 2017 - 19 Feb 2017)
Solar Activity
Solar flare activity was very low during the week.
In order to view the activity of this week in more detail, we suggest to go to the following website from which all the daily (normal and difference) movies can be accessed: http://proba2.oma.be/ssa
This page also lists the recorded flaring events.
A weekly overview movie can be found here (SWAP week 360):
http://proba2.oma.be/swap/data/mpg/movies/weekly_movies/weekly_movie_2017_02_13.mp4
Details about some of this week's events, can be found further below.
If any of the linked movies are unavailable they can be found in the P2SC movie repository here:
http://proba2.oma.be/swap/data/mpg/movies/
Friday Feb 17
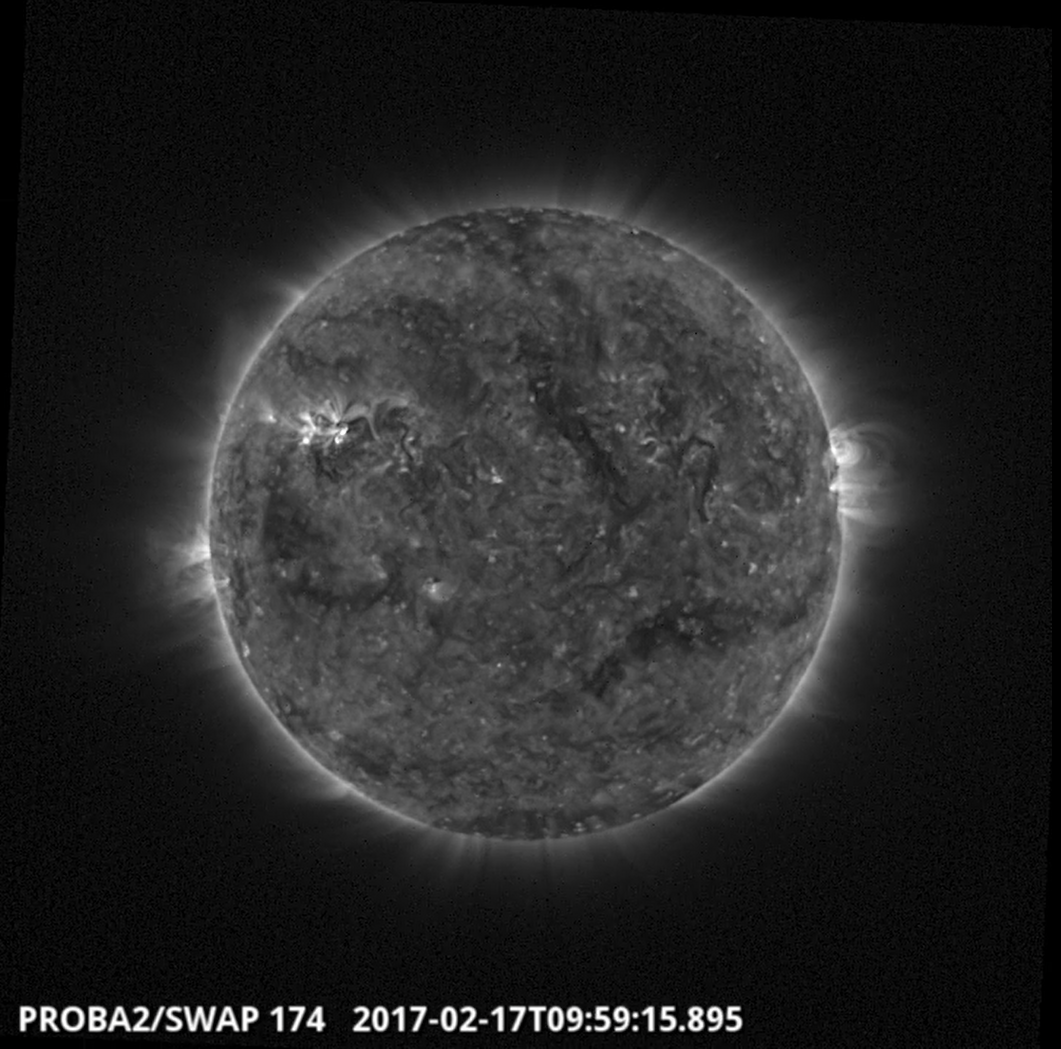
AR 2636 produced four B-Class flares over the week. This active region is visible above in the North-East part of the Sun flaring at 09:59 UT on 2017-Feb-17.
Find a movie of the event here (SWAP movie):
http://proba2.oma.be/swap/data/mpg/movies/20170217_swap_movie.mp4
Sunday Feb 19
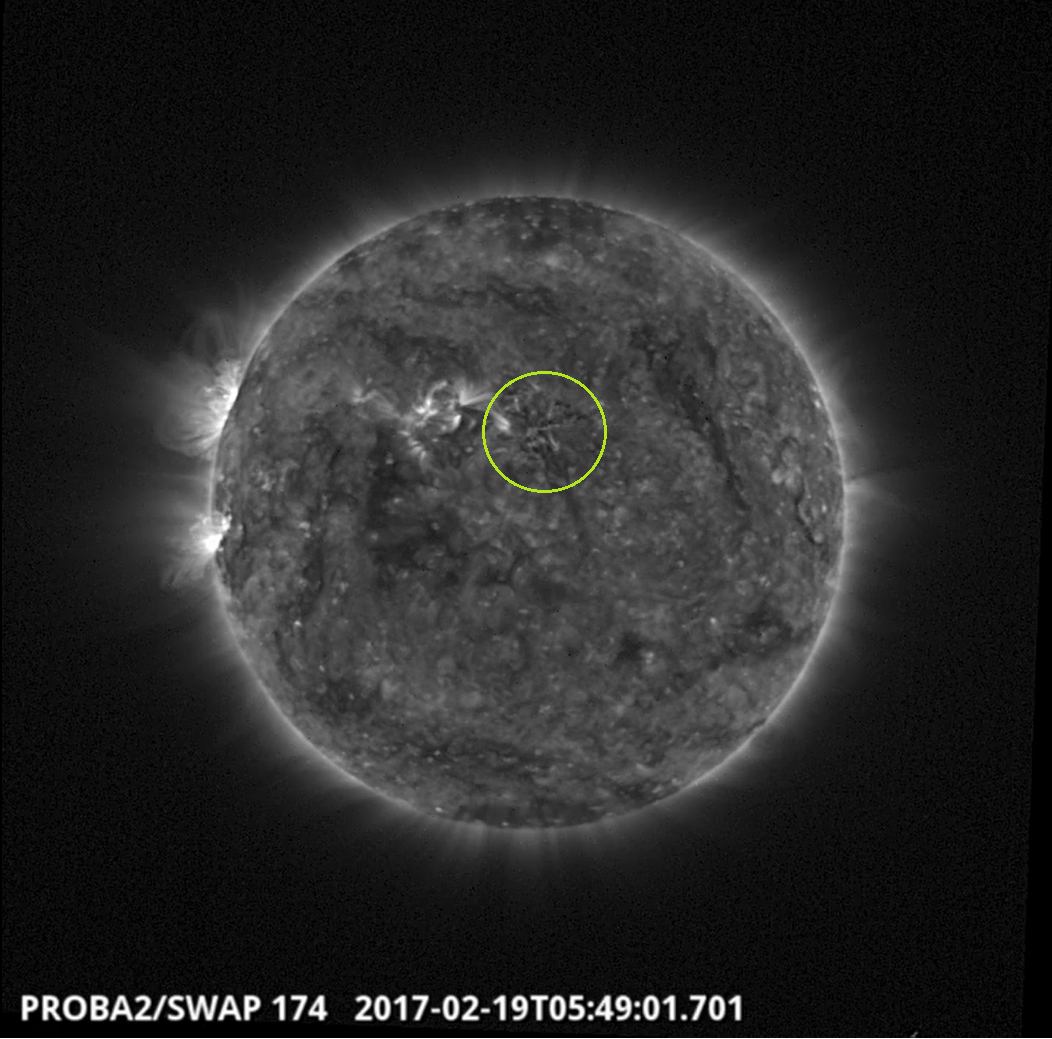
A filament eruption was observed by SWAP near the centre of the solar disk on 2017-Feb-19 at 05:49 UT.
Find a movie of the event here (SWAP movie):
http://proba2.oma.be/swap/data/mpg/movies/20170219_swap_movie.mp4
Review of solar and geomatic activity
SOLAR ACTIVITY
The GOES X-ray background was near A7 level until February 17, when it gradually rose to about B1 level. From the start of the week, beta region NOAA AR 2635 was visible until it rotated behind the west limb as an alpha region. Alpha region AR 2636 emerged on February 16 and became a beta region on February 18. None of these regions produced any flaring above B4 level. A filament eruption was observed west of NOAA AR 2636 in ground-based H alpha images and HeII AIA images around 5:20 UT on February 19. The associated CME was very faint and is not expected to be Earthbound.
GEOMAGNETIC ACTIVITY
The week has been geomagnetically quiet until the arrival of the high speed stream from a positive coronal hole near 6:20 UT on February 16. Solar wind speed increased to peak values near 620 km/s on February 19, while the magnitude of the Interplanetary Magnetic Field (IMF) varied between about 1 and 13 nT. Since there were no extended periods when the Bz component of the IMF was below -5 nT, the geomagnetic effect of the high speed stream was limited to some active intervals (K Dourbes = 4).
Download the running presentation of the Monday briefing - http://www.stce.be/movies/SIDCbriefing-20170220.ppsm
The International Sunspot Number
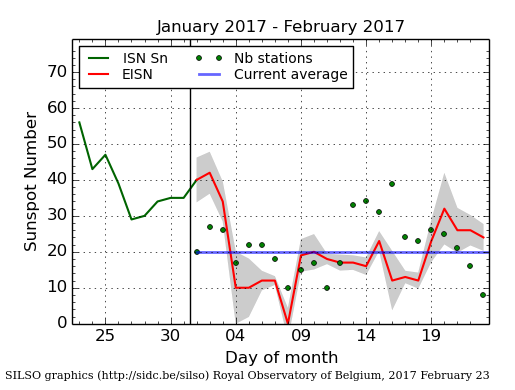
The daily Estimated International Sunspot Number (EISN, red curve with shaded error) derived by a simplified method from real-time data from the worldwide SILSO network. It extends the official Sunspot Number from the full processing of the preceding month (green line). The plot shows the last 30 days (about one solar rotation). The horizontal blue line shows the current monthly average, while the green dots give the number of stations included in the calculation of the EISN for each day.
Geomagnetic Observations at Dourbes (13 Feb 2017 - 19 Feb 2017)
Review of ionospheric activity (13 Feb 2017 - 19 Feb 2017)
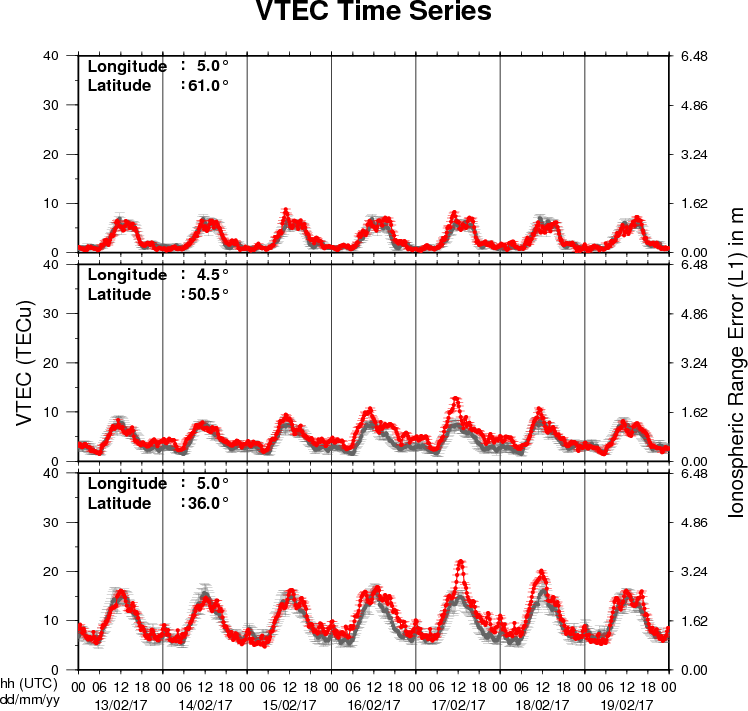
The figure shows the time evolution of the Vertical Total Electron Content (VTEC) (in red) during the last week at three locations:
a) in the northern part of Europe(N61°, 5°E)
b) above Brussels(N50.5°, 4.5°E)
c) in the southern part of Europe(N36°, 5°E)
This figure also shows (in grey) the normal ionospheric behaviour expected based on the median VTEC from the 15 previous days.
The VTEC is expressed in TECu (with TECu=10^16 electrons per square meter) and is directly related to the signal propagation delay due to the ionosphere (in figure: delay on GPS L1 frequency).
The Sun's radiation ionizes the Earth's upper atmosphere, the ionosphere, located from about 60km to 1000km above the Earth's surface.The ionization process in the ionosphere produces ions and free electrons. These electrons perturb the propagation of the GNSS (Global Navigation Satellite System) signals by inducing a so-called ionospheric delay.
See http://stce.be/newsletter/GNSS_final.pdf for some more explanations ; for detailed information, see http://gnss.be/ionosphere_tutorial.php
Future Events
For more details, see http://www.spaceweather.eu/en/event/future
International CCMC-LWS Workshop in Cape Canaveral, Florida (USA)
Start : 2017-04-03 - End : 2017-04-07
The goal of this working meeting is to address the need to
quantify and to track progress over time in the field of space
weather and to establish internationally recognized metrics that
are meaningful to end-users and developers. Defining a set of
appropriate metrics is important to track advancements in space
weather understanding and predictive capabilities.
This meeting is a part of the unfolding activities of the
International Forum for Space Weather Capabilities Assessment that
brings together space environment experts, model and application
developers, data providers, forecasters and end-users. The goals of
this community-wide forum include addressing challenges in
model-data comparisons and evaluating the current state of space
environment predictive capabilities. Workshop attendance is
encouraged but is not a requirement for joining forum teams.
Website:
http://ccmc.gsfc.nasa.gov/CCMC-LWS_Meeting/
Solar Orbiter Workshop 7: Exploring the solar environs in Granada, Spain
Start : 2017-04-03 - End : 2017-04-06
This event will be hosted by the Instituto de Astrofisica de
Andalucia - CSIC. Please mind that on April 7th the 20th SWT
meeting will take place at the same venue.
Website: Unkown
URSI General Assembly in Montreal, Canada
Start : 2017-08-19 - End : 2017-08-26
For the thirty-second time since the inception of URSI, Radio
Scientists from across the world will get together for the URSI
General Assembly and Scientific Symposium. This triennial gathering
will take place from 19th to 26th of August 2017, in Montreal,
Canada. This conference is a unique opportunity to learn about
recent advances in all fields of Radio Science, as covered by all
ten URSI Commissions.
Among the different sessions, please note:
* 'Radio Science for Space Weather'
Conveners: M. Messerotti, V. Pierrard
* 'Remote Sensing and Modeling of the Earth's Plasmasphere
and Plasmapause'
Conveners: A. M. Jorgensen, V. Pierrard, B. Heilig
The abstract deadline is 30 January 2017
Website: http://www.ursi2017.org
2017 Joint IAPSO-IAMAS-IAGA Assembly in Cape Town, South Africa
Start : 2017-08-27 - End : 2017-09-01
The Joint IAPSO-IAMAS-IAGA Assembly, endorsed by the University
of Cape Town and the South African Department of Science and
Technology, will take place from 27 August to 1 September 2017 at
the Cape Town International Convention Centre (CTICC). Several IAGA
and IAMAS sessions are of Space Weather interests as well as the
joint session 'Space Weather throughout the Solar System: Bringing
Data and Models together'.
Website:
http://iapso-iamas-iaga2017.com/index.php
Workshops on Radiation Monitoring for the International Space Station in Torino, Italy
Start : 2017-09-05 - End : 2017-09-07
The Workshop on Radiation Monitoring for the International Space
Station is an annual meeting to discuss the scientific definition
of an adequate radiation monitoring package and its use by the
scientific community on the ISS. Types of instruments and research
topics need to be defined in order to optimise the radiation safety
of the ISS crew.
Website: http://wrmiss.org/
European Space Weather Week 14
Start : 2017-11-27 - End : 2017-12-01
The ESWW is the main annual event in the European Space Weather
calendar. It is the European forum for Space Weather as proven by
the high attendance to the past editions. The agenda will be
composed of plenary/parallel sessions, working meetings and
dedicated events for service end-users. The ESWW will again adopt
the central aim of bringing together the diverse groups in Europe
working on different aspects of Space Weather.
Website:
http://www.stce.be/esww14/