- Table of Content
- 1.Coming closer ...
- 2.PROBA2 Observa...
- 3.Review of sola...
- 4.The Internatio...
- 5.Geomagnetic Ob...
- 6.The SIDC space...
- 7.Review of iono...
2. PROBA2 Observations (30 Dec 2019 - 5 Jan 2020)
3. Review of solar and geomagnetic activity (30 Dec 2019 - 5 Jan 2020)
4. The International Sunspot Number by SILSO
5. Geomagnetic Observations at Dourbes (30 Dec 2019 - 5 Jan 2020)
6. The SIDC space weather Briefing
7. Review of ionospheric activity (30 Dec 2019 - 5 Jan 2020)
Coming closer to the launch date, February 6
Solar Orbiter, carrying in its inside our beloved EUI-telescope has completed several steps in the launch-trajectory.
left: the box with Solar Orbiter is being unloaded from the plane,
top right: Solar Orbiter has been unpacked and is waiting for the next thing to happen - you see the heath shield nicely packed
bottom right: the Atlas V rochet which will bring Solar Orbiter to space.
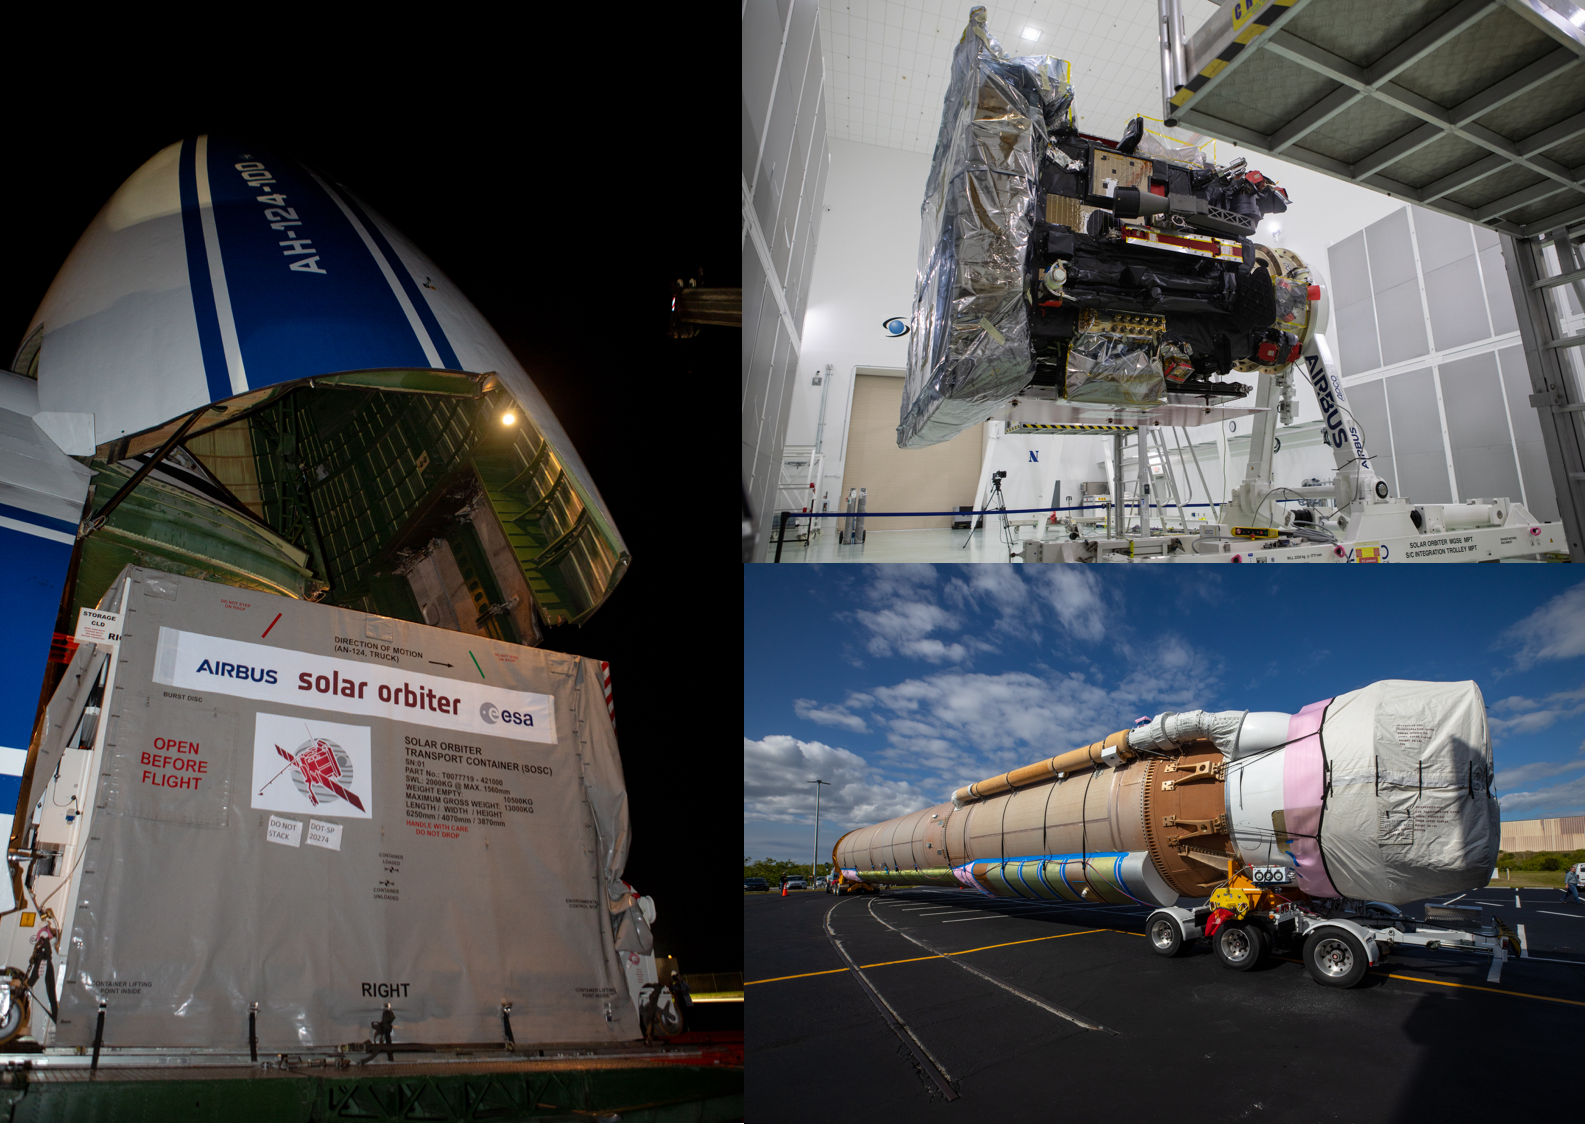
Getting more and more excited and nervous!
PROBA2 Observations (30 Dec 2019 - 5 Jan 2020)
Solar Activity
Solar flare activity remained very low during the week.
In order to view the activity of this week in more detail, we suggest to go to the following website from which all the daily (normal and difference) movies can be accessed: https://proba2.oma.be/ssa
This page also lists the recorded flaring events.
A weekly overview movie can be found here (SWAP week 510): https://proba2.sidc.be/swap/data/mpg/movies/weekly_movies/weekly_movie_2019_12_30.mp4
Details about some of this week's events can be found further below.
If any of the linked movies are unavailable they can be found in the P2SC movie repository here: https://proba2.oma.be/swap/data/mpg/movies/
Friday Jan 03

The only flare of the week was an A-class (A1.0) flare produced by NOAA AR2755 and was observed by SWAP on 2020-Jan-03. The flare is visible in the south-east of the solar disk in the SWAP image above taken at 21:02 UT.
Find a movie of the event here (SWAP movie): http://proba2.oma.be/swap/movies/20200103_swap_movie.mp4
Review of solar and geomagnetic activity (30 Dec 2019 - 5 Jan 2020)
SOLAR ACTIVITY
Beta region NOAA 2755 was the only sunspot region of the week, and rotated into sight at the East limb in the middle of the week.
No B flares or brighter were measured. The GOES X-ray flux background was around A1 level.
No Earth-directed CMEs were detected and the greater than 10 MeV proton flux was at nominal level.
GEOMAGNETIC ACTIVITY
The solar wind as registered by ACE was at nominal to slightly enhanced levels, until the arrival of a high speed stream associated with an extension of the south polar coronal hole on January 5. On that date, the solar wind speeded up to about 550 km/s and Interplanetary Magnetic Field magnitudes up to about 15 nT were registered.
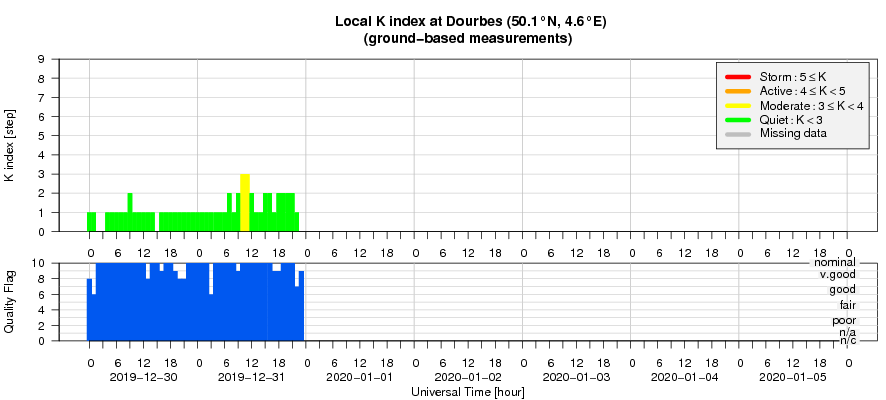
Quiet to unsettled geomagnetic levels were registered (K Dourbes and NOAA Kp below 4), with occasional active intervals (K Dourbes and NOAA Kp = 4) on January 5.
The International Sunspot Number by SILSO
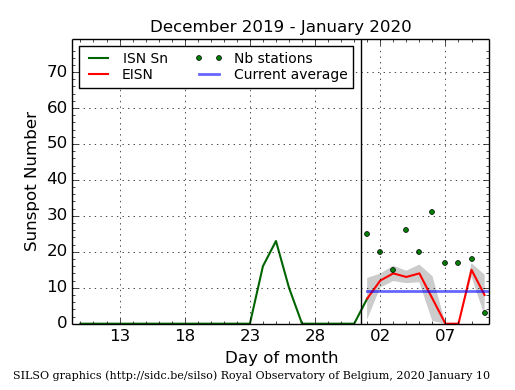
The daily Estimated International Sunspot Number (EISN, red curve with shaded error) derived by a simplified method from real-time data from the worldwide SILSO network. It extends the official Sunspot Number from the full processing of the preceding month (green line). The plot shows the last 30 days (about one solar rotation). The horizontal blue line shows the current monthly average, while the green dots give the number of stations included in the calculation of the EISN for each day.
Geomagnetic Observations at Dourbes (30 Dec 2019 - 5 Jan 2020)
The SIDC space weather Briefing
The Space Weather Briefing presented by the forecaster on duty from 29 December to 5 January. It reflects in images and graphs what is written in the Solar and Geomagnetic Activity report.
The pdf-version: http://www.stce.be/briefings/20200106_SWbriefing.pdf
The automatically running presentation: http://www.stce.be/briefings/20200106_SWbriefing.ppsm
Review of ionospheric activity (30 Dec 2019 - 5 Jan 2020)
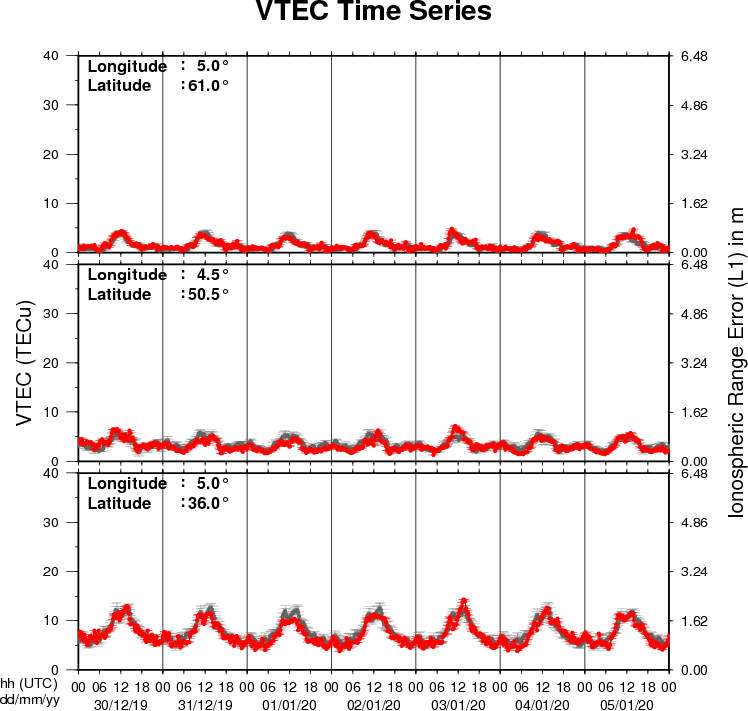
The figure shows the time evolution of the Vertical Total Electron Content (VTEC) (in red) during the last week at three locations:
a) in the northern part of Europe(N61°, 5°E)
b) above Brussels(N50.5°, 4.5°E)
c) in the southern part of Europe(N36°, 5°E)
This figure also shows (in grey) the normal ionospheric behaviour expected based on the median VTEC from the 15 previous days.
The VTEC is expressed in TECu (with TECu=10^16 electrons per square meter) and is directly related to the signal propagation delay due to the ionosphere (in figure: delay on GPS L1 frequency).
The Sun's radiation ionizes the Earth's upper atmosphere, the ionosphere, located from about 60km to 1000km above the Earth's surface.The ionization process in the ionosphere produces ions and free electrons. These electrons perturb the propagation of the GNSS (Global Navigation Satellite System) signals by inducing a so-called ionospheric delay.
See http://stce.be/newsletter/GNSS_final.pdf for some more explanations ; for detailed information, see http://gnss.be/ionosphere_tutorial.php