- Table of Content
- 1.Counting down ...
- 2.Safety in airs...
- 3.Review of sola...
- 4.The Internatio...
- 5.PROBA2 Observa...
- 6.Review of geom...
- 7.Geomagnetic Ob...
- 8.The SIDC space...
- 9.Review of iono...
2. Safety in airspace - PECASUS
3. Review of solar activity
4. The International Sunspot Number by SILSO
5. PROBA2 Observations (13 Jan 2020 - 19 Jan 2020)
6. Review of geomagnetic activity
7. Geomagnetic Observations at Dourbes (13 Jan 2020 - 19 Jan 2020)
8. The SIDC space weather Briefing
9. Review of ionospheric activity (13 Jan 2020 - 19 Jan 2020)
Counting down to launch
Solar Orbiter will be launched from Cape Canaveral on February 6 with onboard the EUI instrument that will make high resolution EUV pictures from the solar corona and eventually also from its poles. Unique!
Aydin Ergen made this nice tool: a 1:25 scale model of Solar Orbiter.
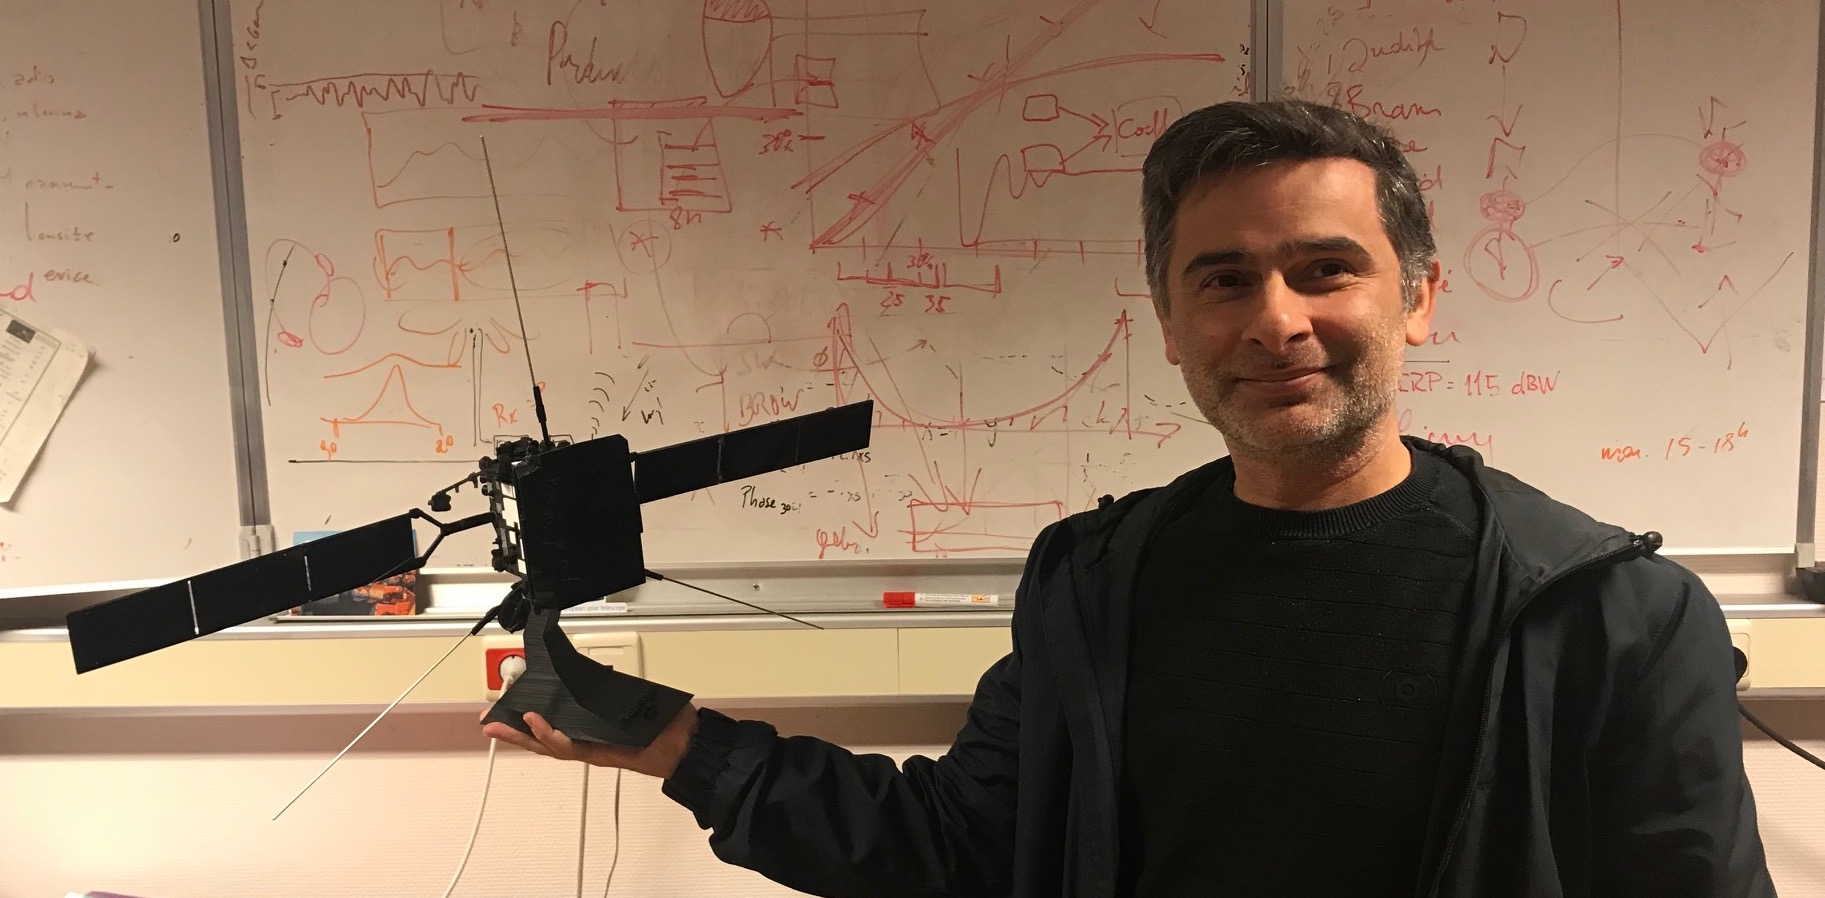
You see antenna's, the solar panels and a heath shield. This shield is needed because Solar Orbiter will come so close to the Sun. Temperatures can rise up to 500°C. The shield has small holes through which the camera's can peek while taking pictures.
The level of excitement increases!
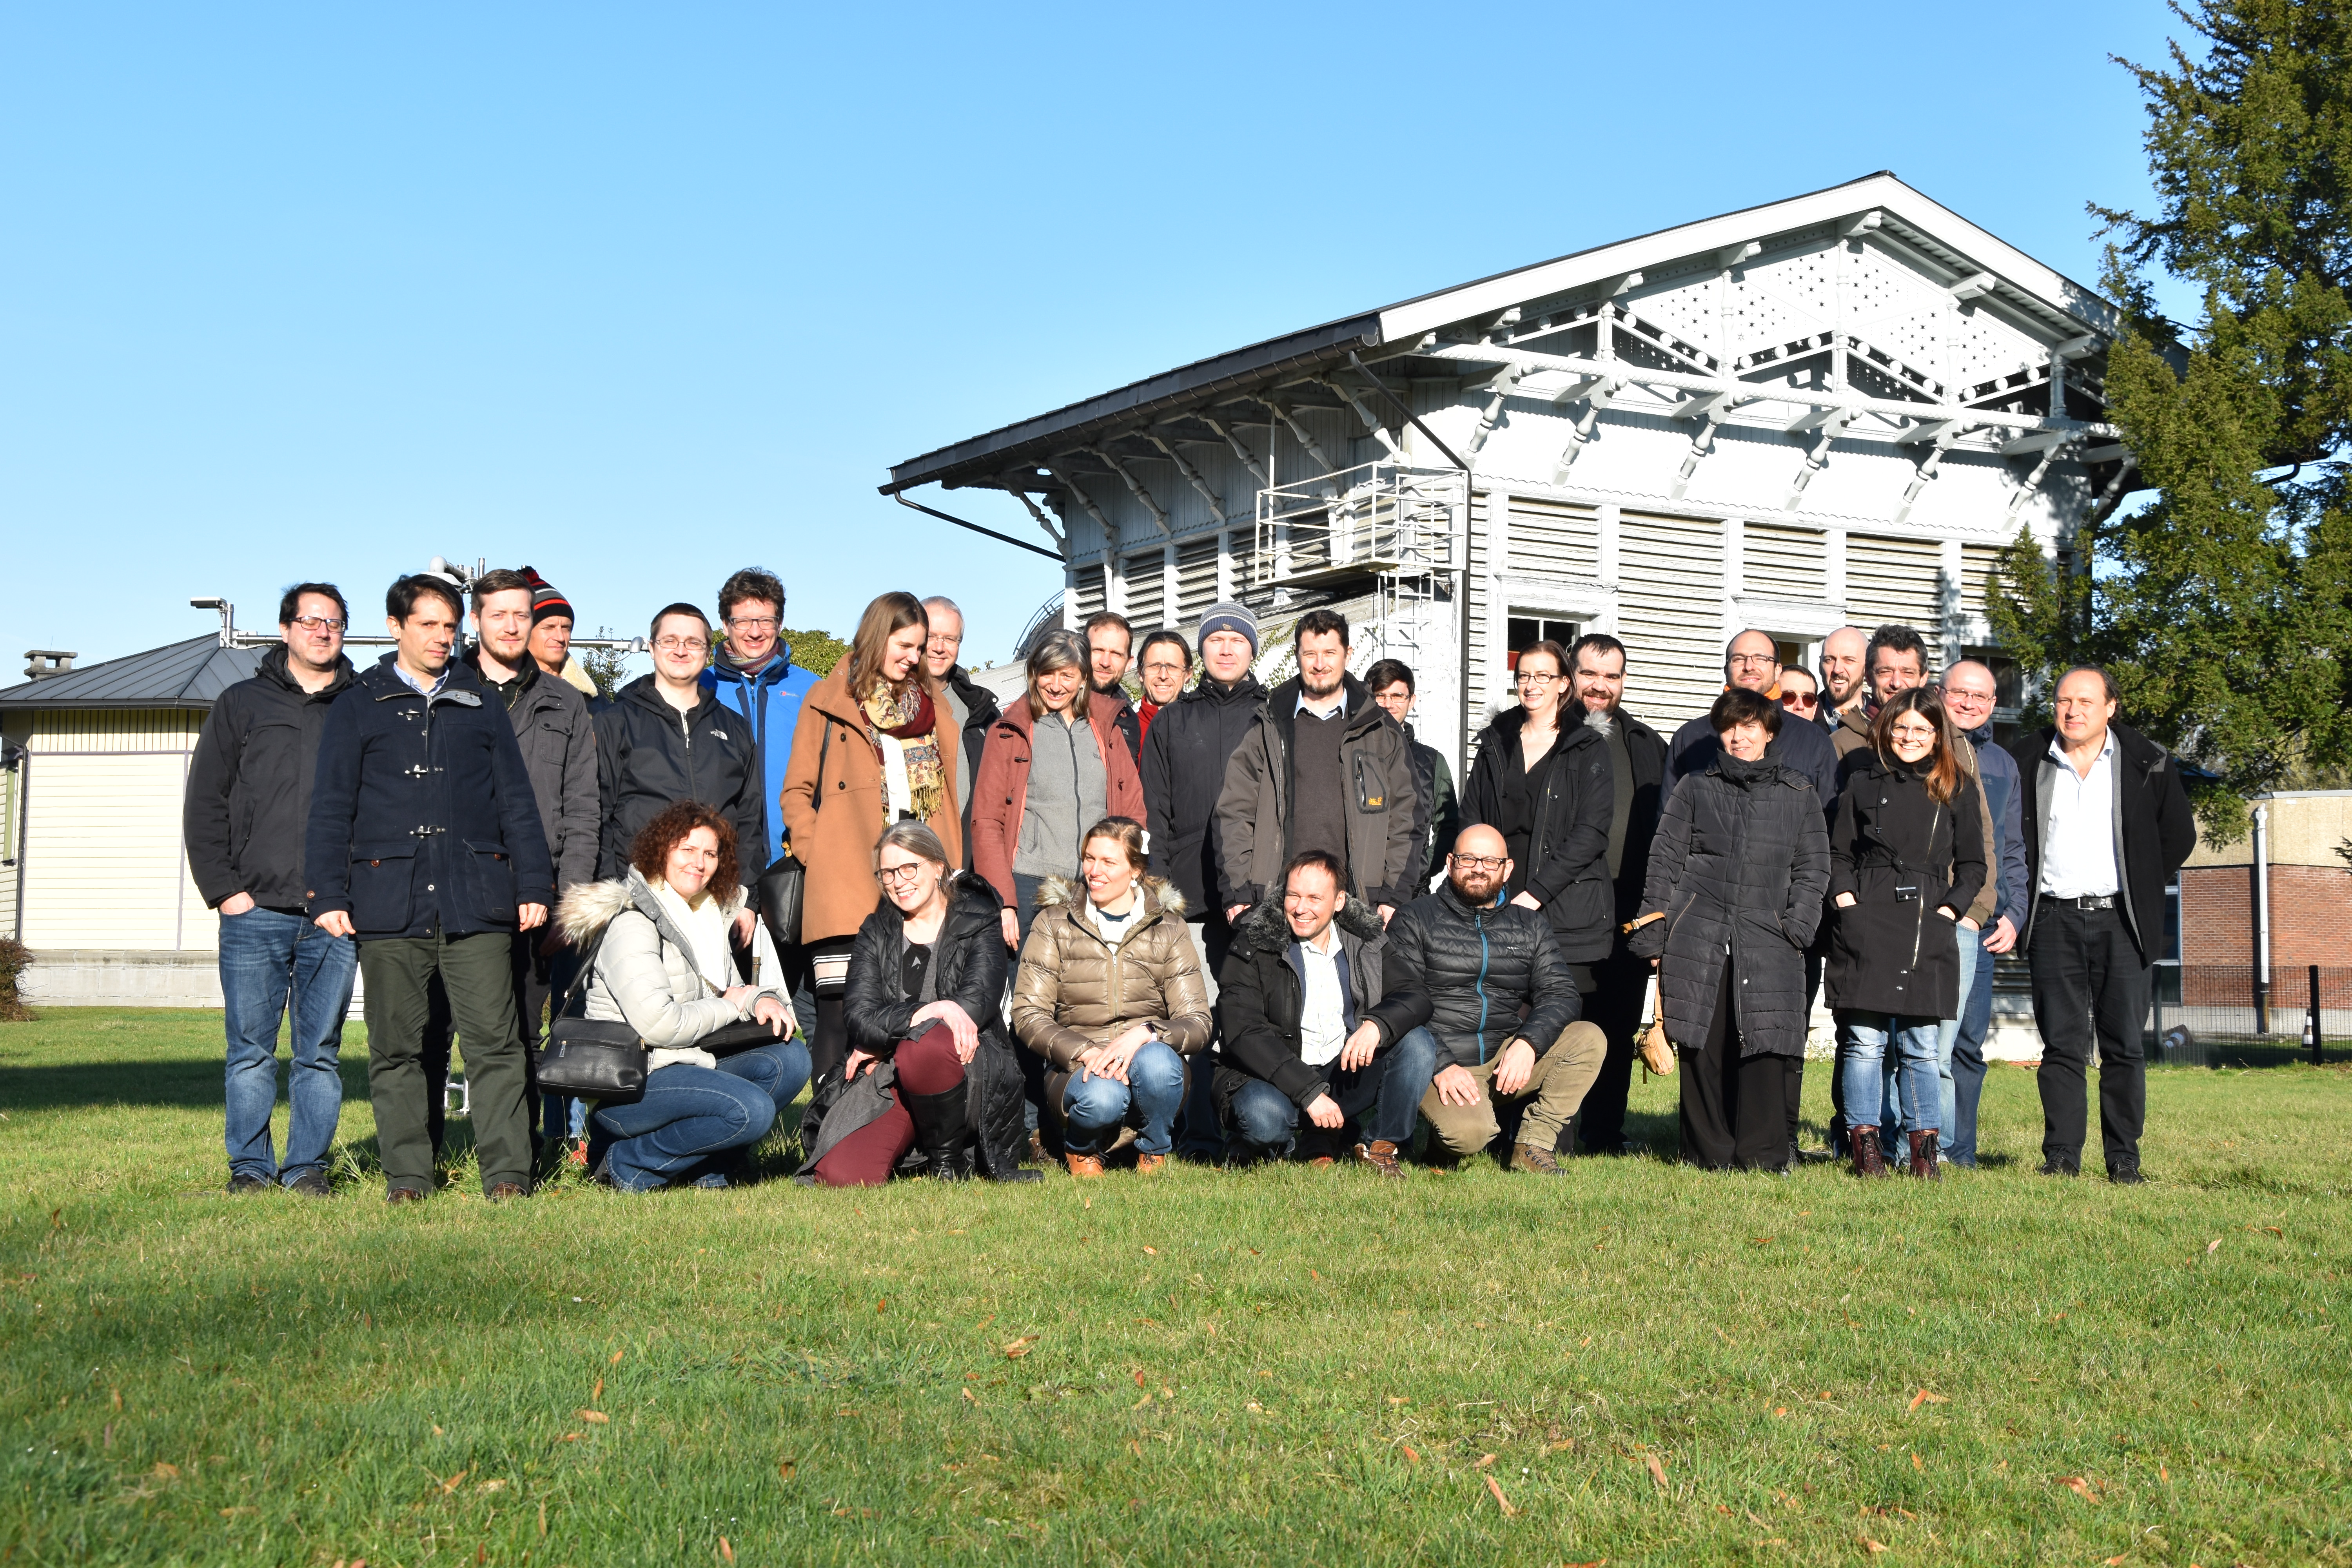
Safety in airspace - PECASUS
Civil aviation is concerned about safety in airspace. Its safety can be endangered by Space Weather.
And then PECASUS comes on stage. PECASUS provides civil aviation with information on space weather that has the potential to affect communications, navigation and the health of passengers and crew.
This week, all the PECASUS partners gathered together to fine-tune the data streams needed to make the alerts in case of danger.
All participants worked really hard to come again closer to a well performing system.
Review of solar activity
Solar flaring activity was very low.
No C-class and B-class flares were reported. No numbered active regions were observed on the visible side of the Sun.
A CME, possibly Earth-directed was observed on January 14. The CME originated from the decaying active region (Catania sunspot group 27) which was at the moment of eruption close to the solar disc center. A coronal dimming and an EUV wave were observed. These are on-disc signatures of the CME, but no CME was observed by the SOHO/LASCO C2 coronagraph. Only a few images from the STEREO/COR2 coronagraph show the presence of a weak, narrow and slow - 200 km/s - CME.
The solar protons remained at the background level during the whole week.
A patchy equatorial coronal hole with negative polarity reached the central meridian on January 16.
The International Sunspot Number by SILSO
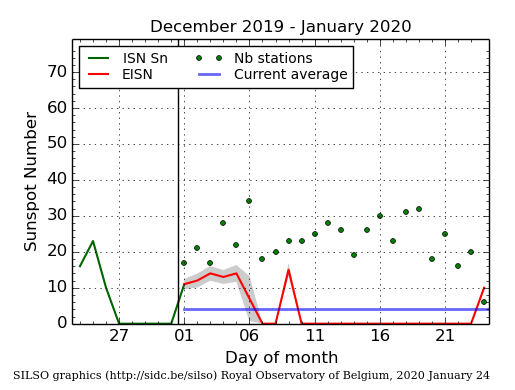
The daily Estimated International Sunspot Number (EISN, red curve with shaded error) derived by a simplified method from real-time data from the worldwide SILSO network. It extends the official Sunspot Number from the full processing of the preceding month (green line). The plot shows the last 30 days (about one solar rotation). The horizontal blue line shows the current monthly average, while the green dots give the number of stations included in the calculation of the EISN for each day.
PROBA2 Observations (13 Jan 2020 - 19 Jan 2020)
Solar Activity
Solar flare activity remained very low during the week.
In order to view the activity of this week in more detail, we suggest to go to the following website from which all the daily (normal and difference) movies can be accessed: https://proba2.oma.be/ssa
This page also lists the recorded flaring events.
A weekly overview movie can be found here (SWAP week 512): https://proba2.sidc.be/swap/data/mpg/movies/weekly_movies/weekly_movie_2020_01_13.mp4
Details about some of this week's events can be found further below.
If any of the linked movies are unavailable they can be found in the P2SC movie repository here: https://proba2.oma.be/swap/data/mpg/movies/
Tuesday Jan 14
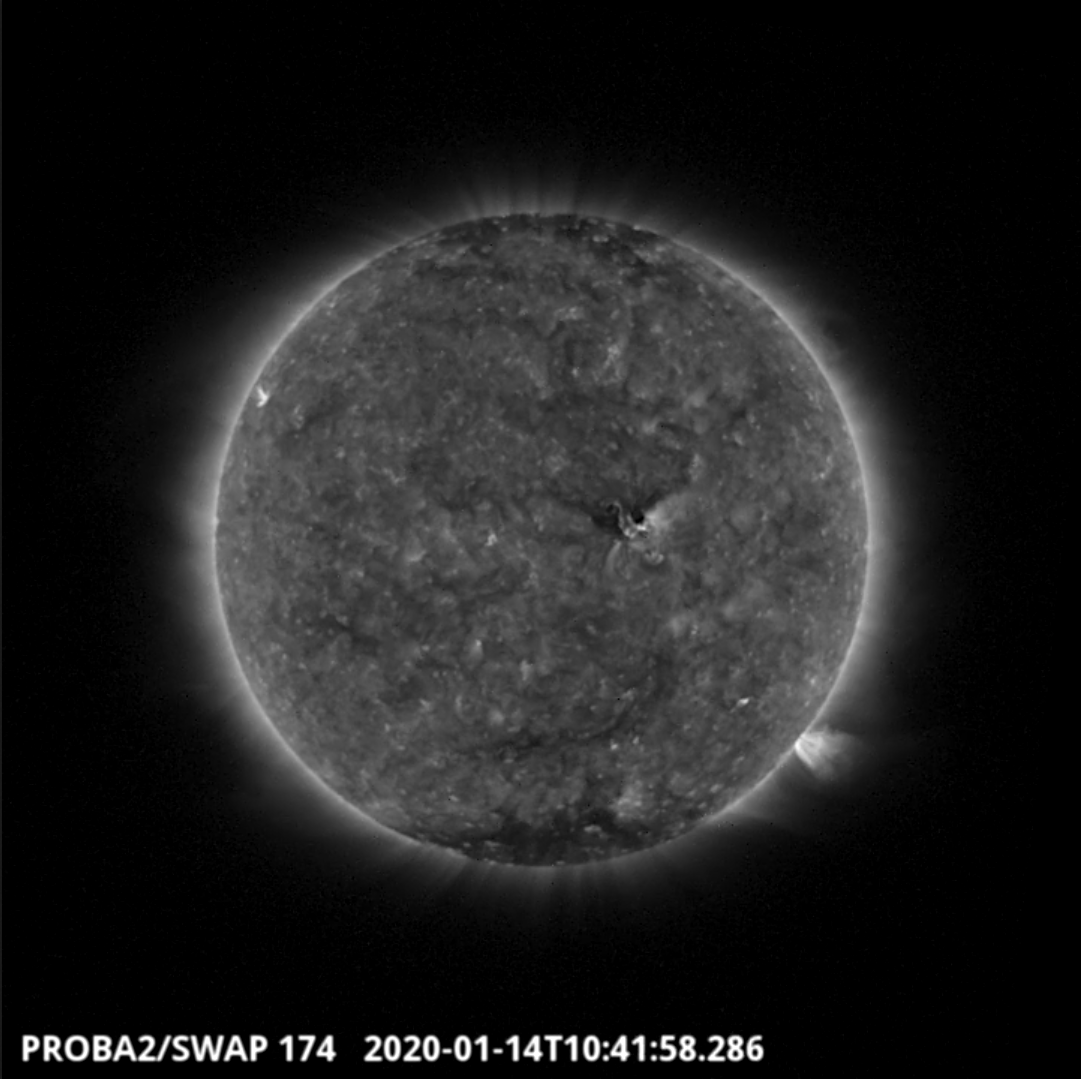
An eruption with an associated coronal dimming and EUV wave was observed by SWAP on 2020-Jan-14. The dimming can be seen towards the centre of the solar disk in the image above taken at 10:41 UT.
Find a movie of the event here (SWAP movie): http://proba2.oma.be/swap/movies/20200114_swap_movie.mp4
Review of geomagnetic activity
Earth was inside a slow solar wind regime with speeds between 290 and 390 km/s. The interplanetary magnetic field magnitude was mostly between 3 to 7 nT.
The solar wind density increased in the morning of January 16. At the same time, the interplanetary magnetic field started to fluctuate. These changes were followed by an increase of the temperature and solar wind speed. This could be possibly caused by the arrival of the solar wind from the positive polarity coronal hole that reached central meridian on January 10 (previous week). Nevertheless, the solar wind speed stayed bellow 390 km/s and as such it does not classify as a fast solar wind.
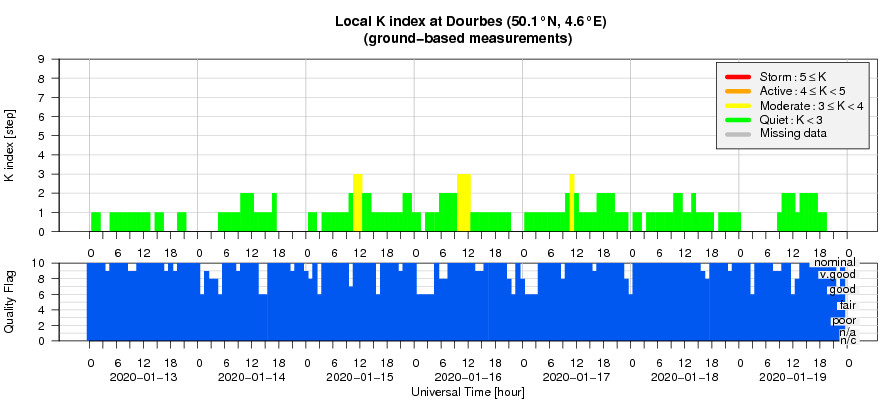
The geomagnetic conditions were quiet besides three intervals of unsettled conditions. Dourbes reported K=3 on January 15, 16 and 17, NOAA reported an interval of Kp=3 on January 16.
Geomagnetic Observations at Dourbes (13 Jan 2020 - 19 Jan 2020)
The SIDC space weather Briefing
The Space Weather Briefing presented by the forecaster on duty from Jan 13 to 19. It reflects in images and graphs what is written in the Solar and Geomagnetic Activity report.
The pdf-version: http://www.stce.be/briefings/20200120_SWbriefing.pdf
The automatically running presentation: http://www.stce.be/briefings/20200120_SWbriefing.ppsm
Review of ionospheric activity (13 Jan 2020 - 19 Jan 2020)
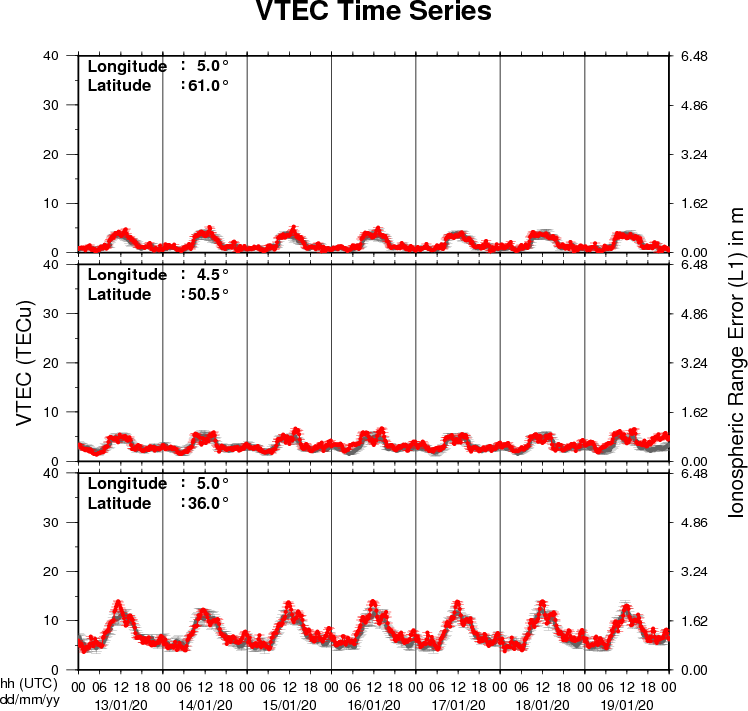
The figure shows the time evolution of the Vertical Total Electron Content (VTEC) (in red) during the last week at three locations:
a) in the northern part of Europe(N61°, 5°E)
b) above Brussels(N50.5°, 4.5°E)
c) in the southern part of Europe(N36°, 5°E)
This figure also shows (in grey) the normal ionospheric behaviour expected based on the median VTEC from the 15 previous days.
The VTEC is expressed in TECu (with TECu=10^16 electrons per square meter) and is directly related to the signal propagation delay due to the ionosphere (in figure: delay on GPS L1 frequency).
The Sun's radiation ionizes the Earth's upper atmosphere, the ionosphere, located from about 60km to 1000km above the Earth's surface.The ionization process in the ionosphere produces ions and free electrons. These electrons perturb the propagation of the GNSS (Global Navigation Satellite System) signals by inducing a so-called ionospheric delay.
See http://stce.be/newsletter/GNSS_final.pdf for some more explanations ; for detailed information, see http://gnss.be/ionosphere_tutorial.php