- Table of Content
- 1.Geomagnetic st...
- 2.Review of sola...
- 3.PROBA2 Observa...
- 4.The Internatio...
- 5.Review of geom...
- 6.Geomagnetic Ob...
- 7.The SIDC Space...
- 8.Review of iono...
2. Review of solar activity
3. PROBA2 Observations (24 Aug 2020 - 30 Aug 2020)
4. The International Sunspot Number by Silso
5. Review of geomagnetic activity (24 Aug 2020 - 30 Aug 2020
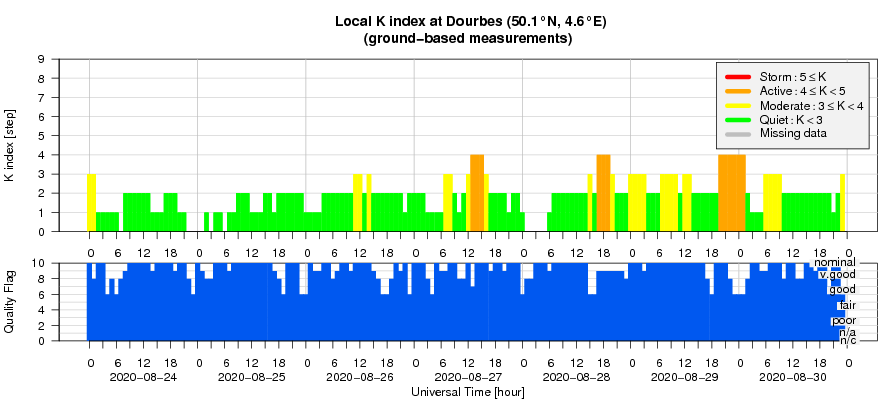
6. Geomagnetic Observations at Dourbes (24 Aug 2020 - 30 Aug 2020)
7. The SIDC Space Weather Briefing
8. Review of ionospheric activity (24 Aug 2020 - 30 Aug 2020)
Geomagnetic storm
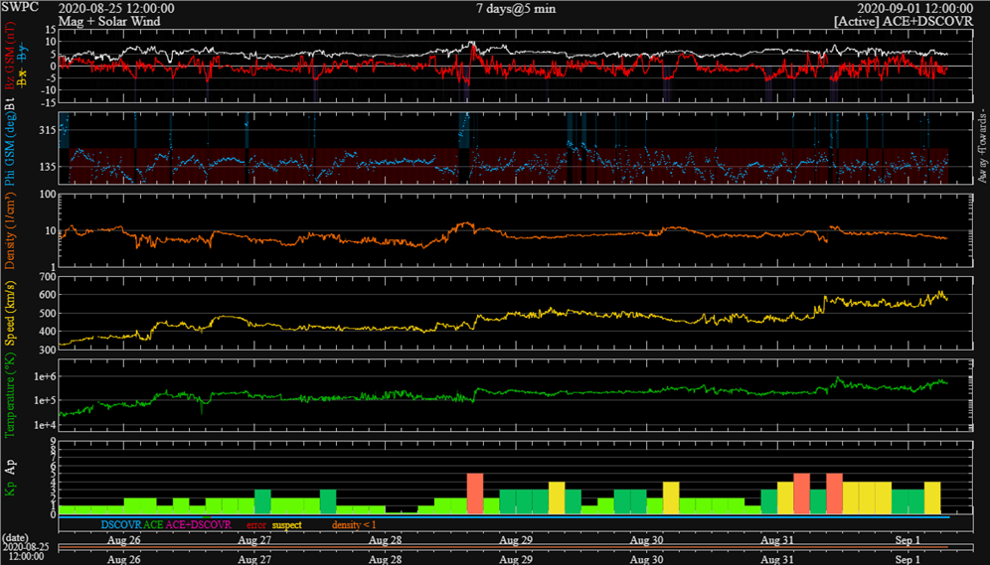
Geomagnetic activity reached minor storming conditions on 28 and 31 August following the arrival of enhanced wind streams related to positive polarity coronal holes. Positive polarity means that the (open) magnetic field lines from the coronal hole are directed away from the Sun (blue curve underneath). Solar wind speed (yellow curve) has been gradually rising from 400 km/s to its current (1 September) values around 600 km/s (DSCOVR - https://www.swpc.noaa.gov/products/real-time-solar-wind ). The estimated planetary K index (Kp) as provided by NOAA is at the bottom of the graph. "0" means quiet, "9" means extremely severe geomagnetic storming. The observed minor storm values are right in the middle (Kp=5), keeping in mind that the K-index is a quasi-logarithmic index. Of note is that in Dourbes (Belgium), the geomagnetic activity reached only active conditions (K = 4).
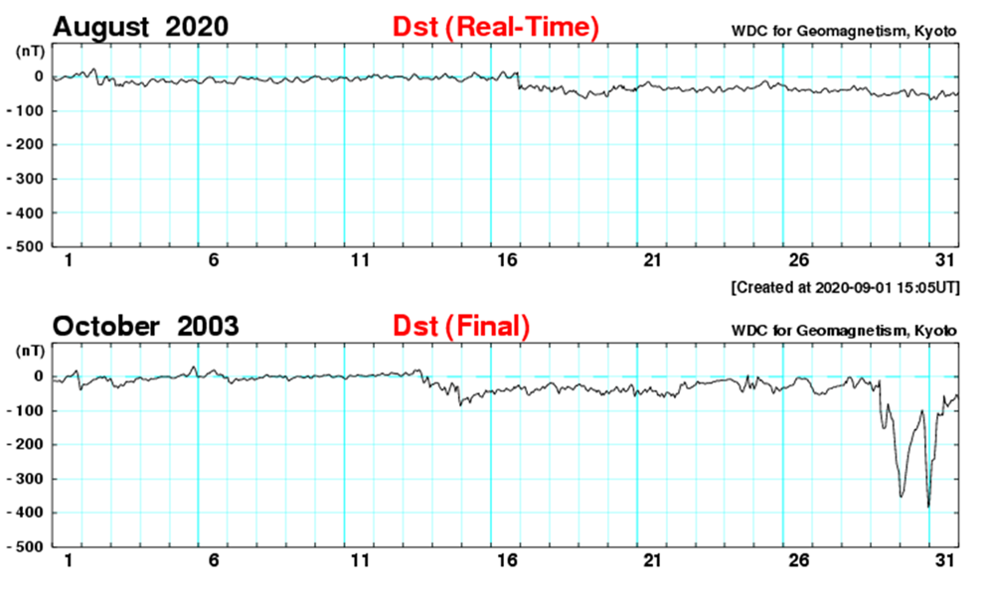
So far, there have been only 4 days in 2020 when geomagnetic activity reached minor storm levels. The previous times were on 19 February and 20 April. At those occasions, the source of the geomagnetic storm was the passage of an interplanetary coronal mass ejection (ICME), i.e. a cloud of charged particles ejected by the Sun in the direction of the Earth a few days earlier and affecting the geomagnetic field. See the STCE Newsletters of 27 February and 30 April 2020 at http://www.stce.be/newsletter/newsletter.php . Based on other geomagnetic parameters such as the Dst index (WDC Kyoto http://wdc.kugi.kyoto-u.ac.jp/ ; see this Newsitem at http://www.stce.be/news/483/welcome.html ), the currently ongoing storm is the strongest of the four with preliminary Dst values near -67 nT. This of course pales compared to severe geomagnetic storms such as in October 2003, when Kp reached 9 and Dst was at -383 nT.
Review of solar activity
In absence of spotted regions on the solar disc, the solar X-ray flux has been below background (B) level throughout the week.
There were no Earth directed coronal mass ejections observed in coronagraph data.
The greater than 10 MeV proton flux was at background levels.
The greater than 2 MeV electron flux was initially at nominal levels but increased from noon Aug 29 and reached high levels on Aug 30. This was related to the ongoing elevated solar wind conditions.
PROBA2 Observations (24 Aug 2020 - 30 Aug 2020)
Solar Activity
Solar flare activity was very low during the week.
In order to view the activity of this week in more detail, we suggest to go to the following website from which all the daily (normal and difference) movies can be accessed: https://proba2.oma.be/ssa
This page also lists the recorded flaring events.
A weekly overview movie can be found here (SWAP week 544): https://proba2.sidc.be/swap/data/mpg/movies/weekly_movies/weekly_movie_2020_08_24.mp4
Details about some of this week's events can be found further below.
If any of the linked movies are unavailable they can be found in the P2SC movie repository here: https://proba2.oma.be/swap/data/mpg/movies/
Sunday Aug 30
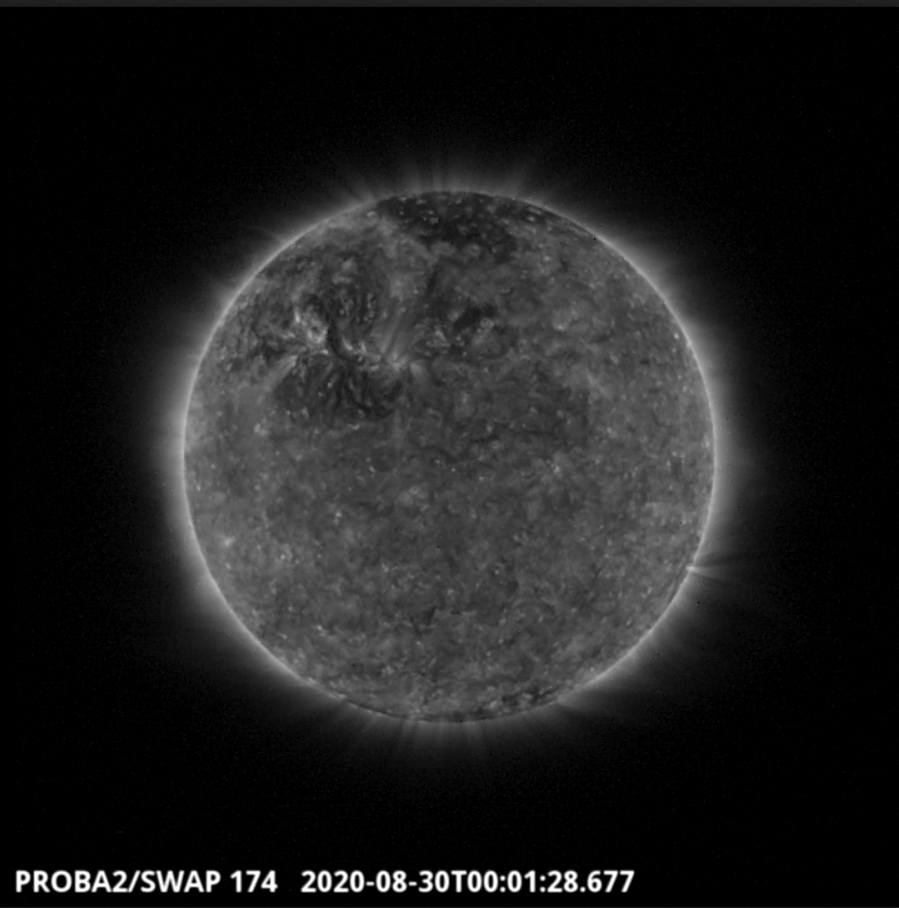
No Active Regions (ARs) were observed for the entire week, although the brighter structure that is visible in the north-east quadrant of the Sun in the SWAP image above, associated with a plage region, shows the remains of AR from the last rotation.
Find a movie of the day here (SWAP movie): https://proba2.sidc.be/swap/movies/20200830_swap_movie.mp4
The International Sunspot Number by Silso
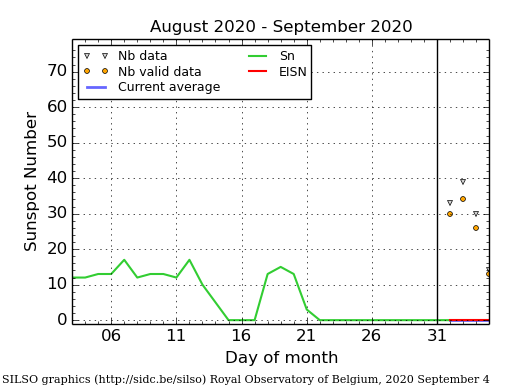
The daily Estimated International Sunspot Number (EISN, red curve with shaded error) derived by a simplified method from real-time data from the worldwide SILSO network. It extends the official Sunspot Number from the full processing of the preceding month (green line). The plot shows the last 30 days (about one solar rotation). The horizontal blue line shows the current monthly average. The yellow dots gives the number of stations that provided valid data. Valid data are used to calculate the EISN. The triangle gives the number of stations providing data. When a triangle and a yellow dot coincide, it means that all the data is used to calculate the EISN of that day.
Review of geomagnetic activity (24 Aug 2020 - 30 Aug 2020
Solar wind was enhanced because of a number of coronal holes.
The week started with near nominal conditions and the magnetic field phi angle in the towards the Sun (-) direction. The Phi angle then switched to the away sector (+) after noon Aug 25. This was followed by a mild enhancement of the speed, although it did not pass 500 km/s.
Another high speed stream (HSS) set in on Aug 28 afternoon. In the compression region during the HSS onset, the magnetic field reached just over 10nT with a Bz component reaching -8.6 nT. The maximum solar wind speed was 535km/s.
Geomagnetic conditions evolved from quiet (NOAA Kp and local K Dourbes 0-2) to active (NOAA Kp 1-3 and local K Dourbes 1-4), into quiet, followed by a minor geomagnetic storm (NOAA Kp 1-5 and local K Dourbes 1-4) along with the solar wind conditions.
Geomagnetic Observations at Dourbes (24 Aug 2020 - 30 Aug 2020)
The SIDC Space Weather Briefing
The Space Weather Briefing presented by the forecaster on duty from Aug 23 to 30. It reflects in images and graphs what is written in the Solar and Geomagnetic Activity report.
The pdf-version: http://www.stce.be/briefings/20200831_SWbriefing.pdf
The automatically running presentation: http://www.stce.be/briefings/20200831_SWbriefing.ppsm
Review of ionospheric activity (24 Aug 2020 - 30 Aug 2020)
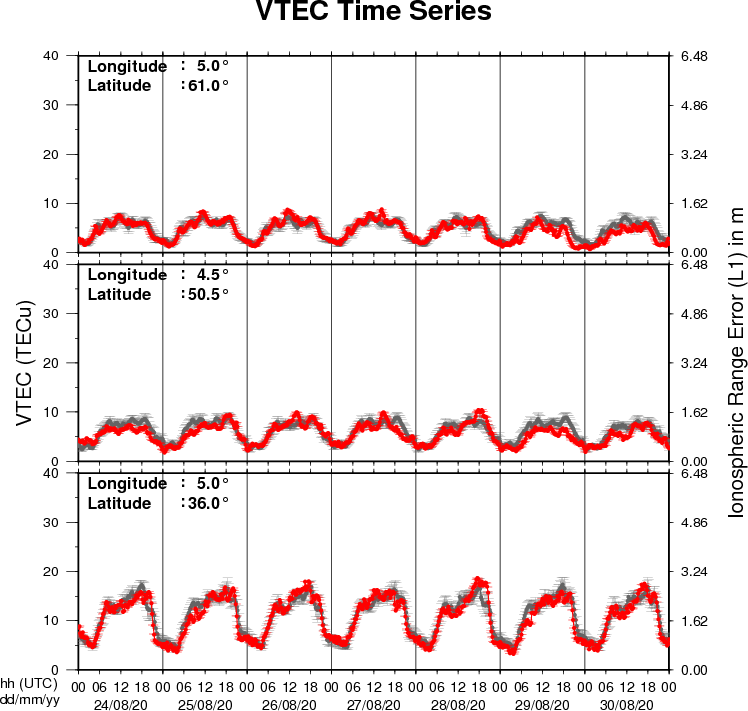
The figure shows the time evolution of the Vertical Total Electron Content (VTEC) (in red) during the last week at three locations:
a) in the northern part of Europe(N61°, 5°E)
b) above Brussels(N50.5°, 4.5°E)
c) in the southern part of Europe(N36°, 5°E)
This figure also shows (in grey) the normal ionospheric behaviour expected based on the median VTEC from the 15 previous days.
The VTEC is expressed in TECu (with TECu=10^16 electrons per square meter) and is directly related to the signal propagation delay due to the ionosphere (in figure: delay on GPS L1 frequency).
The Sun's radiation ionizes the Earth's upper atmosphere, the ionosphere, located from about 60km to 1000km above the Earth's surface.The ionization process in the ionosphere produces ions and free electrons. These electrons perturb the propagation of the GNSS (Global Navigation Satellite System) signals by inducing a so-called ionospheric delay.
See http://stce.be/newsletter/GNSS_final.pdf for some more explanations ; for detailed information, see http://gnss.be/ionosphere_tutorial.php