In previous STCE newsitems (e.g. here and here), it has been pointed out several times that the solar cycle 24 (SC24) is a real underperformer with respect to geomagnetic activity. No extremely severe geomagnetic storms, no memorable polar light displays at moderate to equatorial latitudes, barely a few days with severe geomagnetic conditions,... : SC24 really is a huge disappointment as far as geomagnetic activity is concerned.
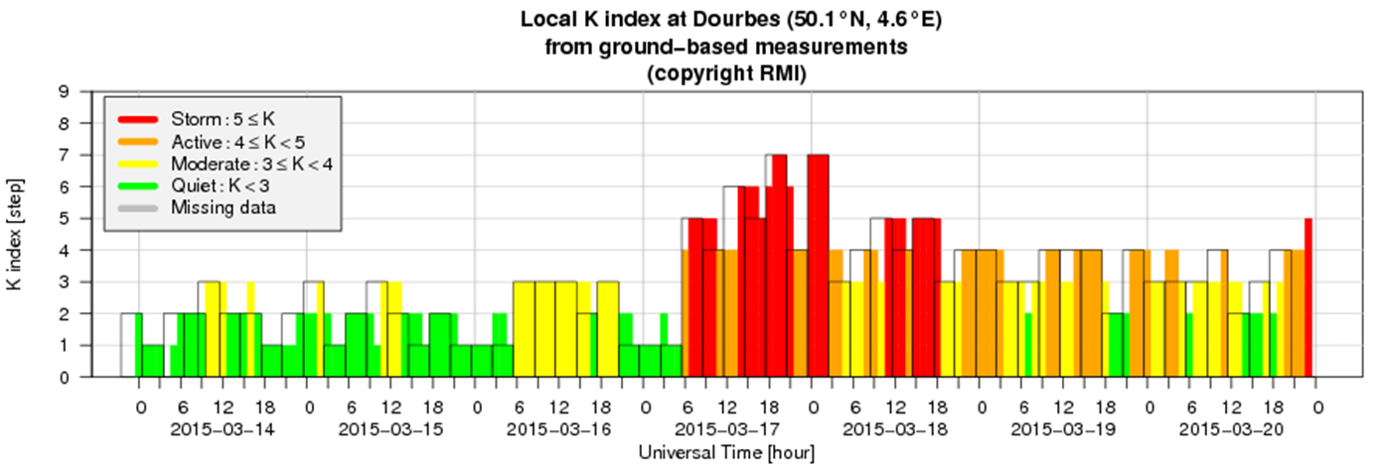
Observations and recordings of the last few years have simply confirmed this conclusion. Covering the period from January 2009 till April 2020, there's now a good view on the full cycle of geomagnetic activity. The most often used parameter is the Kp-index, introduced by Julius Bartels in 1949 and extended back to 1932. This 3-hour range index is derived from magnetic recordings done in 13 subauroral observatories. This unitless index is expressed in thirds, usually written as 0o,0+,1-,1o,1+,2-, ... ,8+,9-,9o. The estimated Kp (as shown on the NOAA/SWPC website) and the local K indices are all expressed in full numbers (0,1, ... ,8,9). Low values such as "0" or "1" mean quiet geomagnetic conditions, whereas the highest possible values "8" or "9" mean resp. severe and extremely severe geomagnetic conditions. Note the scale is open-ended, i.e. no matter how large the geomagnetic variation is, Kp will never exceed 9. The example underneath shows the strongest geomagnetic storm of SC24 as recorded by the geomagnetic observatory in Dourbes (Belgium) on 17-18 March 2015.
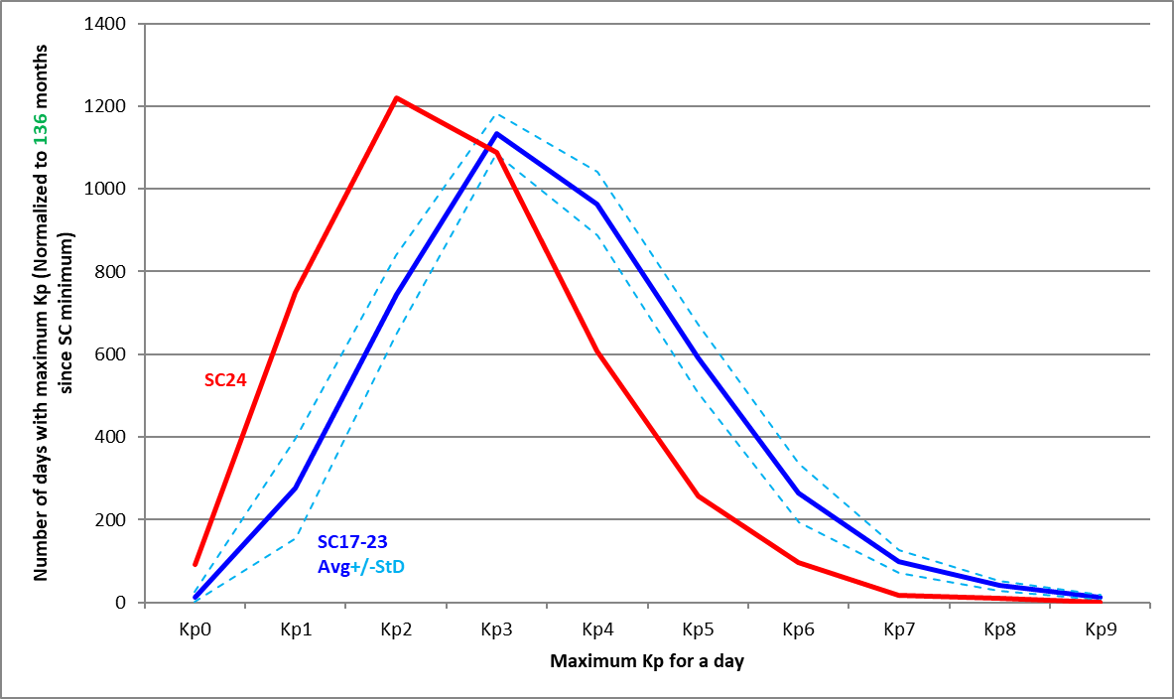
A quick analysis of the final Kp indices as archived at the Kyoto World Data Centre (WDC) for geomagnetism reveals that SC24 is a true underachiever. Not only has there not been a single day day with extreme geomagnetic storming, SC24 has also recorded a lot less storming days (Kp >= 5) and a lot more "quiet" days (Kp <= 2) compared to the average of the previous 7 solar cycles (SC17-23). This can be seen in the graph underneath, with the blue-dashed lines reflecting the standard deviation. All cycles were brought back to the same time span of 136 months ("normalized").
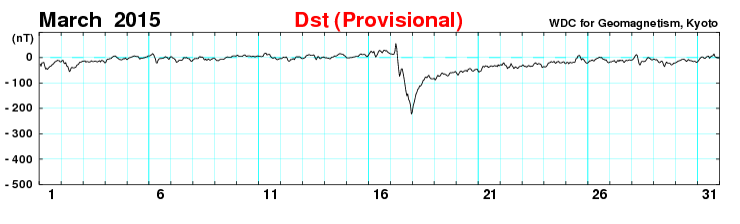
Another parameter that is often used to gauge the intensity of a geomagnetic storm is the Disturbance storm time index (Dst), available since January 1957. It is considered to reflect variations in the intensity of the ring current that circles Earth at altitudes ranging from about 3 to 8 earth radii. It is calculated as an hourly index from the horizontal magnetic field component (H) at four observatories located close enough to the magnetic equator that they are not strongly influenced by auroral current systems, but at the same time, far enough away from the magnetic equator so that they are not significantly influenced by the equatorial electrojet current that flows in the ionosphere. The Dst index is expressed in nT. An enhancement in the ring current results in a weakening of the earth's magnetic field (H-component), and so a strong geomagnetic storm is translated into a significantly negative value of Dst. As an example, during the Halloween storm of 30 October 2003, Dst reached -383 nT. An overview of the strongest geomagnetic storms (ranked according to their Dst) can be found in this STCE newsitem, and a graph of the hourly Dst for the month of March 2015, reflecting the strongest geomagnetic storm of SC24, can be seen underneath.
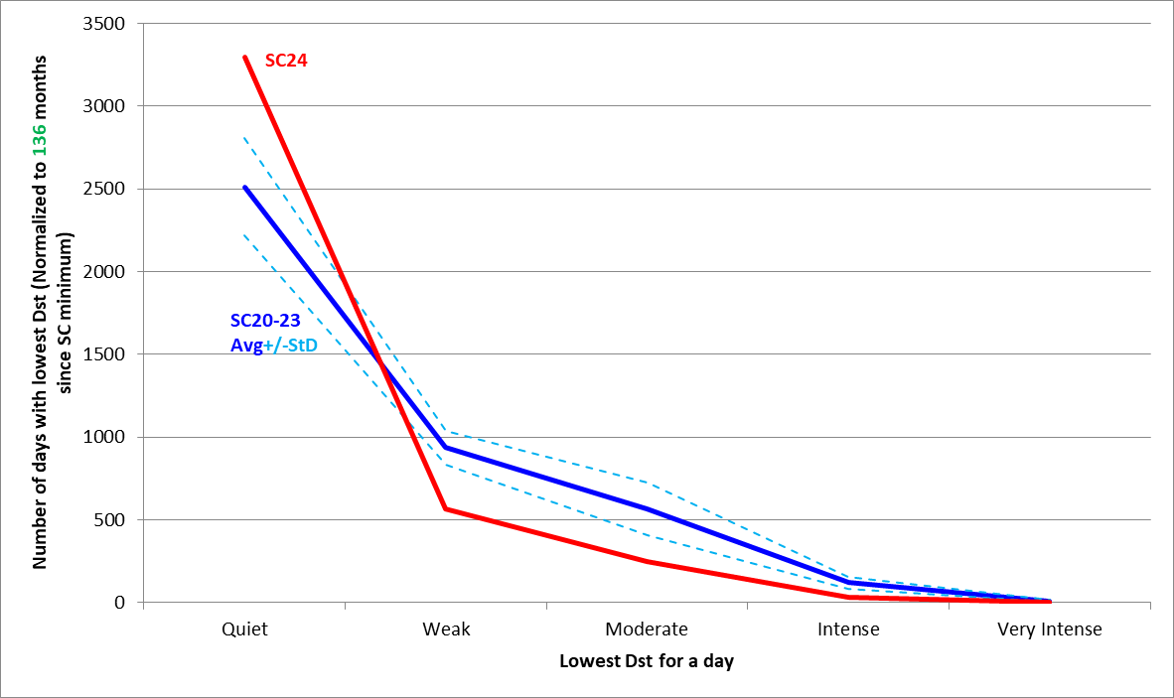
Geomagnetic storms can also be classified according to their minimum Dst values in 5 categories (see Echer et al. (2008): and Waheed et al. (2019): ). Quiet days are days when Dst > -30 nT, a storm is labeled weak if -50 nT < Dst <= -30 nT, moderate if -100 nT < Dst <= -50 nT, intense if -250 nT < Dst <= -100 nT, and very intense if Dst <= -250 nT. A quick analysis of the Dst values as available at the Kyoto WDC for geomagnetism confirms that SC24 is really weak in terms of geomagnetic disturbances. Compared to the average of the previous 4 solar cycles (SC20-23), SC24 is overpopulated with quiet days, whereas it lacks a large number of days in the storm categories, with not a single "very intense" day. This can be seen in the graph underneath, with the blue-dashed lines reflecting the standard deviation. All cycles were brought back to the same time span of 136 months ("normalized"). SC24 really was a geomagnetic dud!