- Table of Content
- 1.Bieke's public...
- 2.More data from...
- 3.A moderate geo...
- 4.Review of sola...
- 5.The Internatio...
- 6.PROBA2 Observa...
- 7.Geomagnetic Ob...
- 8.The SIDC Space...
- 9.Review of iono...
2. More data from Solar Orbiter has arrived
3. A moderate geomagnetic storm
4. Review of solar and geomagnetic activity
5. The International Sunspot Number by Silso
6. PROBA2 Observations (21 Sep 2020 - 27 Sep 2020)
7. Geomagnetic Observations at Dourbes (21 Sep 2020 - 27 Sep 2020)
8. The SIDC Space Weather Briefing
9. Review of ionospheric activity (21 Sep 2020 - 27 Sep 2020)
Bieke's public defence
At the moment of compiling the STCE Newsletter, Bieke Decreamer is being interrogated by the jury after she has finished her public presentation about her work 'Helmet streamers in the solar corona and their oscillations'.
The research that she has done is relevant for Solar Orbiter.
Jury, friends and colleagues are physically present, but more than 20 people follow it online.
Even if she is not yet officially 'Doctor of Science', we want to congratulate her with her title that she will get within 60 minutes!

Bieke Decreamer in action.
More data from Solar Orbiter has arrived
"ESA has released its first Solar Orbiter data to the scientific community and the wider public. The instruments contributing to this data release come from the suite of in-situ instruments that measure the conditions surrounding the spacecraft."
This can be read at the ESA website.
This is also good news for the EUI team. EUI is a remote sensing instrument onboard of Solar Orbiter. It is a package of 3 camera's that makes pictures of the solar chromosphere and atmosphere in the Extreme Ultraviolet.
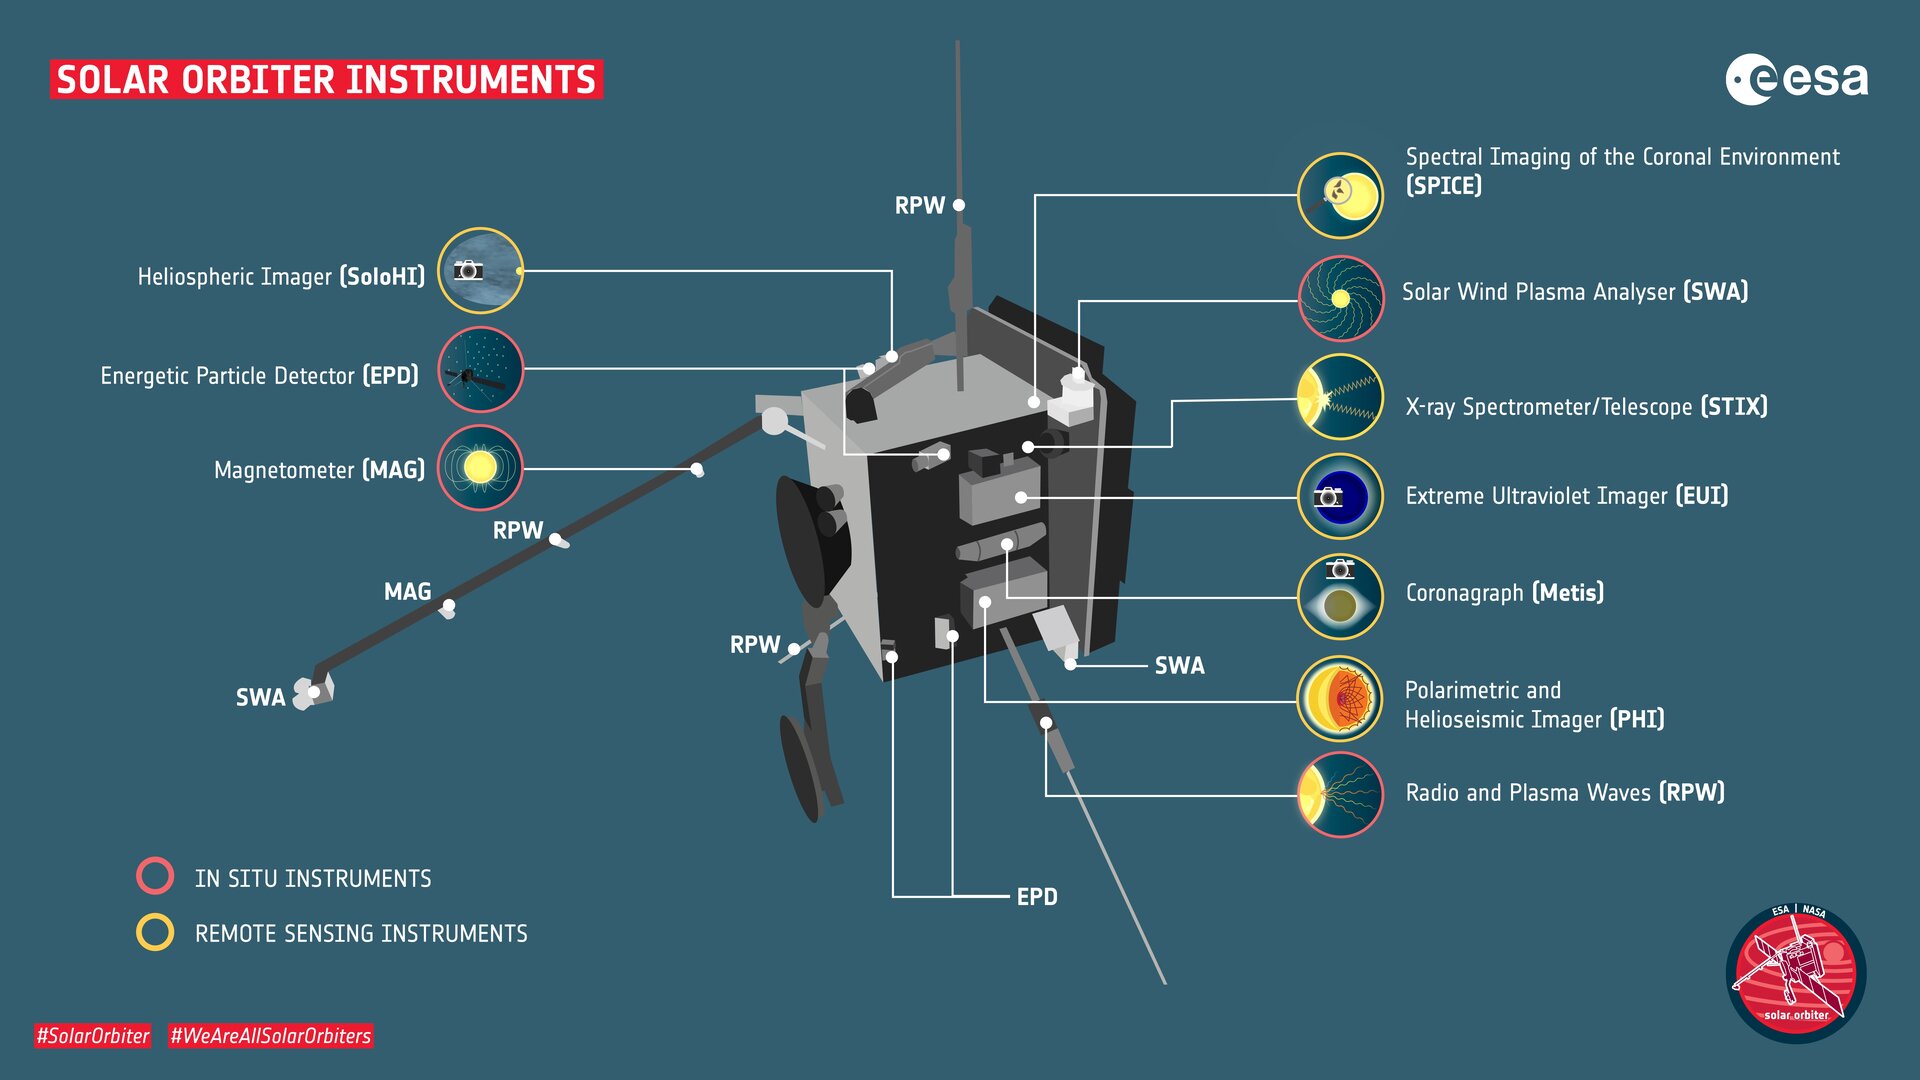
If we combine in-situ and remote sensing data, we get a more complete picture of the Sun and the heliosphere. We hope to be able to link events happening in the solar atmosphere with the solar wind that flows in the neighbourhood of Solar Orbiter. The in-situ data might show for example a high density solar wind. We will try to link this to eruptions on the Sun we see in EUI pictures.
EUI made already very impressive pictures, but is now being tested to make eclipse pictures in the extreme ultraviolet. To make an eclipse picture, you have to occult the solar disk. This is something which we never have done before!
Check out the ESA press release about the data release: http://www.esa.int/Science_Exploration/Space_Science/Solar_Orbiter/Solar_Orbiter_releases_first_data_to_the_public
A moderate geomagnetic storm
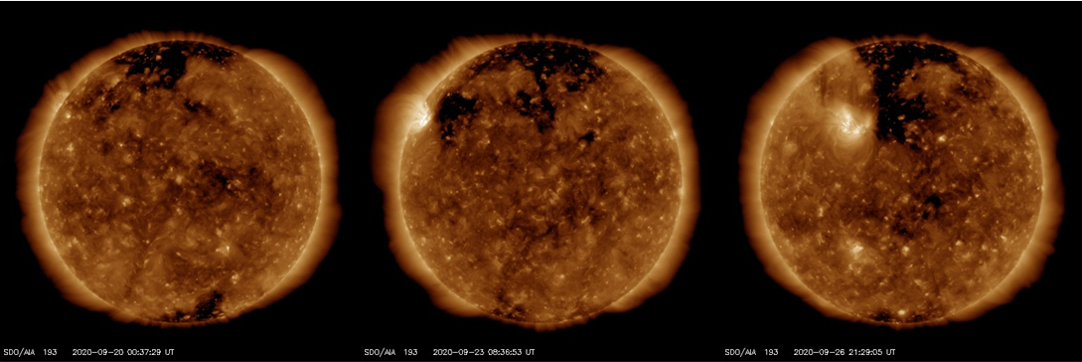
Geomagnetic activity reached moderate storming conditions on 27 September following the arrival of enhanced wind streams related to an extension from the northern positive polarity polar coronal hole (CH). The geomagnetic storm continued already elevated levels of geomagnetic activity that started on 24 September following the arrival of high speed wind streams associated with other extensions from the northern polar CH. These extensions can be seen in the extreme ultraviolet images underneath on 20-23-26 September taken by SDO/AIA 193 (https://sdo.gsfc.nasa.gov/ ) as dark structures emanating from the northern polar CH. The bright region that can be seen to the east of the most obvious extension is active region NOAA 2773, a mostly spotless region that did produce a small C1 flare peaking early on 26 September.
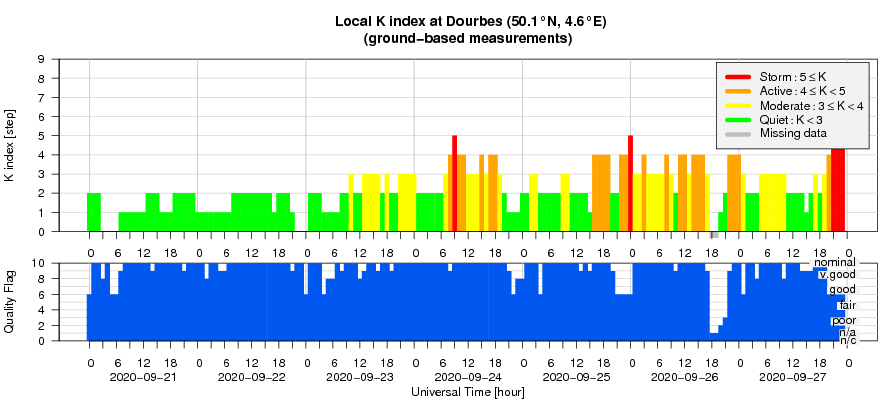
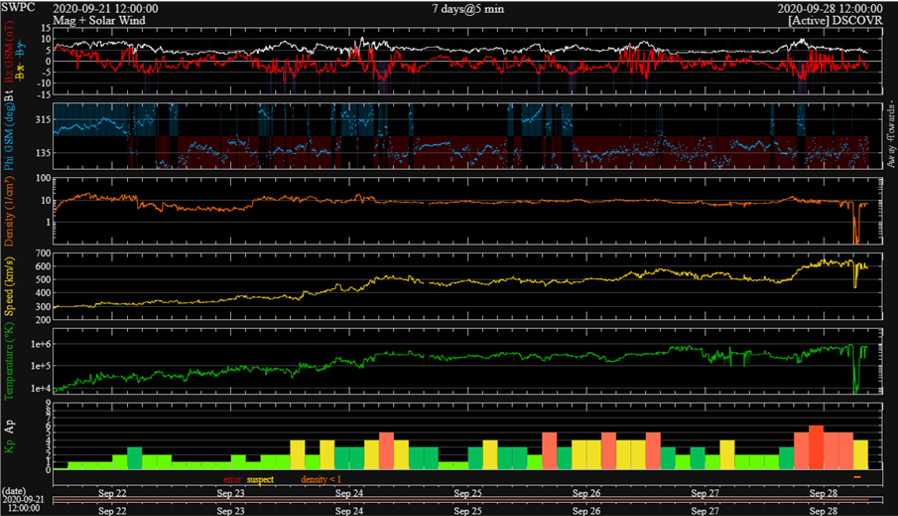
Positive polarity means that the (open) magnetic field lines from the coronal hole are directed away from the Sun (blue curve underneath), with values around 135 degrees near Earth. Solar wind speed (yellow curve) has been gradually rising from values near 360 km/s on 23 September to values peaking around 650 km/s late on 27 September (DSCOVR - https://www.swpc.noaa.gov/products/real-time-solar-wind ). The estimated planetary K index (Kp) as provided by NOAA is at the bottom of the graph. "0" means quiet, "9" means extremely severe geomagnetic storming. The observed moderate storm means Kp reached the value 6, as observed during the 21-24UT interval on 27 September. In Dourbes (Belgium), the geomagnetic activity reached only minor storming conditions (K=5).
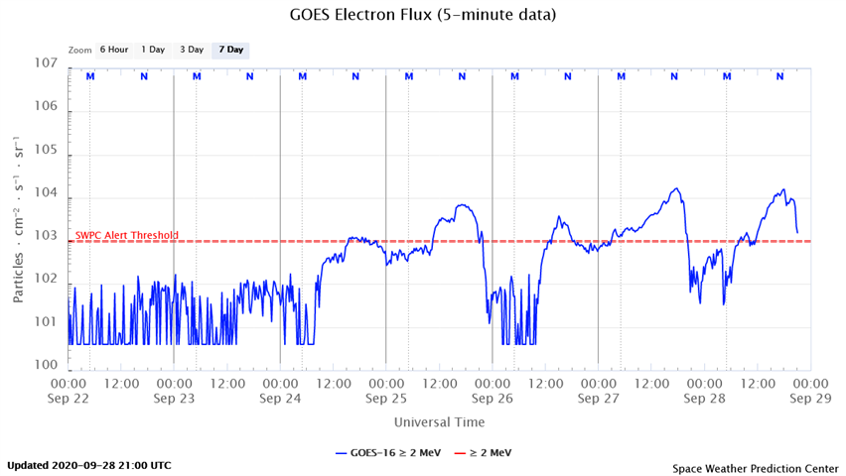
In a previous STCE newsitem (see http://www.stce.be/news/494/welcome.html ), it was pointed out that so far in 2020, there have been only 4 days with geomagnetic activity reaching minor storm levels. With last week's activity, that number has more than doubled and we now even have a day with moderate storming, on 27 September. That day also has the strongest negative Dst index (WDC Kyoto http://wdc.kugi.kyoto-u.ac.jp/ ; see this Newsitem at http://www.stce.be/news/483/welcome.html ), with preliminary Dst values near -81 nT. Aside sparkling aurora (polar lights) near polar latitudes, these persistent high speed wind streams were also the source of elevated levels of energetic (energies of more than 2 MeV) electrons with daily maxima above the alert threshold of 1000 pfu (particle flux units; 1 pfu = 1 electron / cm2 s sr) from 24 September onwards as measured by the GOES satellites (https://www.swpc.noaa.gov/products/goes-electron-flux ), even reaching high levels from 27 September (about 16.000 pfu) onwards. High levels of these electrons can lead to electrostatic discharges (ESD) resulting in malfunctions of a satellite and occasionally even in the satellite failure (see e.g. http://www.stce.be/news/463/welcome.html for a reference example). Even after the solar wind speed has decreased to nominal values, high levels of energetic electrons can still persist for several days.
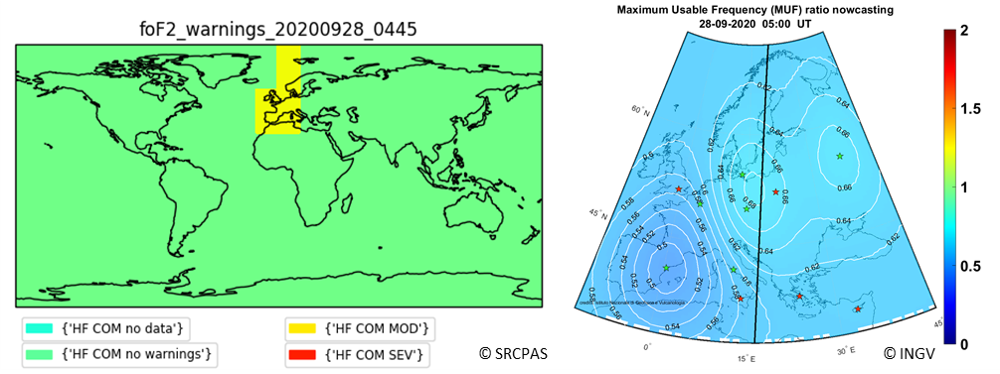
The geomagnetic storm also triggered a depression of the maximum usable frequency (MUF). The MUF is the highest HF radio frequency (i.e. between 3 and 30 MHz) that can be used for communication via reflection thru the ionosphere in a given direction. A depression of the MUF prohibits aircraft from accessing the highest frequencies normally available to them. These MUF depressions usually occur after the end of the main phase of geomagnetic storms and can last for several hours. The values are calculated against a 30-day running median, and advisories for the civil aviation are issued by participating space weather consortia such as PECASUS (http://pecasus.eu/ ). This issuing happens when depressions in the MUF of respectively 30 percent or more ("moderate") and 50 percent or more ("severe") are observed over a certain region in the world. Hence, in the wake of the 27 September geomagnetic storm, such "post-storm depressions" were observed at mid-to-high latitudes over Europe and advisories ("moderate") to the civil aviation were sent on 28 September.
Review of solar and geomagnetic activity
SOLAR ACTIVITY
The Sun was spotless at the beginning of the week.
An active region rotated into view from the east limb and produced B-class flares. It was numbered NOAA AR 2773, on September 24. It had 3 sunspots and beta magnetic field configuration. Early on September 26, with one sunspot visible, this AR produced a C-class flare (C1.0 peaking at 00:38 UT). After that, it decayed into a plage. In total it produced 17 B-class flares, and one C-class flare.
There were no obvious Earth-directed CMEs.
The greater than 10 MeV proton flux was at nominal levels.
The greater than 2 MeV electron flux was elevated every day since 24 September (between noon and midnight, approximately).
GEOMAGNETIC ACTIVITY
The solar wind close to the Earth ranged between 300 and 600 km/s. The interplanetary magnetic field reached 11 nT with Bz down to -9 nT.
The solar wind speed increased steadily since 23 September, due to the arrival of a high speed stream from the low latitudinal extension of the northern polar coronal hole (positive polarity, away from the Sun).
Geomagnetic activity reached minor storm levels both locally (KDourbes = 5) and at planetary levels (Kp = 5), every day after 24 September.
The International Sunspot Number by Silso
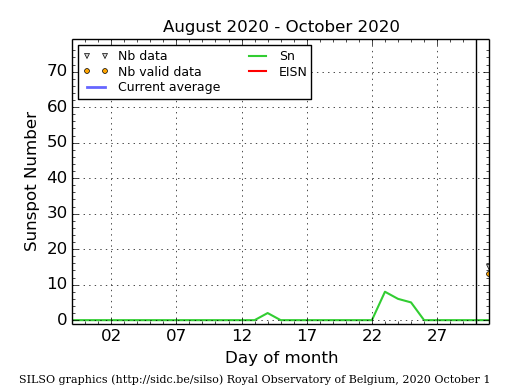
The daily Estimated International Sunspot Number (EISN, red curve with shaded error) derived by a simplified method from real-time data from the worldwide SILSO network. It extends the official Sunspot Number from the full processing of the preceding month (green line). The plot shows the last 30 days (about one solar rotation). The horizontal blue line shows the current monthly average. The yellow dots gives the number of stations that provided valid data. Valid data are used to calculate the EISN. The triangle gives the number of stations providing data. When a triangle and a yellow dot coincide, it means that all the data is used to calculate the EISN of that day.
PROBA2 Observations (21 Sep 2020 - 27 Sep 2020)
Solar Activity
Solar flare activity ranged between very low and low during the week.
In order to view the activity of this week in more detail, we suggest to go to the following website from which all the daily (normal and difference) movies can be accessed: https://proba2.oma.be/ssa
This page also lists the recorded flaring events.
A weekly overview movie can be found here (SWAP week 548): https://proba2.sidc.be/swap/data/mpg/movies/weekly_movies/weekly_movie_2020_09_21.mp4
Details about some of this week's events can be found further below.
If any of the linked movies are unavailable they can be found in the P2SC movie repository here: https://proba2.oma.be/swap/data/mpg/movies/
Saturday Sep 26
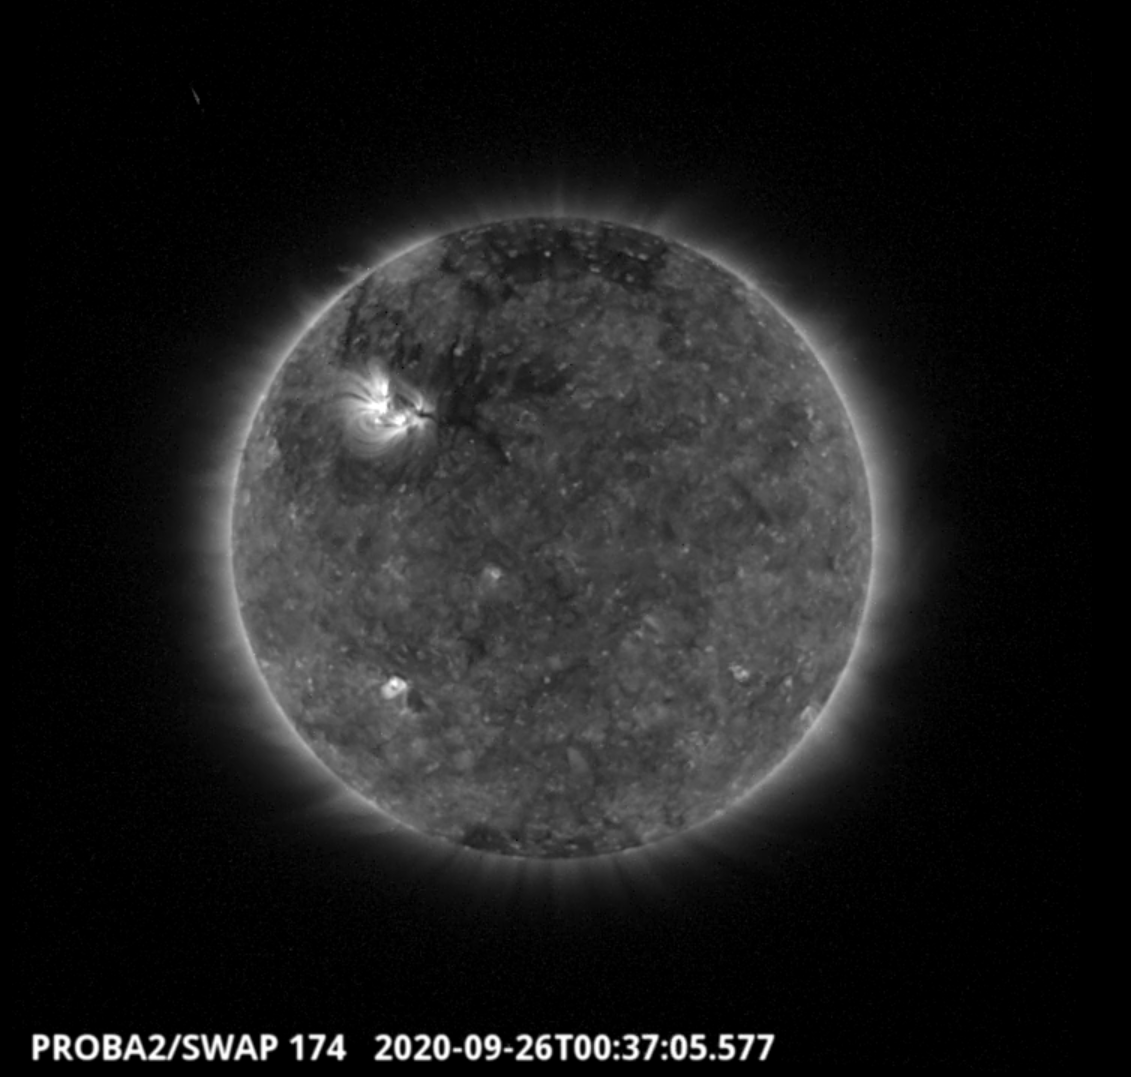
The largest flare of the week (C1.1), associated with NOAA AR 2773, was observed by SWAP and LYRA on 2020-Sep-26 and is visible in the north-east quadrant of the solar disk in the SWAP image above taken at 00:37 UT.
Find a movie of the event here (SWAP movie): http://proba2.oma.be/swap/data/mpg/movies/20200926_swap_movie.mp4
The SIDC Space Weather Briefing
The Space Weather Briefing presented by the forecaster on duty from Sept 20 to 27. It reflects in images and graphs what is written in the Solar and Geomagnetic Activity report.

Pdf-version: http://www.stce.be/briefings/20200928_SWbriefing.pdf
Movie: http://www.stce.be/briefings/20200928_SWbriefing.m4v
Review of ionospheric activity (21 Sep 2020 - 27 Sep 2020)
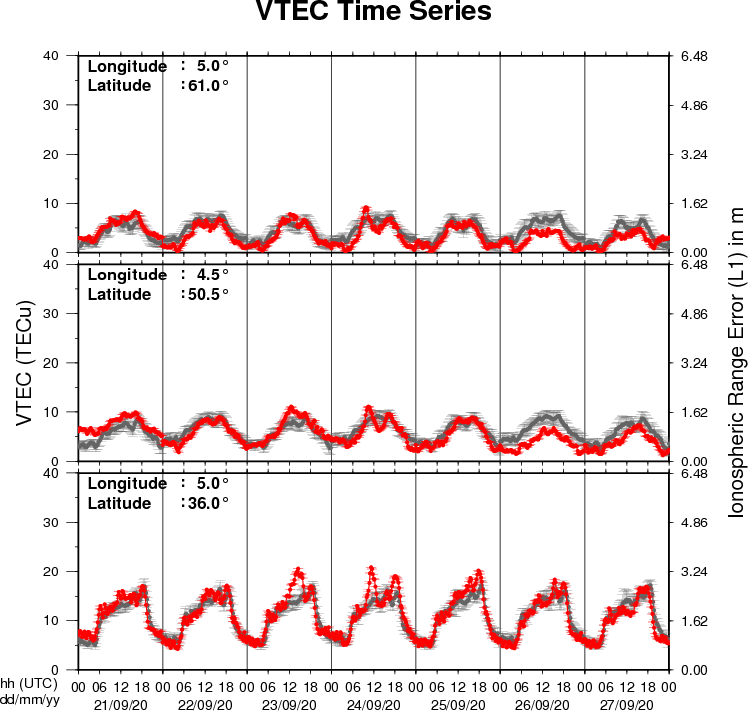
The figure shows the time evolution of the Vertical Total Electron Content (VTEC) (in red) during the last week at three locations:
a) in the northern part of Europe(N61°, 5°E)
b) above Brussels(N50.5°, 4.5°E)
c) in the southern part of Europe(N36°, 5°E)
This figure also shows (in grey) the normal ionospheric behaviour expected based on the median VTEC from the 15 previous days.
The VTEC is expressed in TECu (with TECu=10^16 electrons per square meter) and is directly related to the signal propagation delay due to the ionosphere (in figure: delay on GPS L1 frequency).
The Sun's radiation ionizes the Earth's upper atmosphere, the ionosphere, located from about 60km to 1000km above the Earth's surface.The ionization process in the ionosphere produces ions and free electrons. These electrons perturb the propagation of the GNSS (Global Navigation Satellite System) signals by inducing a so-called ionospheric delay.
See http://stce.be/newsletter/GNSS_final.pdf for some more explanations ; for detailed information, see http://gnss.be/ionosphere_tutorial.php
