- Table of Content
- 1.NOAA 2781 show...
- 2.Review of sola...
- 3.The Internatio...
- 4.PROBA2 Observa...
- 5.Review of geom...
- 6.Geomagnetic Ob...
- 7.The SIDC Space...
- 8.Review of iono...
2. Review of solar activity
3. The International Sunspot Number by Silso
4. PROBA2 Observations (2 Nov 2020 - 8 Nov 2020)
5. Review of geomagnetic activity
6. Geomagnetic Observations at Dourbes (2 Nov 2020 - 8 Nov 2020)
7. The SIDC Space Weather Briefing
8. Review of ionospheric activity (2 Nov 2020 - 8 Nov 2020)
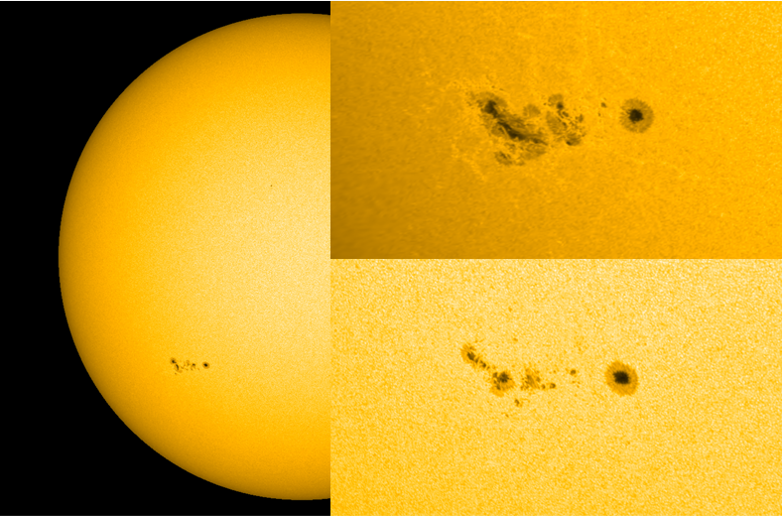
NOAA 2781 showing off
NOAA 2781 rotated into view on 2 November, quickly increasing in size to become the largest sunspot group so far this solar cycle. At its maximum on 6 November, its area was the equivalent of nearly 3 times the surface area of the Earth (NOAA). The changes in the sunspot group were quite dramatic. Images underneath shows the group in white light (SDO/HMI , https://sdo.gsfc.nasa.gov/data/aiahmi/ ) on 7 November, with the insets (zoom) early on 6 (top) and late on 8 (bottom) November highlighting the significant decay of the region, in particular in the middle and trailing portion. Clips are available at http://www.stce.be/news/502/welcome.html
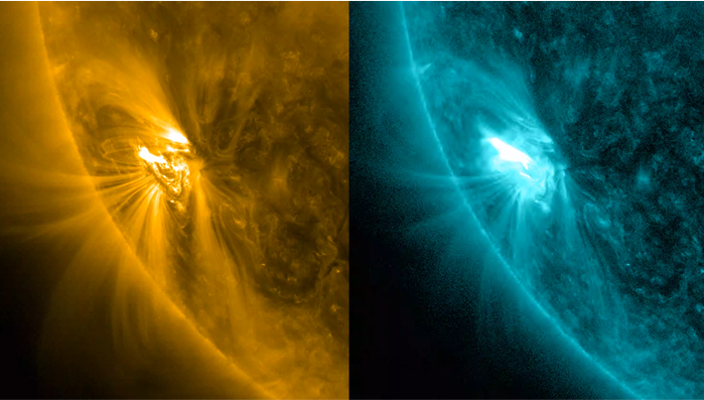
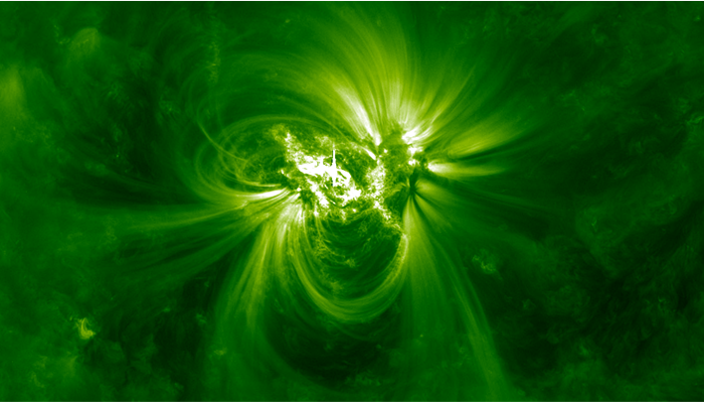
Despite its size and magnetic complexity, the group produced only C-class ("common") flares. The largest were a C7 flare early on 5 November and a C5 event on 8 November. The images in extreme ultraviolet (EUV) underneath show both flares. For the C7 flare, views in two filters are compared. AIA 171 (left) shows the flaring event at "moderate" temperatures of about 700.000 degrees, and AIA 131 (right) provides a high temperature view at several million degrees. In AIA 171, peak brightness is a few minutes after AIA 131, and it provides a finer view of the (few) post-flare coronal loops. The C5 flare is highly zoomed and is shown in the green component of AIA 171. No obvious coronal mass ejections were associated with these flares.
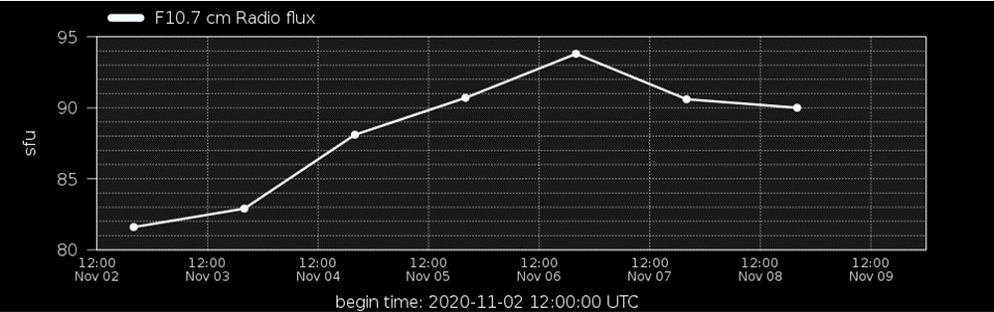
The size and flaring activity of NOAA 2781 drove the 10.7cm solar radio flux to the highest levels so far this solar cycle. The wavelengths around 10.7 cm (frequencies around 2800 MHz) are ideal for monitoring the solar activity, as they are very sensitive to conditions in the upper chromosphere and at the base of the corona. See this STCE newsitem for more information (http://www.stce.be/news/374/welcome.html ). The daily radio flux reached 93.8 sfu (solar flux units, with 1 sfu = 10-22 W m-2 Hz-1) well above the typical solar cycle minimum values around 70 sfu. Of course, these values are still low when compared to solar cycle maximum values, when 200-250 sfu can easily be reached.
Review of solar activity
This week, two sunspots were worth monitoring carefully. Catania sunspot group 50 (NOAA-AR 2781) produced several C-class flare, including a C7.3-class flare peaking at 00:22 UTC on November 5. Catania sunspot group 51 (NOAA-AR 2780) did not produce any C-class flare or above, but was the source region of a coronal dimming observed on November 7 at 12:21 UTC. The group was at that moment located at 10 degree longitude and 20 degree latitude.
No evidence of the coronal dimming of November 7 was seen in SOHO/LASCO-C2 and C3 .
No coronal mass ejections were visible in the coronagraphic imagery.
The greater than 10 MeV proton flux was at background levels.
The greater than 2 MeV electrons flux remained below the 10^3 pfu threshold, except for two short periods in response to the slightly enhanced solar wind conditions.
The International Sunspot Number by Silso
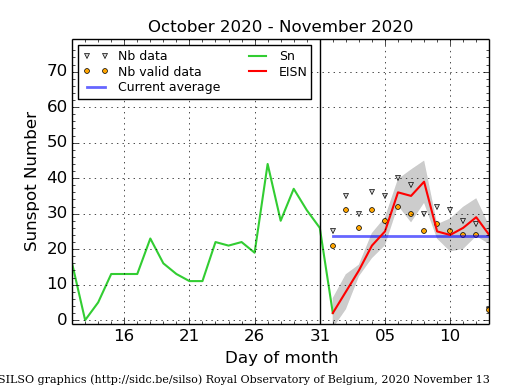
The daily Estimated International Sunspot Number (EISN, red curve with shaded error) derived by a simplified method from real-time data from the worldwide SILSO network. It extends the official Sunspot Number from the full processing of the preceding month (green line). The plot shows the last 30 days (about one solar rotation). The horizontal blue line shows the current monthly average. The yellow dots gives the number of stations that provided valid data. Valid data are used to calculate the EISN. The triangle gives the number of stations providing data. When a triangle and a yellow dot coincide, it means that all the data is used to calculate the EISN of that day.
PROBA2 Observations (2 Nov 2020 - 8 Nov 2020)
Solar Activity
Solar flare activity increased from very low to low during the week.
In order to view the activity of this week in more detail, we suggest to go to the following website from which all the daily (normal and difference) movies can be accessed: https://proba2.oma.be/ssa
This page also lists the recorded flaring events.
A weekly overview movie can be found here (SWAP week 554): https://proba2.sidc.be/swap/data/mpg/movies/weekly_movies/weekly_movie_2020_11_02.mp4
Details about some of this week's events can be found further below.
If any of the linked movies are unavailable they can be found in the P2SC movie repository here: https://proba2.oma.be/swap/data/mpg/movies/
Thursday Nov 05
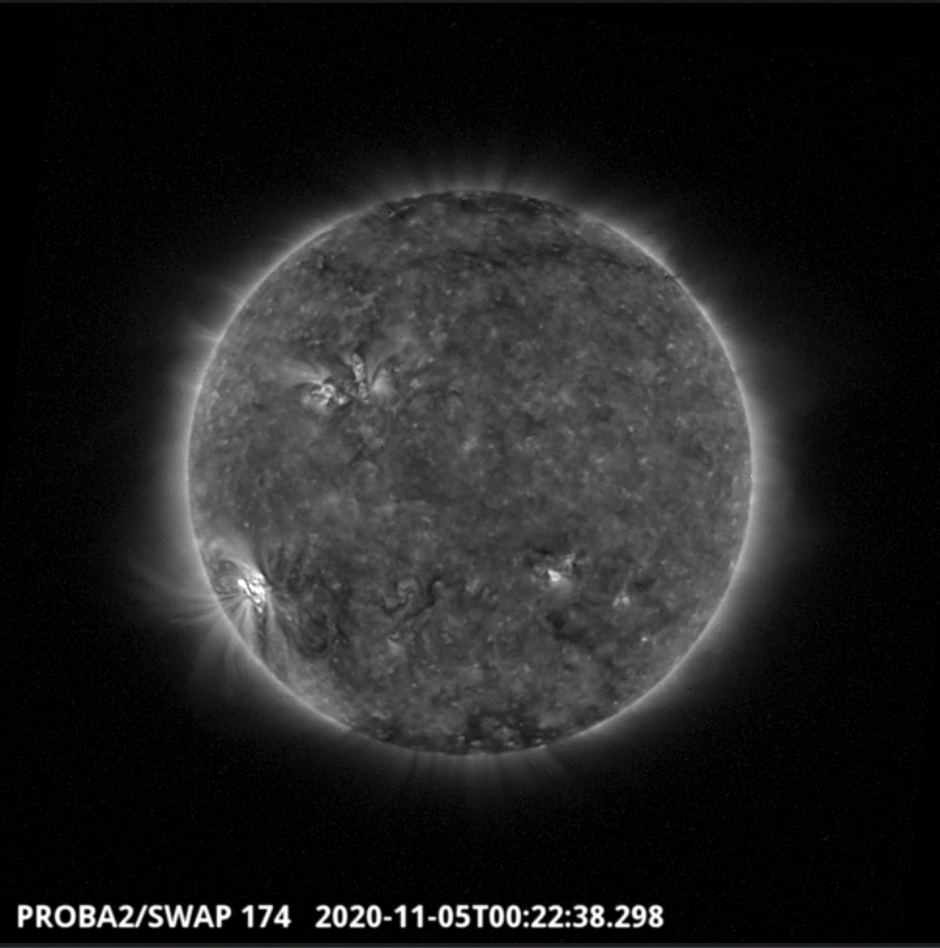
The largest flare of the week (C7.3), which was associated with NOAA AR2781, was observed by SWAP and LYRA on 2020-Nov-05. The flare is visible in the south-east quadrant of the solar disk in the SWAP image above taken at 00:22 UT.
Find a movie of the event here (SWAP movie): https://proba2.sidc.be/swap/movies/20201105_swap_movie.mp4
Saturday Nov 07
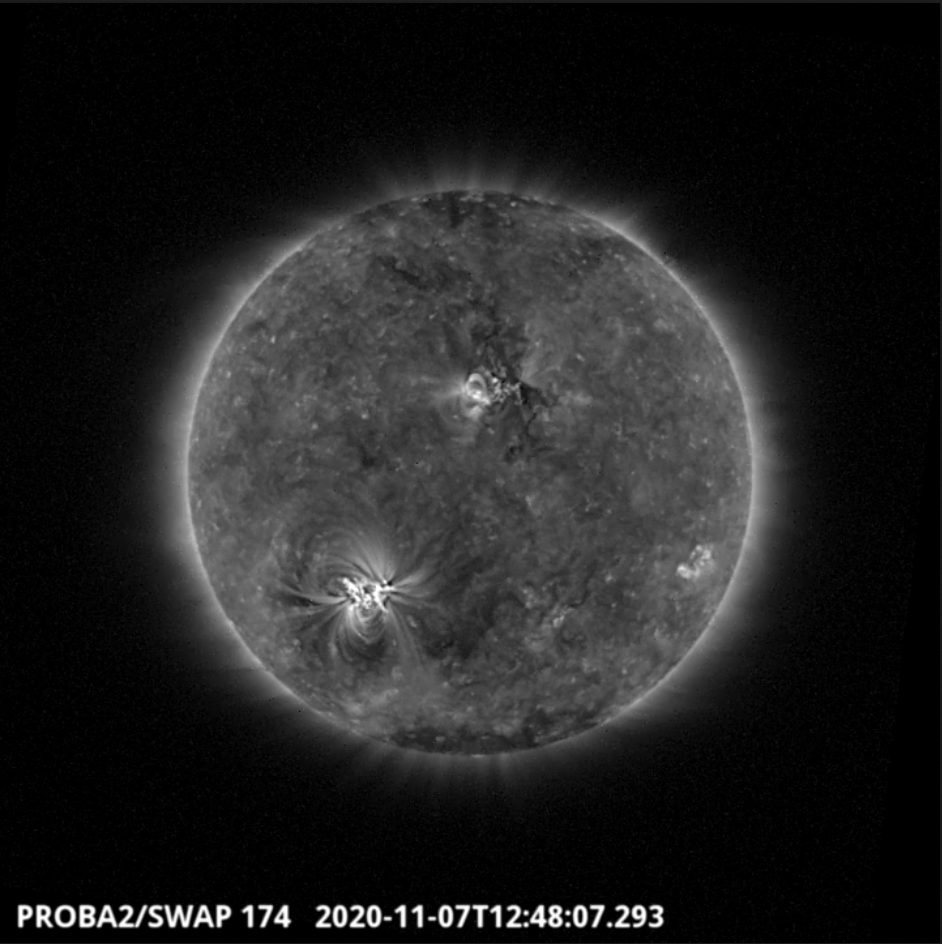
A coronal dimming and EUV wave, associated with NOAA AR2780, was observed by SWAP and on 2020-Nov-07. The dimming is visible in the north of the solar disk near the central meridian in the SWAP image above taken at 12:48 UT.
Find a movie of the event here (SWAP movie): https://proba2.sidc.be/swap/movies/20201107_swap_movie.mp4 and here (SWAP difference movie): https://proba2.sidc.be/swap/movies/20201107_swap_diff.mp4/20201107_swap_movie.mp4
Review of geomagnetic activity
The Earth was under the influence of a slow solar wind. The solar wind associated with the south polar coronal hole (negative polarity) passed DSCVR at the L1 point on November 6. The solar wind speed increased to 541 km/s, the total interplanetary magnetic field reached 10.4 nT, and the Bz magnetic field component decreased to -7.7 nT.
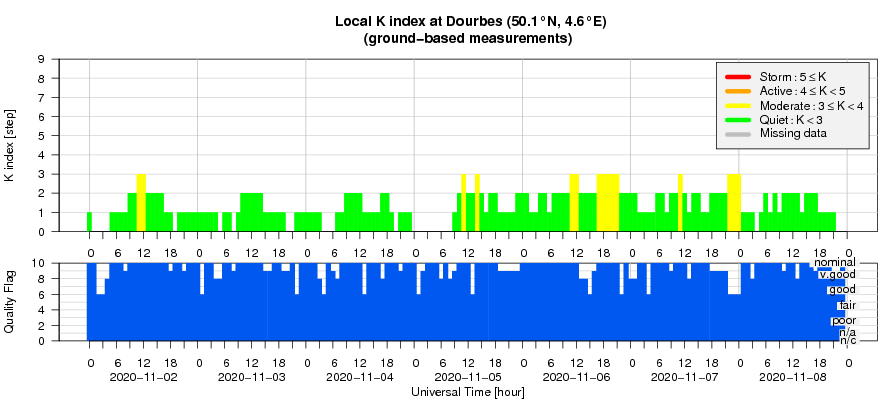
Geomagnetic conditions were mostly quiet, with a period of active and unsettled conditions in Dourbes on November 1 and 2 in response to the coronal mass ejection that left the sun on October 27. The coronal hole wind stream induced unsettled conditions on November 6.
Geomagnetic Observations at Dourbes (2 Nov 2020 - 8 Nov 2020)
The SIDC Space Weather Briefing
The Space Weather Briefing presented by the forecaster on duty from November 1 to 8. It reflects in images and graphs what is written in the Solar and Geomagnetic Activity report.

A pdf-version: http://www.stce.be/briefings/20201109_SWbriefing.pdf
The movie: http://www.stce.be/briefings/20201109_SWbriefing.m4v
Review of ionospheric activity (2 Nov 2020 - 8 Nov 2020)
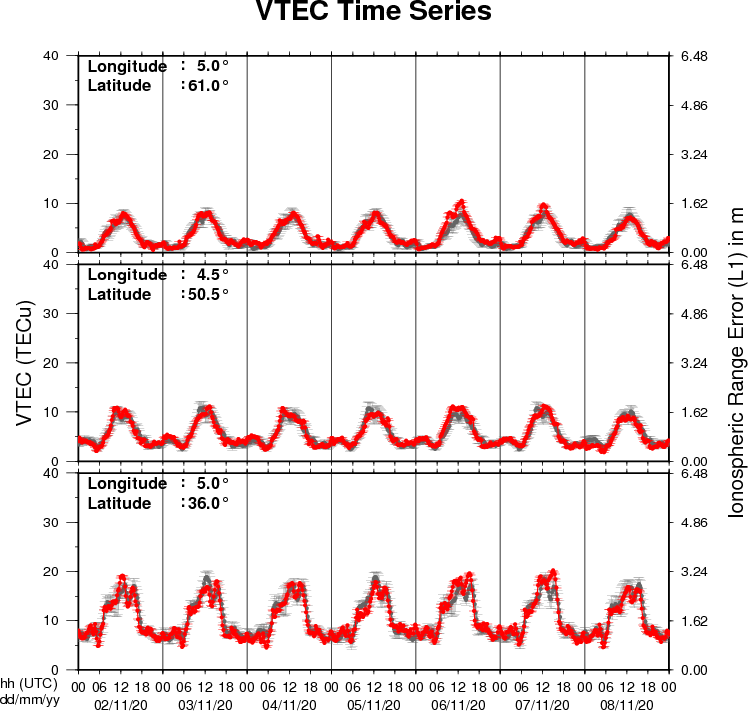
The figure shows the time evolution of the Vertical Total Electron Content (VTEC) (in red) during the last week at three locations:
a) in the northern part of Europe(N61°, 5°E)
b) above Brussels(N50.5°, 4.5°E)
c) in the southern part of Europe(N36°, 5°E)
This figure also shows (in grey) the normal ionospheric behaviour expected based on the median VTEC from the 15 previous days.
The VTEC is expressed in TECu (with TECu=10^16 electrons per square meter) and is directly related to the signal propagation delay due to the ionosphere (in figure: delay on GPS L1 frequency).
The Sun's radiation ionizes the Earth's upper atmosphere, the ionosphere, located from about 60km to 1000km above the Earth's surface.The ionization process in the ionosphere produces ions and free electrons. These electrons perturb the propagation of the GNSS (Global Navigation Satellite System) signals by inducing a so-called ionospheric delay.
See http://stce.be/newsletter/GNSS_final.pdf for some more explanations ; for detailed information, see http://gnss.be/ionosphere_tutorial.php