- Table of Content
- 1.Homologous C-c...
- 2.Ready or not.....
- 3.Campfire physi...
- 4.Review of sola...
- 5.PROBA2 Observa...
- 6.The Internatio...
- 7.Radio burst li...
- 8.Review of geom...
- 9.Geomagnetic Ob...
- 10.The SIDC Space...
- 11.Review of iono...
- 12.Again not rele...
2. Ready or not... Here I come!
3. Campfire physics
4. Review of solar activity
5. PROBA2 Observations (30 Nov 2020 - 6 Dec 2020)
6. The International Sunspot Number by Silso
7. Radio burst list
8. Review of geomagnetic activity
9. Geomagnetic Observations at Dourbes (30 Nov 2020 - 6 Dec 2020)
10. The SIDC Space Weather Briefing
11. Review of ionospheric activity (30 Nov 2020 - 6 Dec 2020)
12. Again not relevant
Homologous C-class flares
Homologous flares are the solar equivalent of identical twins. They concern a series of solar flares repeating in the same active region with essentially the same position and with a common pattern of development, i.e. having the same main footpoints and general shape in the main phase as defined in H-alpha or EUV-imagery. Though not a requirement, homologous flares often have similar strength, and if there are more than two, they sometimes occur within similar time intervals. Some examples are discussed in this STCE Newsitem at http://www.stce.be/news/244/welcome.html
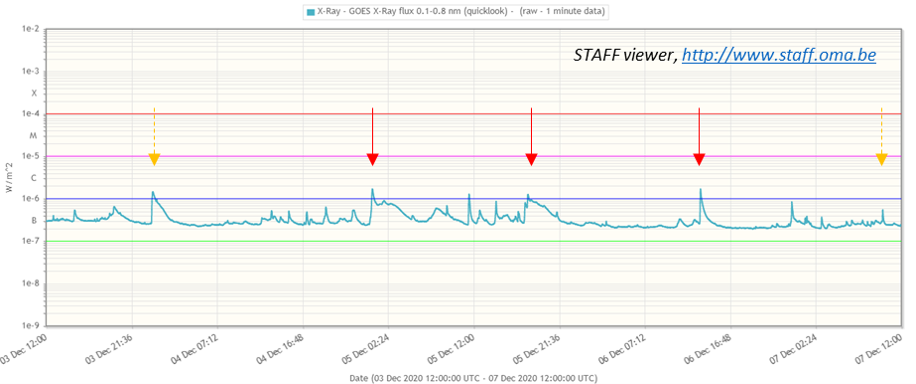
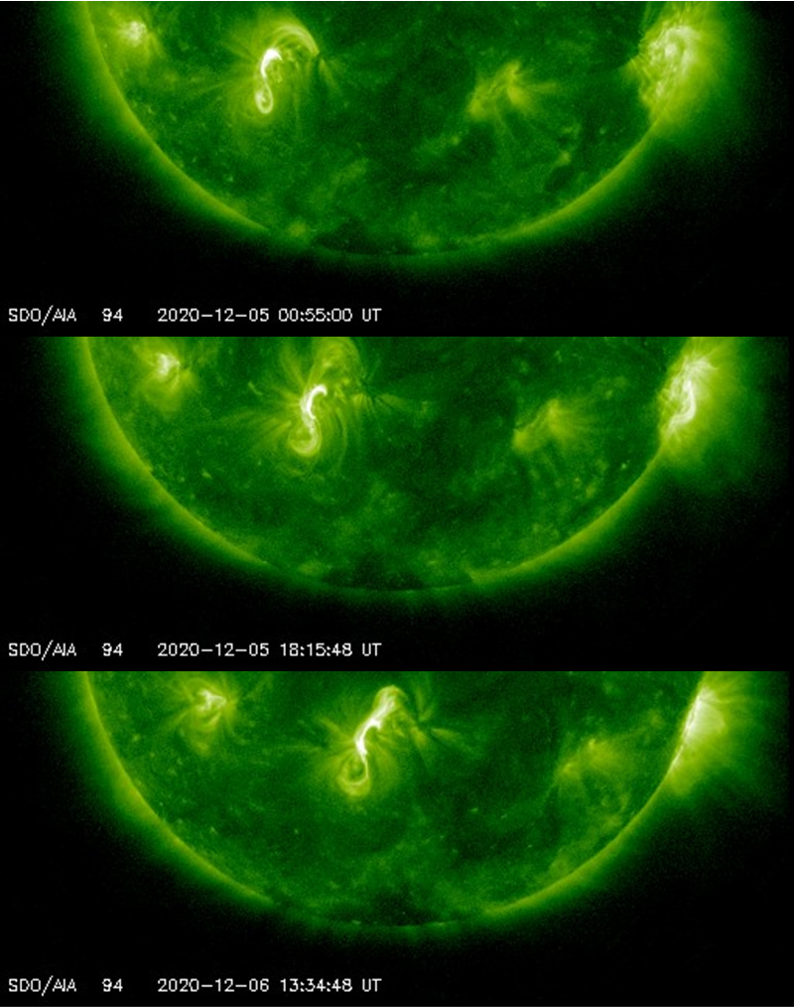
NOAA 2790, responsible for last week's M4 event, was all-in-all a relatively simple active region consisting mainly of a single symmetric sunpot. It produced several low-level C-class flares such as e.g. on 5 and 6 December as indicated by the red arrows. These flares were of similar strength (resp. C1.6, C1.2 and C1.6) and happening at intervals around 18 hours between each other. More importantly, extreme ultraviolet (EUV) imagery by SDO (https://sdo.gsfc.nasa.gov/data/aiahmi/ ) revealed an almost identical flare outlook, i.e. a stretched S-shape with a significant brighter northern portion and a somewhat fuzzy area just north of the active region.
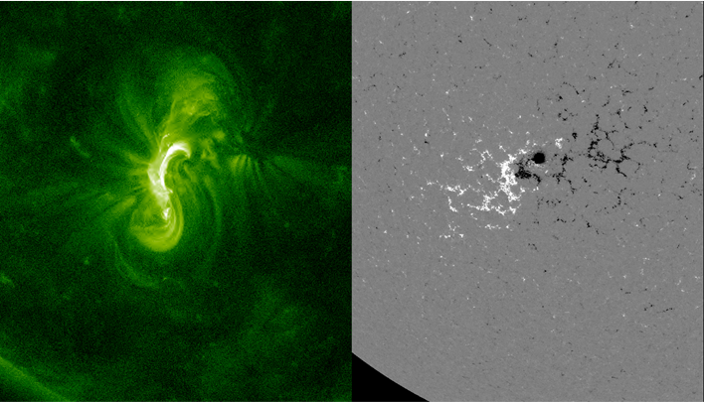
The 3 homologous flares were preceded by a C1.4 flare peaking a day earlier and followed by a B5.4 flare 20 hours later (indicated by the dashed orange arrows). However these flares are not really considered to belong to the "family". The first flare clearly lacked the well-defined southern portion of the S-shape, whereas the last flare was much weaker with only the middle portion somewhat lighting up. The imagery underneath from flare number 3 (the one peaking on 5 December at 18:06UTC) indicates that the flaring took place along the magnetic inversion line, i.e. the line separating positive (white) and negative (black) magnetic polarities in the active region. The magnetic configuration in NOAA 2790 seems to have been stable enough to allow for the three nearly identical flares on 5-6 December. The difference in the x-ray flux outlook of flare number 4 (fast decrease) compared to numbers 2 and 3 (slow decrease) suggested that this magnetic configuration was breaking up. Of course this doesn't mean the active region can't produce any flares anymore, they will just be different in outlook and/or strength.
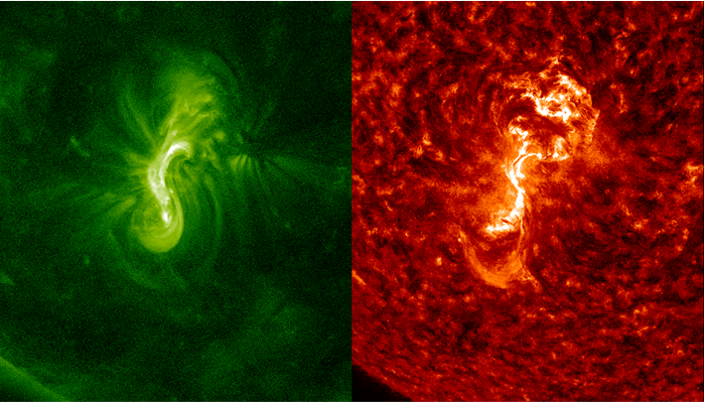
Comparing the flaring events in different wavelengths highlights subtle differences. Underneath SDO-imagery compares the outlook of flare number 3 in AIA 094 at several million degrees (left) with that in the AIA 304 filter at temperatures around 80.000 degrees (right). Some of the differences are mainly due to temperature differences in the various flare structures, making them invisible in one filter or the other. An example is the "hot" big southern loop which is not visible in the "cold" AIA 304 images. Despite the quite dynamical character of the flaring events, none of them were associated with a coronal mass ejection. Clips of the events are at http://www.stce.be/news/507/welcome.html
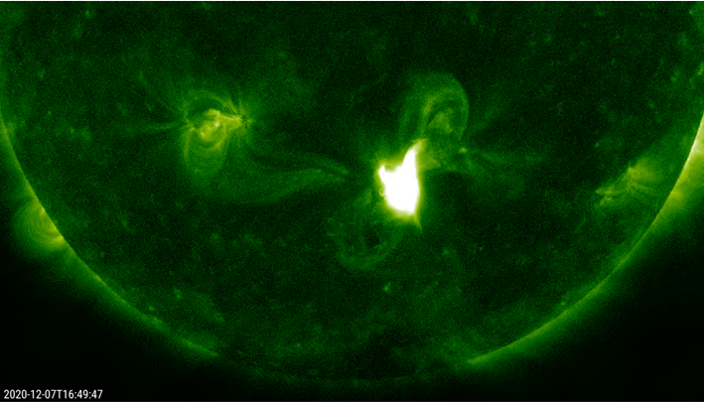
Ready or not... Here I come!
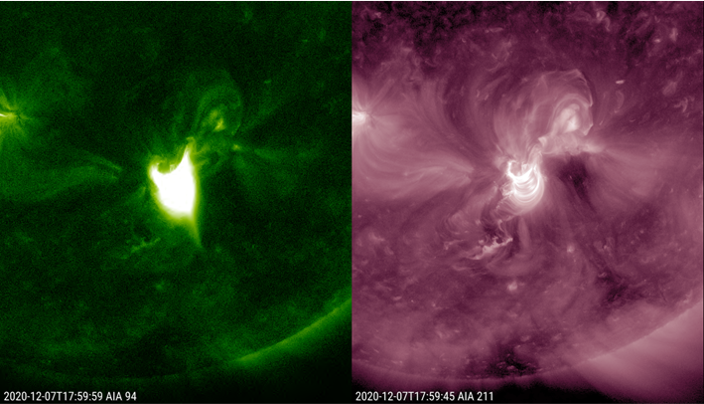
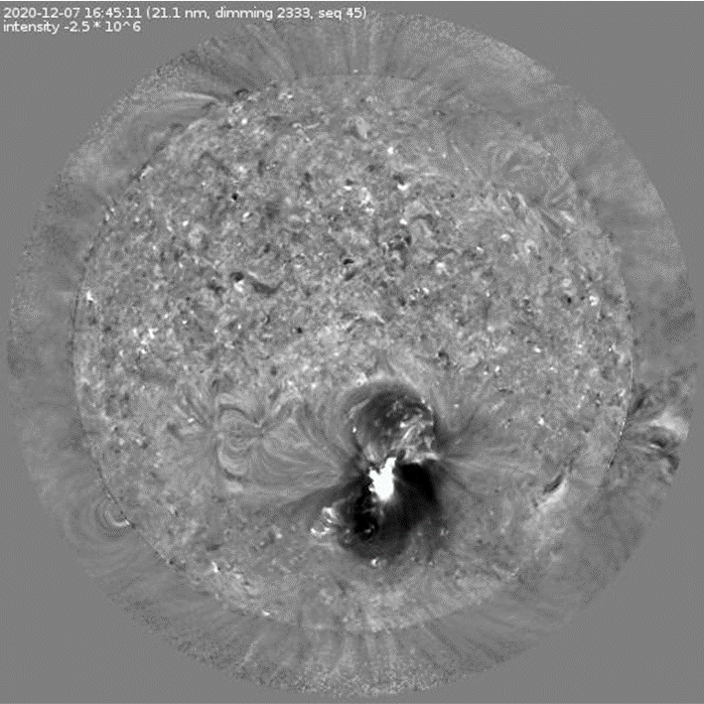
The proverbial ink of the previous STCE Newsitem (http://www.stce.be/news/507/welcome.html ) was not even dry, or NOAA 2790, responsible for last week's M4 flare and numerous low-level C-class events, produced a long duration C7.4 flare peaking on 7 December at 16:32UTC. The flare lasted for 107 minutes and produced relatively strong bursts on various radio wavelengths. The 10.7 cm radio flux doubled in value making the event a tenflare. SDO's extreme ultraviolet imagery (EUV - https://sdo.gsfc.nasa.gov/data/aiahmi/ ) showed that the eruption took place in the same "S-shaped" area as the previous flares, however the magnetic configuration was such that it allowed for a full magnetic reconnection. The candle-flame like structure visible in AIA 094 filter (green colored) is not an imaging artefact. It is called a cusp and indicative of the magnetic reconnection that took place and an indicator that it was associated with a coronal mass ejection (CME). Comparing images from the AIA 094 with those from the somewhat less hot AIA 211 filter (pink colored) reveals post-flare coronal loops and coronal dimming in the latter. The difference imagery of the AIA 211 filter (grey colored; one image subtracted from the next), available at the SIDC's Solar Demon website (http://solardemon.oma.be/ ) reveals also the presence of a coronal wave moving away from the blast site. Clips are available at http://www.stce.be/news/508/welcome.html
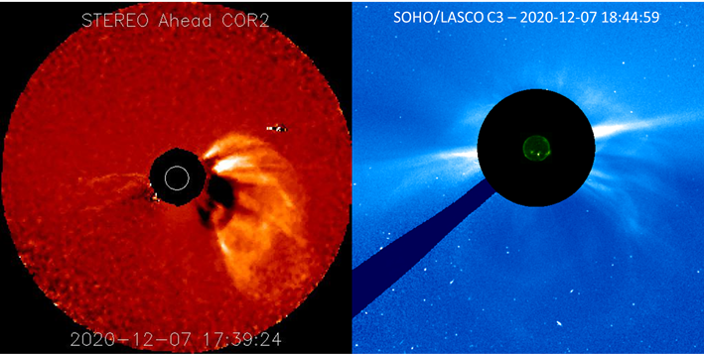
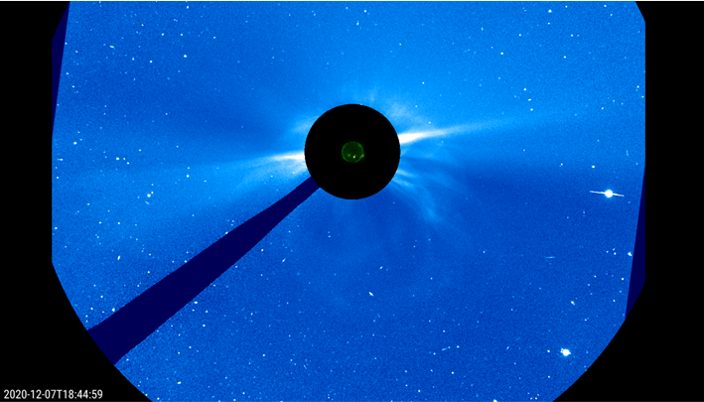
All the aforementioned features are indicative of the presence of a coronal mass ejection (CME), a cloud of charged particles ejected into space. Due to the location of the source region NOAA 2790, one could expect this CME to be directed to Earth. Sure enough, coronagraphic imagery from SOHO (https://sohowww.nascom.nasa.gov/ ) revealed a full halo CME shortly after the flare started. Based on imagery from the STEREO-A spacecraft (https://stereo-ssc.nascom.nasa.gov/ ), which had a side-view of the flaring event, the speed of the CME is estimated to be around 1250 km/s. SIDC forecasters (http://www.sidc.be/ ) thus expect that the projected arrival time is (already) on 9 December around 17:00UTC (+/- 12 hours). The strength of the resulting geomagnetic disturbance is somewhat uncertain, due to the expected presence of high speed stream from a coronal hole, and the uncertainty in the direction of the magnetic field inside the CME. In the worst case, if Earth encounters the bulk of the CME combined with a strong southward component ("negative Bz"), then a strong geomagnetic storm may ensue. In the opposite case, even then the passage of the CME will not go unnoticed. Stay tuned for further updates!
Campfire physics
At the AGU press briefing, the team that takes care of EUI onboard of Solar Orbiter was honoured for building the foundations of 'campfire physics'.
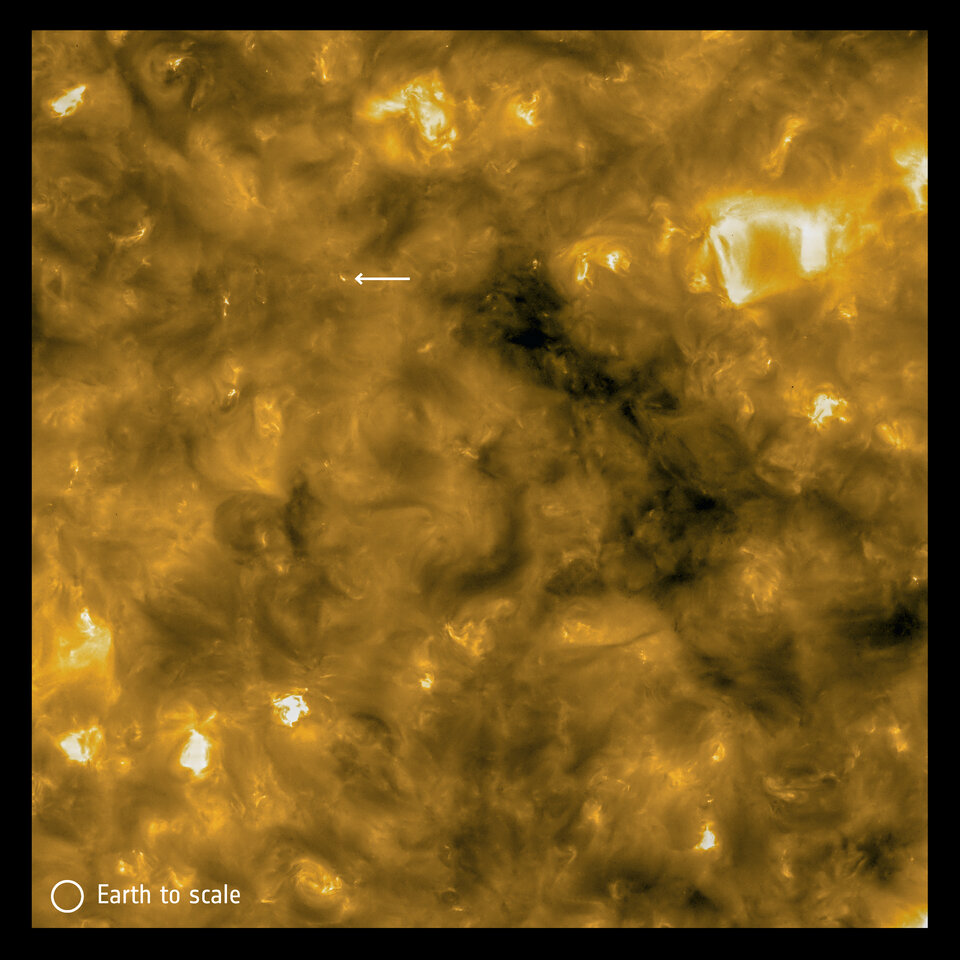
The EUI team saw in EUI images made during the first close solar passage, little campfires crackling in areas on the sun which are considered to be quiet. This was a wow moment. Campfires are small versions of the known solar flares and could be the key to the 'hot corona mystery': how is it possible that the outer layer of the solar atmosphere is million degrees, while the solar surface is only at 5000 degrees?
No doubt, this is cool stuff.
Read the whole story: https://www.esa.int/Science_Exploration/Space_Science/Solar_Orbiter/Solar_Orbiter_turning_pictures_into_physics
Review of solar activity
Solar activity was overall dominated by the M4.4 flare peaking 13:11UT, November 29 from over the East limb from a region numbered 2790 later in the week when appearing on the visible disc. However, as soon as on disc it was of beta type at most showing a general decaying trend and only releasing some C level flares. The largest region on disc at the start of the week NOAA AR 2786 (Beta-gamma) also showed a steady decay in complexity over the week and was responsible for most of the remaining C flares. There were a number of additional regions on disc early in the week but also these were overall on decay as the week progressed.
The M4 flare was associated with a type II radio burst and EUV wave. In SoHO/LASCO C2, a corresponding CME was visible from around 13:25UT (the true time of emergence in C2 view must be in the data gap between 12:48UT and 13:25UT). The CME was directed well toward the East of the Sun-Earth line with a projected speed of around 1500 km/s. While the bulk is directed off the Sun-Earth line the associated shock wave leaves an asymmetric full halo signature in SoHO/LASCO C2 and C3 imagery. The bulk of the CME was hence not expected to arrive to Earth, and the CME was most probably even directed backward. However, given the uncertainty in its exact direction a glancing blow and arrival of the shock wave could not fully be excluded and in that event was expected late December 1 or early December 2.
Before loosing its spots, NOAA 2787 was the source of a C1 flare peaking at 7:21 December 1 with a dimming and an associated CME visible in SoHO/LASCO from 7:12UT. While the core of that CME was clearly not directed directly Earthward, a shock signature could be seen expanding over the South and there are also faint signatures over the North. Hence the CME could potentially be claimed to be classified as partial Halo. It was assessed there was a chance for a glancing blow at Earth from this CME expected from the morning of December 4.
The larger than 10MeV proton flux became moderately enhanced after the M4.4 flare, rising eventually to 7pfu maximum (under the event threshold) before slowly returning to background conditions over the remainder of the week.
PROBA2 Observations
Solar Activity
Solar flare activity fluctuated between very low and low during the week.
In order to view the activity of this week in more detail, we suggest to go to the following website from which all the daily (normal and difference) movies can be accessed: https://proba2.oma.be/ssa
This page also lists the recorded flaring events.
A weekly overview movie can be found here (SWAP week 558). https://proba2.sidc.be/swap/data/mpg/movies/weekly_movies/weekly_movie_2020_11_30.mp4
Details about some of this week’s events can be found further below.
If any of the linked movies are unavailable they can be found in the P2SC movie repository here http://proba2.oma.be/swap/data/mpg/movies/
Tuesday Dec 01
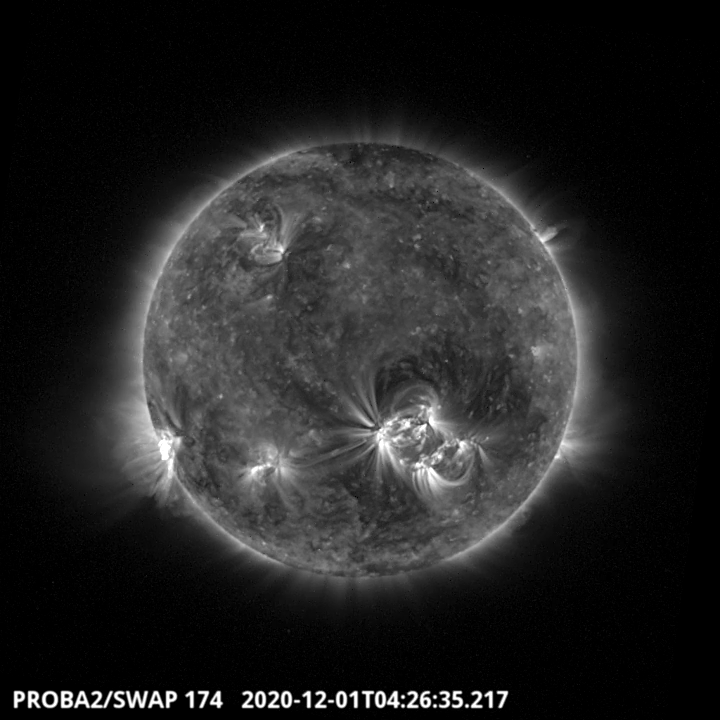
An eruption associated with a C3.8 flare was observed by SWAP on the south eastern limb of the solar disk on December 1, around 04:27 UT, as shown in the SWAP image above. It is the biggest flare of the week. Find a movie of the event here (SWAP movie) http://proba2.oma.be/swap/data/mpg/movies/20201201_swap_movie.mp4
The International Sunspot Number by Silso
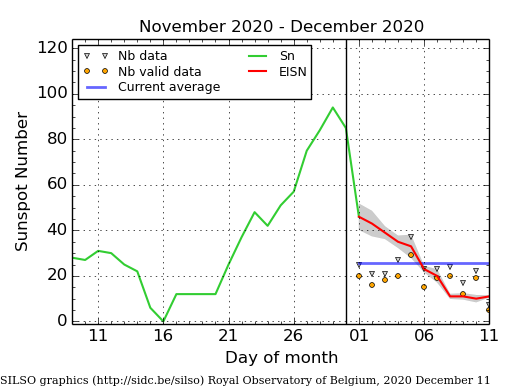
The daily Estimated International Sunspot Number (EISN, red curve with shaded error) derived by a simplified method from real-time data from the worldwide SILSO network. It extends the official Sunspot Number from the full processing of the preceding month (green line). The plot shows the last 30 days (about one solar rotation). The horizontal blue line shows the current monthly average. The yellow dots gives the number of stations that provided valid data. Valid data are used to calculate the EISN. The triangle gives the number of stations providing data. When a triangle and a yellow dot coincide, it means that all the data is used to calculate the EISN of that day.
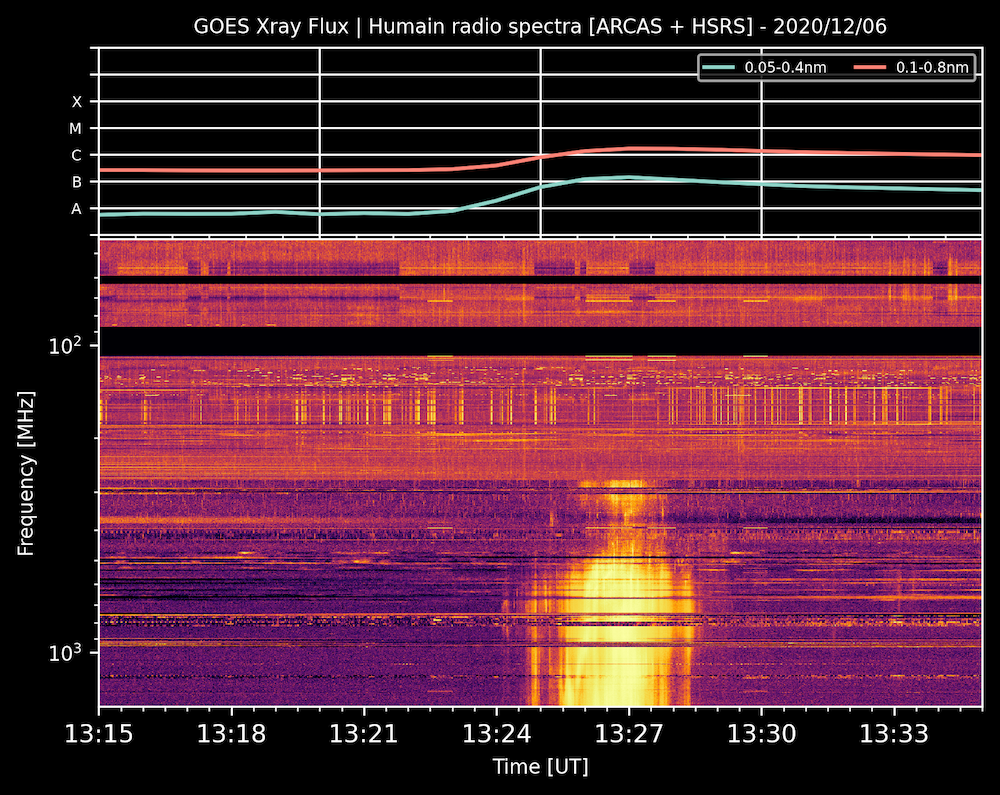
Radio burst list
Data and hour: 06 December 2020 13:24 - 13:29
Radio Event: Groups of decimetry Type III bursts and/or pulsations, Peak flux 304 SFU at 1415 MHz
Context: C1.6 flare in NOAA AR 2790
Quick look
Complete list: http://sidc.be/humain/hsrs_events_cycle_25.php
Review of geomagnetic activity
The week started with a somewhat unexpected arrival of a moderate high speed stream in the morning of November 30. Solar wind speed rose to around 550 km/s. During the rise, magnetic field reached a peak of 12nT, while Bz remained mostly positive. The magnetic field phi angle jumped from the positive (away from the Sun) into the negative (towards the Sun) sector and remained so for the remainder of week until noon December 6.
Accuracy of DSCOVR measurements of Solar wind speed and temperature, was however compromised by low density conditions for a significant period during the week. Based also on ACE measurement the remainder of the week showed a return to background conditions with in particular no signs of the possible CME arrivals.
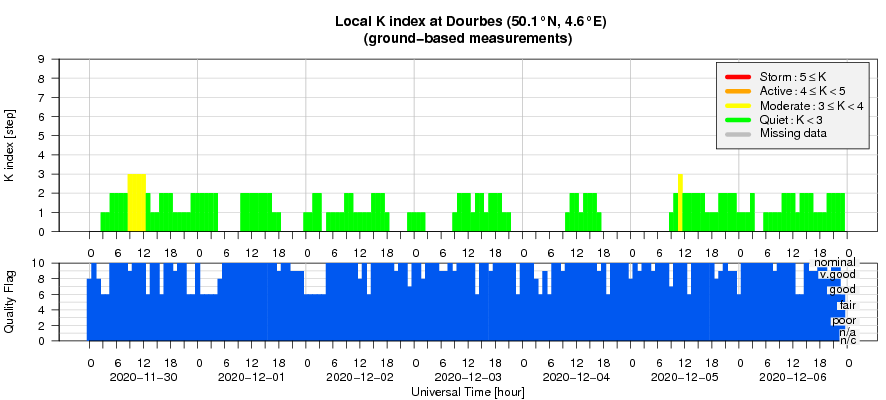
Geomagnetic conditions were quiet to unsettled (local K Dourbes and NOAA Kp 0-3).
The greater than 2MeV electron flux did only briefly exceed the 1000 pfu alert threshold during 3 of the diurnal maxima. The 24h electron fluence was mostly at moderate levels.
Geomagnetic Observations at Dourbes
The SIDC Space Weather Briefing
The Space Weather Briefing presented by the forecaster on duty from Nov 30 to Dec 6.. It reflects in images and graphs what is written in the Solar and Geomagnetic Activity report.

A pdf-version:http://www.stce.be/briefings/20201207_SWbriefing.pdf
The movie:http://www.stce.be/briefings/20201207_SWbriefing.m4v
Review of ionospheric activity
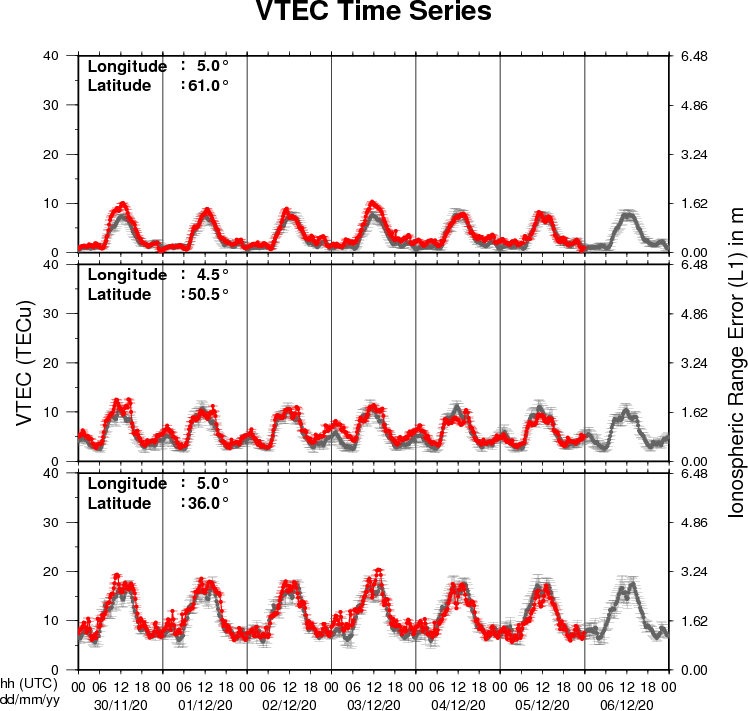
The figure shows the time evolution of the Vertical Total Electron Content (VTEC) (in red) during the last week at three locations:
a) in the northern part of Europe(N61°, 5°E)
b) above Brussels(N50.5°, 4.5°E)
c) in the southern part of Europe(N36°, 5°E)
This figure also shows (in grey) the normal ionospheric behaviour expected based on the median VTEC from the 15 previous days.
The VTEC is expressed in TECu (with TECu=10^16 electrons per square meter) and is directly related to the signal propagation delay due to the ionosphere (in figure: delay on GPS L1 frequency).
The Sun's radiation ionizes the Earth's upper atmosphere, the ionosphere, located from about 60km to 1000km above the Earth's surface.The ionization process in the ionosphere produces ions and free electrons. These electrons perturb the propagation of the GNSS (Global Navigation Satellite System) signals by inducing a so-called ionospheric delay.
See http://stce.be/newsletter/GNSS_final.pdf for some more explanations ; for detailed information, see http://gnss.be/ionosphere_tutorial.php
Again not relevant
The picture shows the first views of the Sun obtained with Solar Orbiter's EUI on 30 May 2020, revealing the omnipresent miniature campfires.
But, there is something in the picture which is not solar. Can you say where it is and what it is?
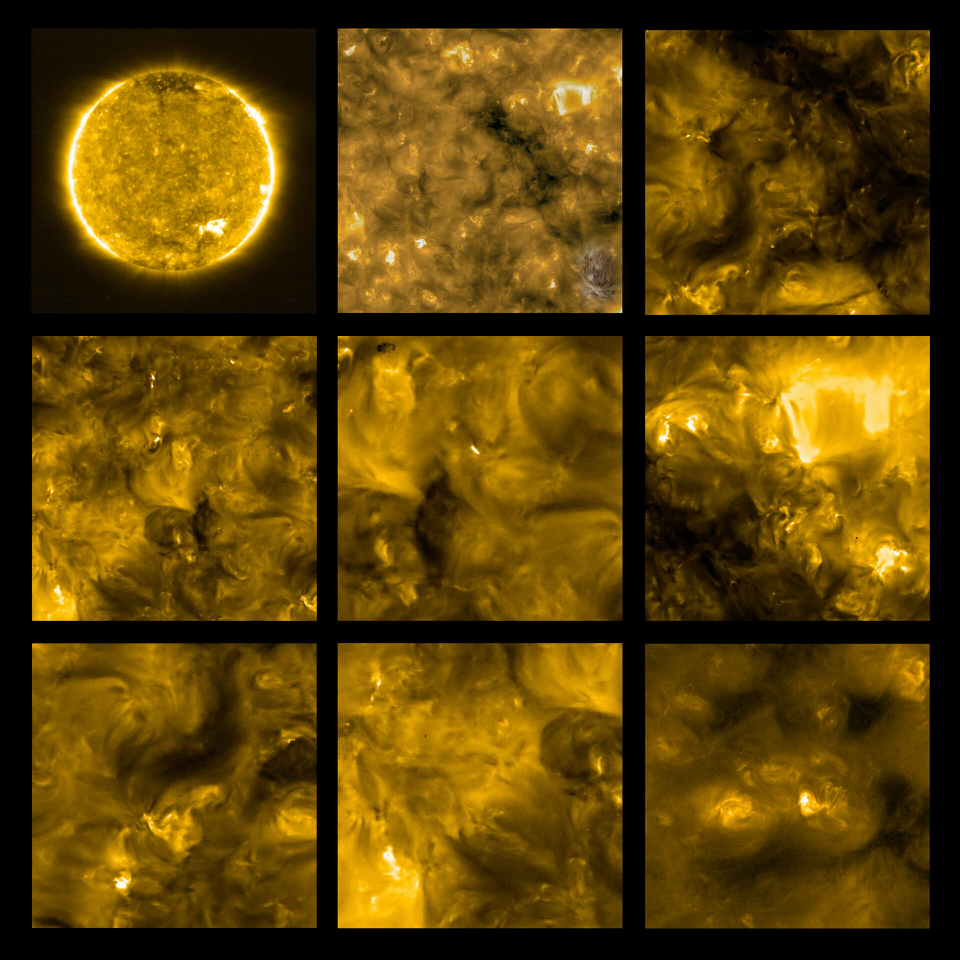
Solution: see next week newsletter.