- Table of Content
- 1.Fireball!
- 2.Review of sola...
- 3.The Internatio...
- 4.PROBA2 Observa...
- 5.Review of geom...
- 6.Geomagnetic Ob...
- 7.The SIDC Space...
- 8.Review of iono...
2. Review of solar activity
3. The International Sunspot Number by Silso
4. PROBA2 Observations (18 Jan 2021 - 24 Jan 2021)
5. Review of geomagnetic activity
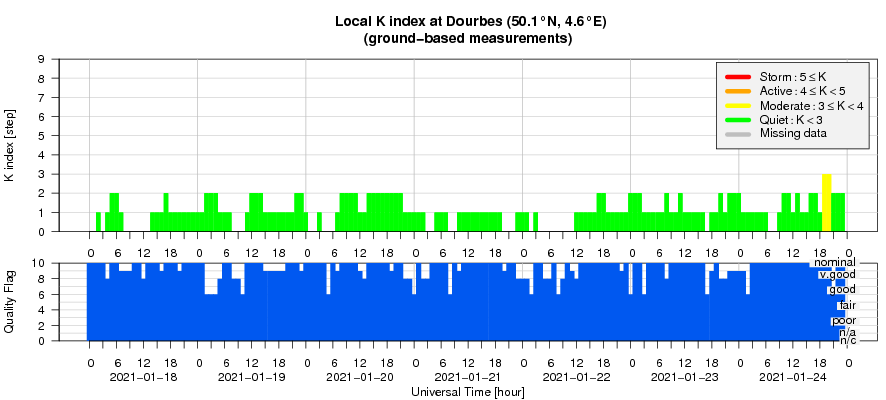
6. Geomagnetic Observations at Dourbes (18 Jan 2021 - 24 Jan 2021)
7. The SIDC Space Weather Briefing
8. Review of ionospheric activity (18 Jan 2021 - 24 Jan 2021)
Fireball!
Meteors, also called shooting stars, are tiny dust particles that quickly burn up in the Earth's atmosphere leaving a streak of light that is visible for only a fraction of a second. When refering to the dust particle before it entered the Earth's atmosphere, it is called a meteoroid. If the particle is large enough, it can survive its fiery passage through the Earth's atmosphere and fall on the Earth's surface. Then it is called a meteorite.
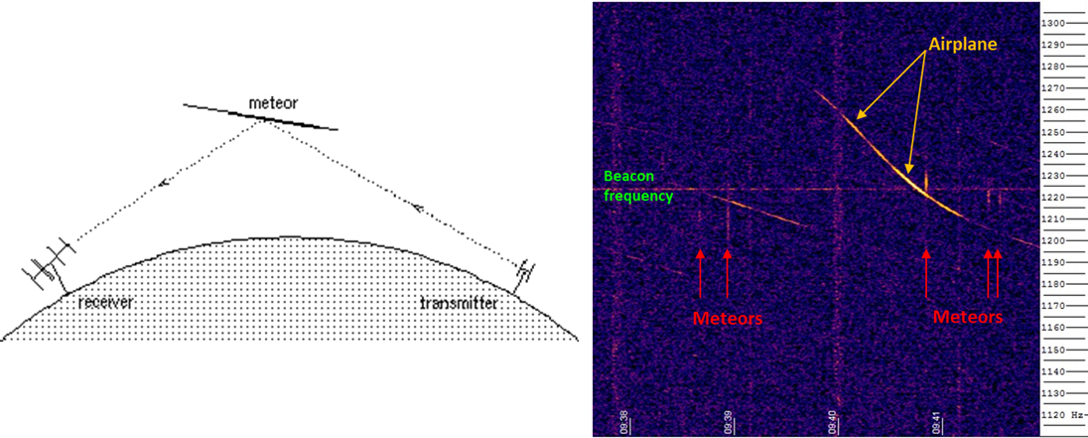
Even in case of cloudy weather, the meteors can still be observed by watching the radio signal they produce. BRAMS (Belgian RAdio Meteor Stations - https://brams.aeronomie.be/ ) is a network of radio receiving stations using forward scattering techniques to study the meteoroid population. The project is coordinated by the Royal Belgian Institute for Space Aeronomy (BISA - https://www.aeronomie.be/ ), in the frame of the Solar-Terrestrial Centre of Excellence (STCE - http://www.stce.be/ ). It is also a very fruitful collaboration between professionals and amateurs since most stations are hosted either by Belgian radioamateurs, groups of amateur astronomers or astronomical public observatories. A dedicated beacon was installed in September 2010 in Dourbes (South of Belgium) at the Centre de Géophysique du Globe which belongs to the Royal Meteorological Institute of Belgium (RMI - https://www.meteo.be/en/brussels ), and acts as the transmitter. It emits a clockwise circularly polarized signal at a frequency of 49.97 MHz with a constant power of 150W. The receiver, many kilometers away, scans a frequency range of about 200 Hz centered around this beacon frequency. These are called spectrograms, with time on the horizontal axis and frequency on the vertical axis. When a meteor enters the atmosphere, its trail (ionized particles) may reflect the radio signal from the transmitter to the receiver. As indicated in the spectrogram above, most meteor echoes appear as short vertical streaks. The longer, inversed-S shaped tracks are due to passing airplanes.
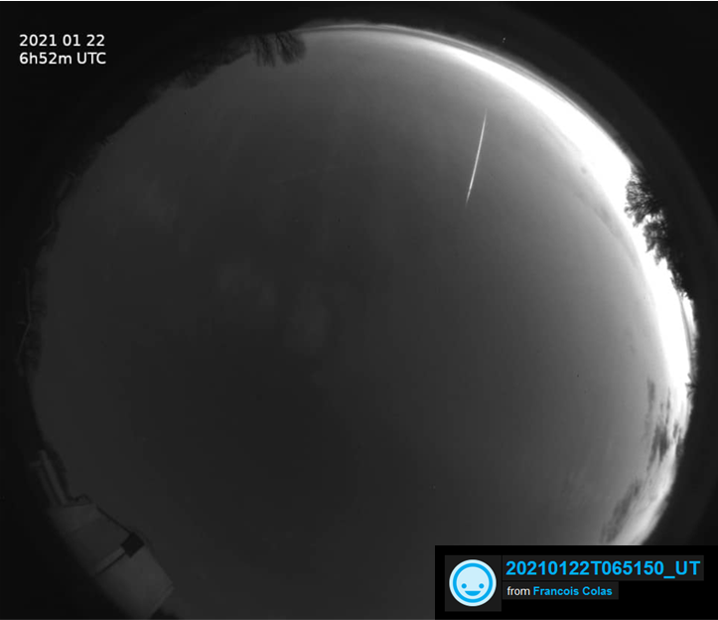
At 06:52UT on Friday 22 January 2021, observers in the Netherlands, Belgium, the United Kingdom and the north of France reported a bright meteor in the dawn sky (see the dedicated webpage of the International Meteor Organization (IMO) at https://www.imo.net/belgian-fireball-on-january-22/ for videos and reports). Its brightness was compared to be between that of the planet Venus and that of the full moon, and its green-bluish color seems to suggest that the source meteoroid consisted mostly of iron and nickle. Further analysis revealed that small pebble-sized fragments may have fallen in a relatively narrow region in the northwestern portion of Belgium. Nothing has been found yet, but the search continues (see the BISA twitter page at https://twitter.com/bira_iasb ).
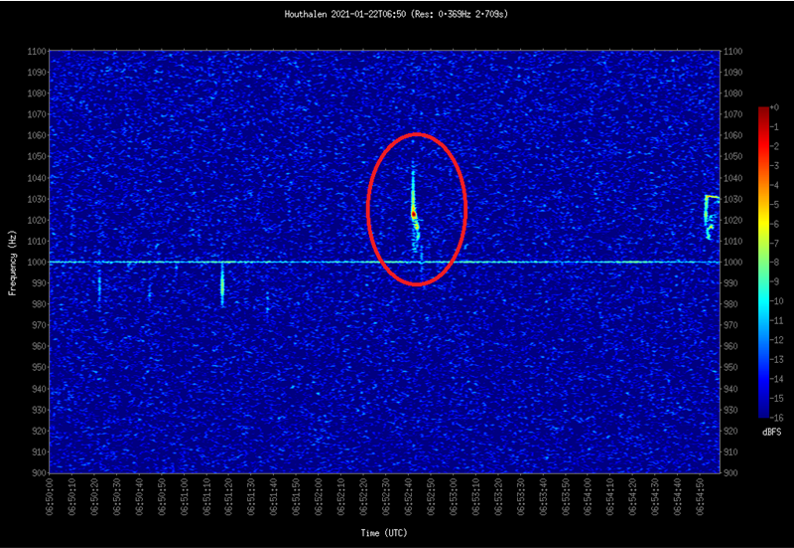
Initially, it was thought that stations of the BRAMS network had recorded the fireball in their spectrograms (above), but further detective work by Dr Hervé Lamy, researcher at BISA, revealed this was the echo of another meteor. Indeed, all BRAMS stations showed a meteor at 06h52m42s, but as more observations came in, it turned out that the exact time of the fireball was 06h51m50s, or about 50 seconds earlier. So it could not be the same event. One of the (to be confirmed) reasons why the fireball was not detected, may be that the trajectory was very inclined and that the meteor was coming from the north (most stations are "looking" to the south in the direction of Dourbes - see the upper left sketch in the first figure). The visible part of the fireball was calculated to be only from 70 to 30 km altitude, while usually, the reflection points for the radio wave are somewhere at 80 to 100 km altitude. Therefore it is thought that the object was too far to the north and at too low an altitude to be detected by the radio stations in Belgium.
Interested? You can participate in the scientific research by participating in the citizen science project "Radio Meteor Zoo". The idea is to manually count meteor echoes in BRAMS spectrograms during some meteor showers. More info on the website https://brams.aeronomie.be/zoo/
Review of solar activity
During this week four sunspot groups were observed on visible side of the solar disc: Catania sunspot groups 65, 66, 67 and 68 (NOAA Active Region 2796, 2797, 2798, 2799, respectively). The solar flaring activity was low with two C-class flares and 33 B-class flares reported. Both C-class flares originated from NOAA AR 2798.
Two filaments erupted in the southern hemisphere on January 20 and January 22. These eruptions were associated with narrow and slow CMEs.
The solar proton flux remained at the background level.
The low latitude extension of the northern polar coronal hole (positive polarity) crossed the central meridian at the beginning of the week.
The small but well defined, equatorial coronal hole of negative polarity reached the central meridian on January 20.
The International Sunspot Number by Silso
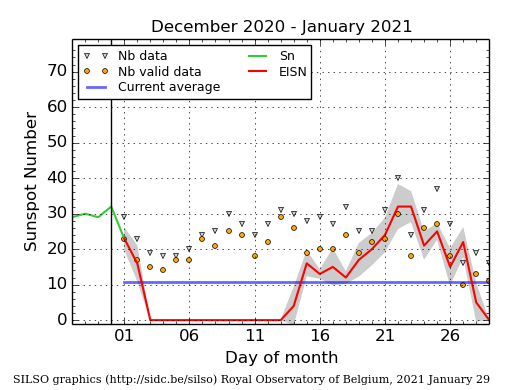
The daily Estimated International Sunspot Number (EISN, red curve with shaded error) derived by a simplified method from real-time data from the worldwide SILSO network. It extends the official Sunspot Number from the full processing of the preceding month (green line), a few days more than one solar rotation. The horizontal blue line shows the current monthly average. The yellow dots gives the number of stations that provided valid data. Valid data are used to calculate the EISN. The triangle gives the number of stations providing data. When a triangle and a yellow dot coincide, it means that all the data is used to calculate the EISN of that day.
PROBA2 Observations (18 Jan 2021 - 24 Jan 2021)
Solar Activity
Solar flare activity fluctuated between very low and low during the week.
In order to view the activity of this week in more detail, we suggest to go to the following website from which all the daily (normal and difference) movies can be accessed: https://proba2.oma.be/ssa
This page also lists the recorded flaring events.
A weekly overview movie can be found here (SWAP week 565). http://proba2.oma.be/swap/data/mpg/movies/weekly_movies/weekly_movie_2021_01_18.mp4
Details about some of this week's events can be found further below.
If any of the linked movies are unavailable they can be found in the P2SC movie repository here https://proba2.oma.be/swap/data/mpg/movies/
Wednesday Jan 20
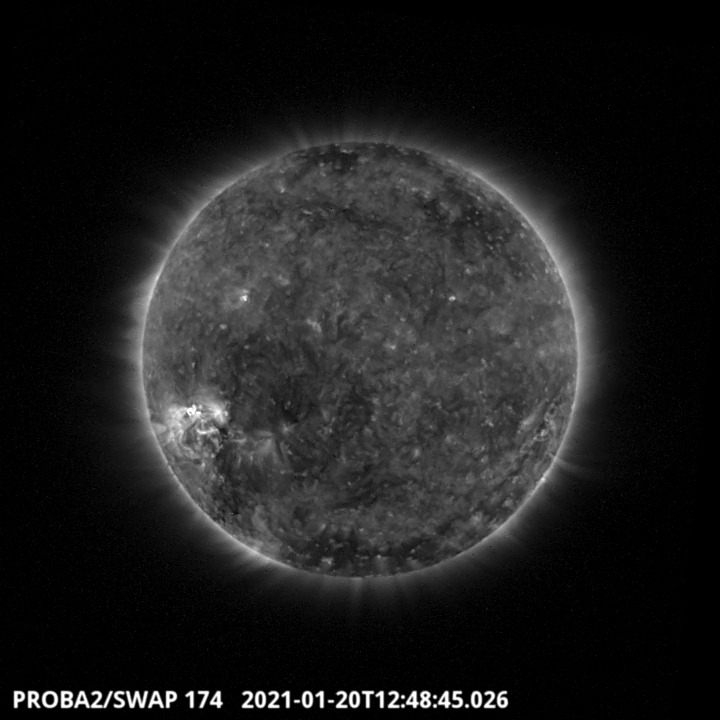
The largest flare of the week was a C1.4 flare, which erupted around 12:48 UT on 2021-Jan-20. It was observed by both SWAP and LYRA and was associated with the Active Region 2798 labelled by NOAA, localized at S19E51. This active region provides numerous B-flares during the week. Find a movie of the events here (SWAP movie) http://proba2.oma.be/swap/data/mpg/movies/20210120_swap_movie.mp4
Friday Jan 22
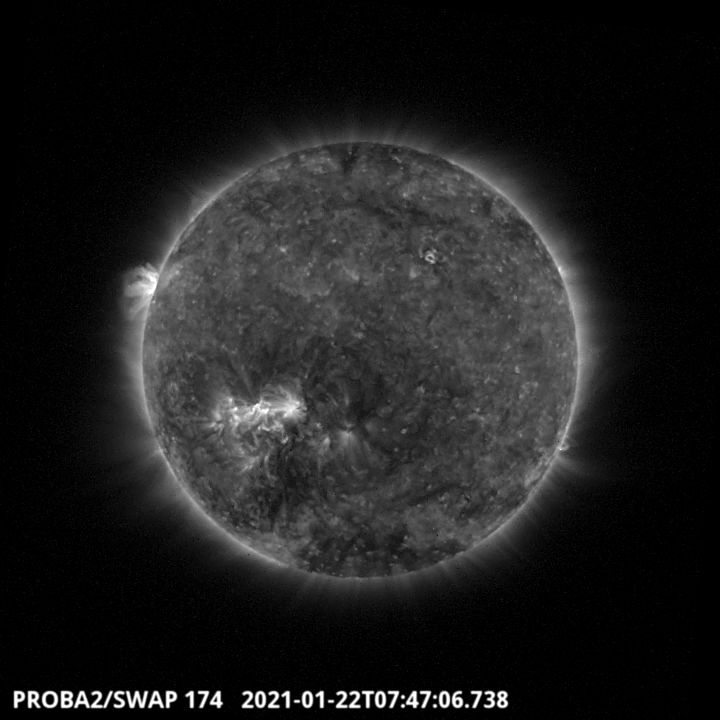
A central coronal hole crossed the central meridian around 7:47UT on 2021-01-22. It is visible on the SWAP image above. Find a movie of the events here (SWAP movie)
http://proba2.oma.be/swap/data/mpg/movies/20210122_swap_movie.mp4
Review of geomagnetic activity
Earth was inside a slow solar wind with speed between 300 and 350 km/s. On January 24, its speed and magnetic field strength increased marking the arrival of the solar wind from the equatorial, negative polarity coronal hole.
The geomagnetic conditions were quiet. Only two intervals of unsettled geomagnetic conditions were reported by the local station at Dourbes and NOAA.
The SIDC Space Weather Briefing
The Space Weather Briefing presented by the forecaster on duty from Jan 17 to 24. It reflects in images and graphs what is written in the Solar and Geomagnetic Activity report.

A pdf-version: https://www.stce.be/briefings/20210125_SWbriefing.pdf
The movie: https://www.stce.be/briefings/20210125_SWbriefing.m4v
Review of ionospheric activity (18 Jan 2021 - 24 Jan 2021)
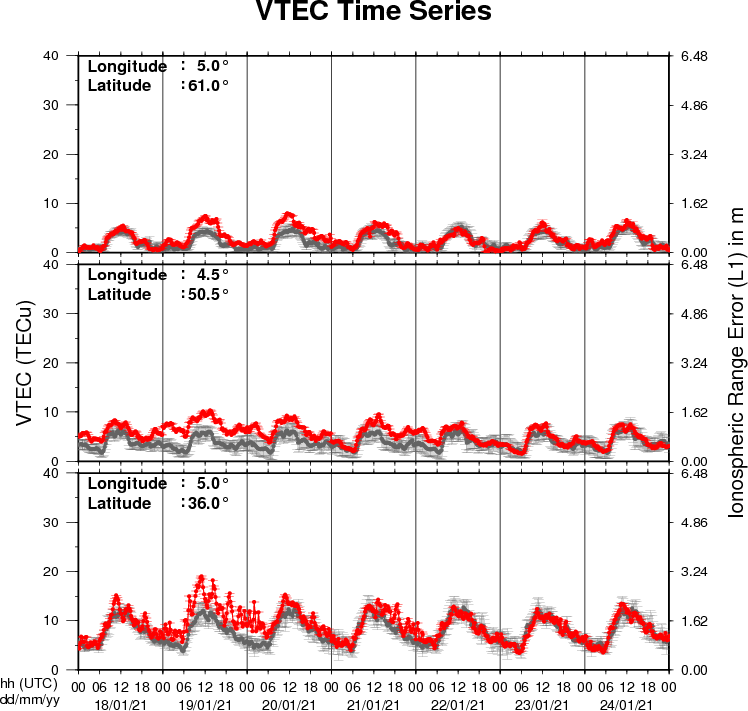
The figure shows the time evolution of the Vertical Total Electron Content (VTEC) (in red) during the last week at three locations:
a) in the northern part of Europe(N61°, 5°E)
b) above Brussels(N50.5°, 4.5°E)
c) in the southern part of Europe(N36°, 5°E)
This figure also shows (in grey) the normal ionospheric behaviour expected based on the median VTEC from the 15 previous days.
The VTEC is expressed in TECu (with TECu=10^16 electrons per square meter) and is directly related to the signal propagation delay due to the ionosphere (in figure: delay on GPS L1 frequency).
The Sun's radiation ionizes the Earth's upper atmosphere, the ionosphere, located from about 60km to 1000km above the Earth's surface.The ionization process in the ionosphere produces ions and free electrons. These electrons perturb the propagation of the GNSS (Global Navigation Satellite System) signals by inducing a so-called ionospheric delay.
See http://stce.be/newsletter/GNSS_final.pdf for some more explanations ; for detailed information, see http://gnss.be/ionosphere_tutorial.php
