- Table of Content
- 1.Enhanced elect...
- 2.Picture of the...
- 3.Review of sola...
- 4.PROBA2 Observa...
- 5.The Internatio...
- 6.Review of geom...
- 7.Geomagnetic Ob...
- 8.The SIDC Space...
- 9.Review of iono...
2. Picture of the month - GNSS stations on the South Pole
3. Review of solar activity
4. PROBA2 Observations (25 Jan 2021 - 31 Jan 2021)
5. The International Sunspot Number by Silso
6. Review of geomagnetic activity
7. Geomagnetic Observations at Dourbes (25 Jan 2021 - 31 Jan 2021)
8. The SIDC Space Weather Briefing
9. Review of ionospheric activity (25 Jan 2021 - 31 Jan 2021)
Enhanced electron flux
The greater than 2 MeV electron flux is measured by the GOES satellites (https://www.swpc.noaa.gov/products/goes-electron-flux-dynamic-plot ) in their geostationary orbit, which is located in the Earth’s outer radiation belt. These electrons have energies of 2 MeV or more, and are associated with a type of spacecraft charging referred to as deep-dielectric charging. Deep-dielectric charging occurs when energetic electrons penetrate into spacecraft components. There, these energetic electrons can accumulate and when the charge is sufficiently high, a discharge may occur (ESD: ElectroStatic Discharge) between the electronic components causing anomalous satellite behaviour. This may result in a temporal or complete impairment of a satellite. A notable example of satellite damage due to ESD is the consecutive outage of Telesat Canada’s Anik-E1 and Anik-E2 geostationary communication satellites on 20 January 1994 that interrupted telecommunication and data transmission services across Canada for hours.

Fast solar wind streams from Coronal Holes (CHs) and interplanetary coronal mass ejections (ICMEs) are known to drive ultra-low-frequency (ULF) waves in the magnetosphere. These can transfer energy directly from the solar wind through the system to the ionosphere. These magnetic oscillations have periods ranging from 10s to 100s of seconds (known as Pc5 waves) and have been shown to depend strongly on solar wind speed. To visualize the effect of the solar wind on the Earth’s magnetosphere more clearly, one can imagine blowing across a piece of paper, making it flutter with your breath. The solar wind can have a similar effect on magnetic fields. Indeed, magnetic pulsations are essentially flutters propagating down the flanks of Earth's magnetosphere excited by the "breath" of the Sun. These are the "pulsations continuous" - or "Pc" for short. One important aspect of the Pc5 waves is their potential ability to accelerate electrons to relativistic energy within the outer radiation belts.
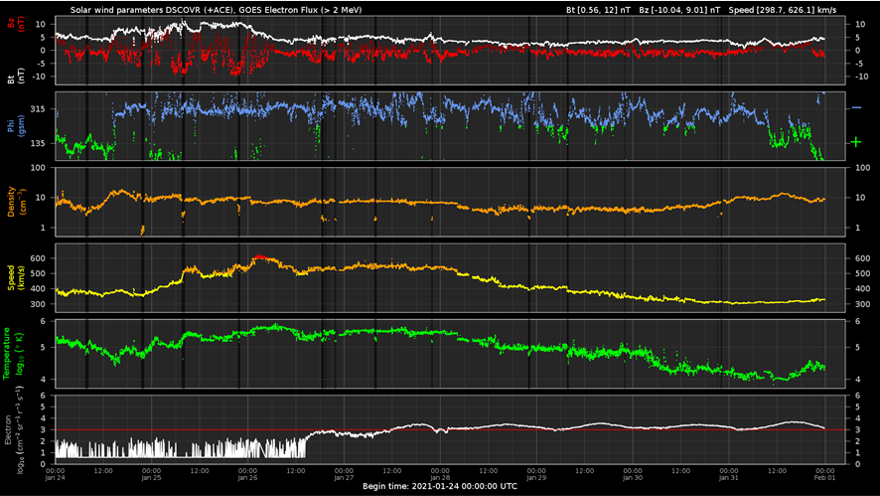
On 24 January, the high speed stream associated with a coronal hole started to influence the earth environment. Solar wind speed (the yellow curve in the DSCOVR data) gradually increased to 600 km/s on 25 January. One day later, the electron population became responsive to the magnetic oscillations created by the enhanced solar wind, reaching the alert threshold of 1000 pfu (particle flux units; 1 pfu = 1 electron / cm2 s sr) on 27 January around noon. The electron flux remained at moderate levels for the rest of the week, as can be seen in the white GOES curve (lower chart) with a maximum of 5,068 pfu on 31 January. As such, the 24 hours electron fluence (i.e. the values of the electron flux accumulated over a full day) also remained at fairly moderate levels, and no permanent satellite outages have been reported.
Picture of the month - GNSS stations on the South Pole
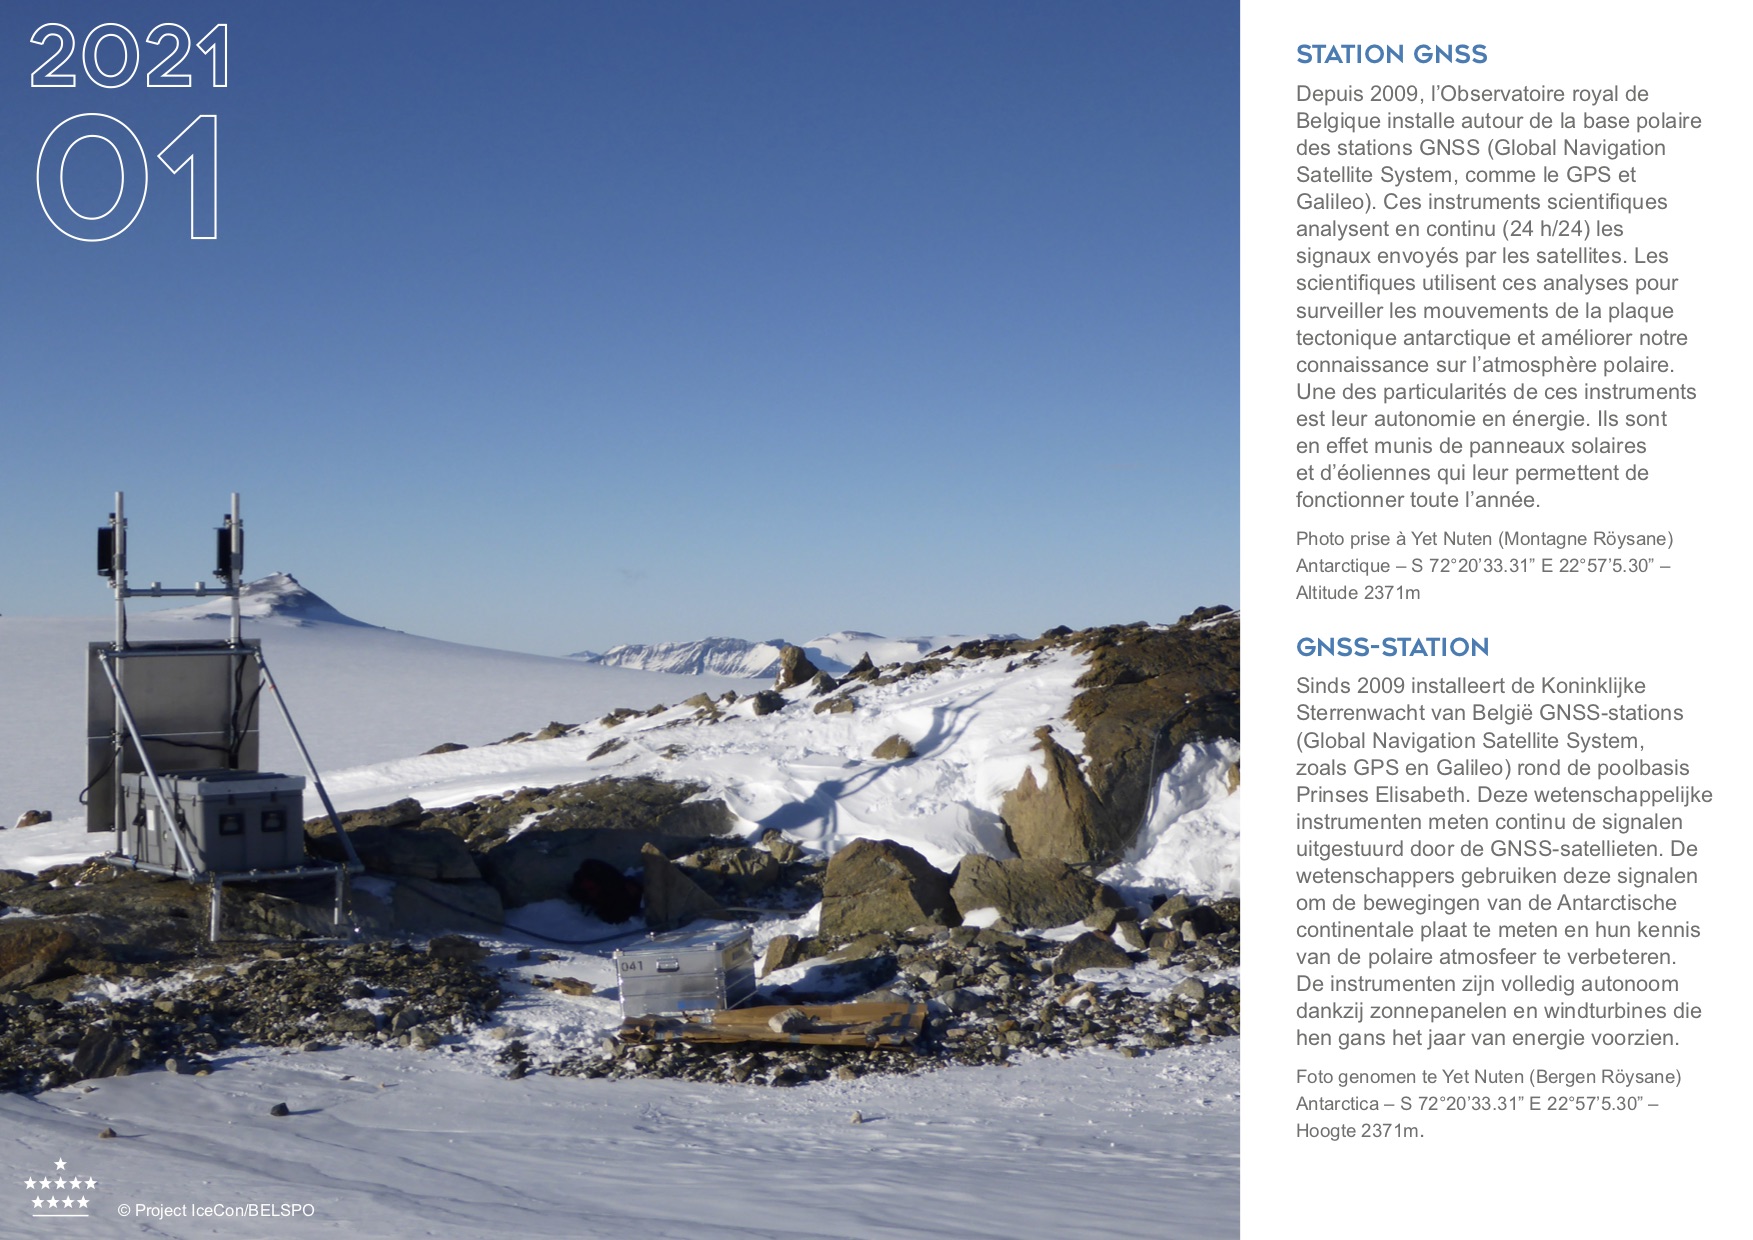
Since 2009, the ROB instals GNSS stations on the polar basis 'Prinses Elisabeth'. These instruments measure continuously the signals sent by GNSS-satellites. We use these signals to track the movement of the Antarctic continental plate and to learn more about the polar atmosphere. The instruments work autonomously thanks to the solar panels and wind turbines that deliver energy throughout the whole year.
Review of solar activity
Solar activity was at very low levels. Over the week there were in total four active regions (ARs) on the solar disk, NOAA AR 2797 to AR 2800. The active regions did not produce any significant flares. NOAA AR2799 was most active at the start of the week, producing a B5.0 flare on Jan 25. NOAA AR 2800 produced multiple low-level B-class flares on Jan 28 and 29.
From Jan 29 there were no sunspots on the visible solar disk.
Over the week, the daily 10.7cm solar radio flux decreased from an initial value of 77 sfu to 73 sfu by the end of the period.
No Earth directed Coronal Mass Ejections (CMEs) have been detected in the available coronagraphic imagery.
The greater than 10 MeV proton flux was at nominal values.
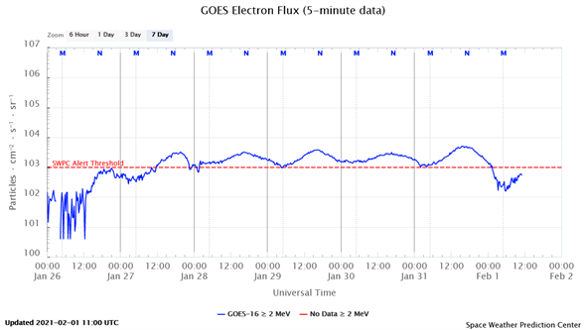
The greater than 2 MeV electron flux first exceeded the 1000 pfu alert threshold from Jan 27. It continued to be at high levels for the rest of the week remaining mostly above this alert threshold.
The greater than 2 MeV electron fluence was also at moderate levels since Jan 27.
PROBA2 Observations (25 Jan 2021 - 31 Jan 2021)
Solar Activity
Solar flare activity was very low during the week.
In order to view the activity of this week in more detail, we suggest to go to the following website from which all the daily (normal and difference) movies can be accessed: https://proba2.oma.be/ssa
This page also lists the recorded flaring events.
A weekly overview movie can be found here (SWAP week 566): https://proba2.sidc.be/swap/data/mpg/movies/weekly_movies/weekly_movie_2021_01_25.mp4
Details about some of this week's events can be found further below.
If any of the linked movies are unavailable they can be found in the P2SC movie repository here: https://proba2.oma.be/swap/data/mpg/movies/
Monday Jan 25
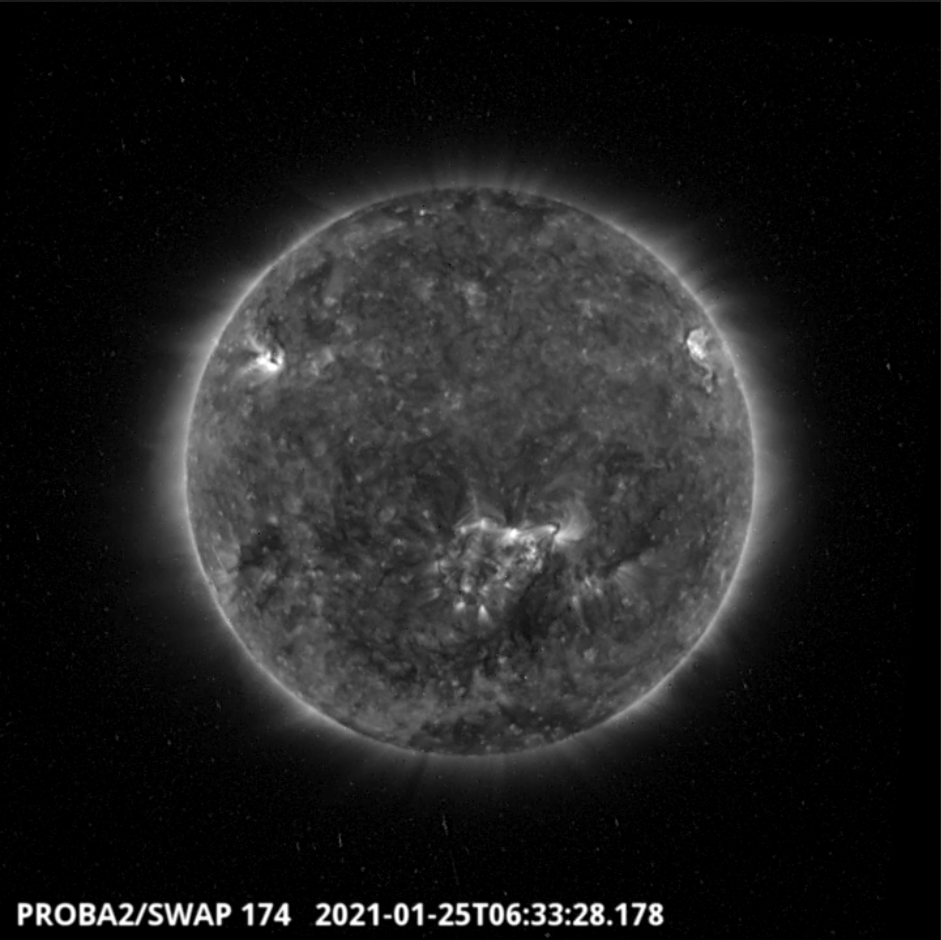
The largest flare of the week was a B5.0 flare, which was observed by SWAP and LYRA on 2021-Jan-25 and was associated with the NOAA AR2799. The flare occurred in the north-western quadrant of the solar disk, as shown in the SWAP image above taken at 06:33 UT.
Find a movie of the event here: https://proba2.sidc.be/swap/movies/20210125_swap_movie.mp4 (SWAP movie).
The International Sunspot Number by Silso

The daily Estimated International Sunspot Number (EISN, red curve with shaded error) derived by a simplified method from real-time data from the worldwide SILSO network. It extends the official Sunspot Number from the full processing of the preceding month (green line), a few days more than one solar rotation. The horizontal blue line shows the current monthly average. The yellow dots gives the number of stations that provided valid data. Valid data are used to calculate the EISN. The triangle gives the number of stations providing data. When a triangle and a yellow dot coincide, it means that all the data is used to calculate the EISN of that day.
Review of geomagnetic activity
Solar wind parameters were at elevated levels for the first half of the week, with a maximum speed of 620 km/s and a minimum Bz of -10 nT, as the Earth was under the influence of the high-speed stream associated with the negative polarity coronal hole (CH) that began to traverse the central meridian on Jan 20.
From Jan 28, the solar wind speed began to gradually decrease and stabilized around 300 km/s.
The direction of the interplanetary magnetic field was predominantly directed towards the Sun (phi angle in the negative sector) until Jan 31 at 10 UT when it switched sectors.
Geomagnetic activity was at unsettled to active levels for the first half of the week, with one period of minor storm conditions on Jan 25. From Jan 28, the geomagnetic activity then returned to mostly quiet conditions.
Geomagnetic Observations at Dourbes (25 Jan 2021 - 31 Jan 2021)

The SIDC Space Weather Briefing
The Space Weather Briefing presented by the forecaster on duty from Jan 24 to 31. It reflects in images and graphs what is written in the Solar and Geomagnetic Activity report.
A pdf-version: https://www.stce.be/briefings/20210201_SWbriefing.pdf
The movie: https://www.stce.be/briefings/20210201_SWbriefing.m4v
Review of ionospheric activity (25 Jan 2021 - 31 Jan 2021)

The figure shows the time evolution of the Vertical Total Electron Content (VTEC) (in red) during the last week at three locations:
a) in the northern part of Europe(N61°, 5°E)
b) above Brussels(N50.5°, 4.5°E)
c) in the southern part of Europe(N36°, 5°E)
This figure also shows (in grey) the normal ionospheric behaviour expected based on the median VTEC from the 15 previous days.
The VTEC is expressed in TECu (with TECu=10^16 electrons per square meter) and is directly related to the signal propagation delay due to the ionosphere (in figure: delay on GPS L1 frequency).
The Sun's radiation ionizes the Earth's upper atmosphere, the ionosphere, located from about 60km to 1000km above the Earth's surface.The ionization process in the ionosphere produces ions and free electrons. These electrons perturb the propagation of the GNSS (Global Navigation Satellite System) signals by inducing a so-called ionospheric delay.
See http://stce.be/newsletter/GNSS_final.pdf for some more explanations ; for detailed information, see http://gnss.be/ionosphere_tutorial.php