- Table of Content
- 1.Rise of the CM...
- 2.Review of sola...
- 3.PROBA2 Observa...
- 4.The Internatio...
- 5.Review of geom...
- 6.Geomagnetic Ob...
- 7.The SIDC Space...
- 8.Review of iono...
2. Review of solar activity
3. PROBA2 Observations (12 Apr 2021 - 18 Apr 2021)
4. The International Sunspot Number by Silso
5. Review of geomagnetic activity
6. Geomagnetic Observations at Dourbes (12 Apr 2021 - 18 Apr 2021)
7. The SIDC Space Weather Briefing
8. Review of ionospheric activity (12 Apr 2021 - 18 Apr 2021)
Rise of the CMEs!
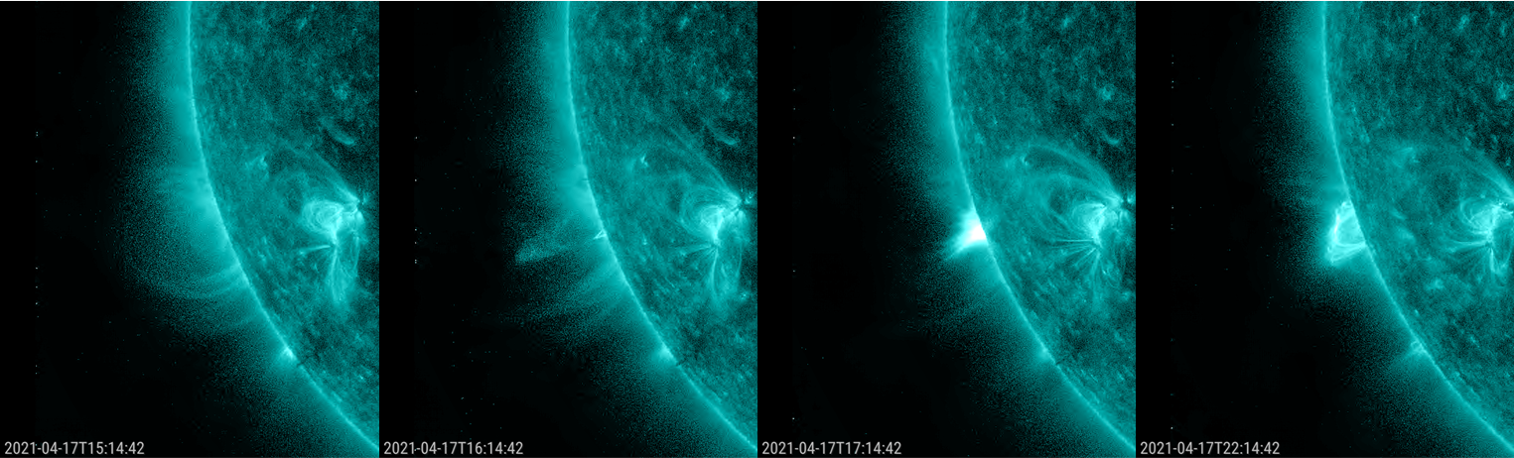
On 17 April, a long-duration B9.7 flare was observed starting at 16:21UT and peaking at 17:17UT. Based on STEREO-A observations (https://stereo-ssc.nascom.nasa.gov/beacon/ ), the source of this eruption was about 20 degrees behind the Sun's east limb as seen from Earth. This implies that the flare's maximum x-ray flux must have been significantly higher as we did not see any of the footpoints of the flare, only the post-flare loop tops and the area just above. In extreme ultraviolet (EUV), the event showed some typical features of a strong flare, as can be seen in the SDO/AIA 131 imagery (https://sdo.gsfc.nasa.gov/data/aiahmi/ ) underneath and the movies in the online version of this newsitem at https://www.stce.be/news/523/welcome.html : (1) opening of the overarching loop structure and violent ejection of the magnetic flux rope (16:14UT image); (2) supra-arcade downflows (SAD, also known as "tadpoles" - see this STCE Newsitem at https://www.stce.be/news/331/welcome.html for more info) above the rising coronal loops, as can be seen in the resp. image of 17:14UT and 22:14UT. EUV images made by the STEREO-A/EUVI 195 showed coronal dimming to the east of the active region, as well as a coronal wave directed mostly to the north and west. Both features are strong evidence that a coronal mass ejection (CME) was associated with this eruption.
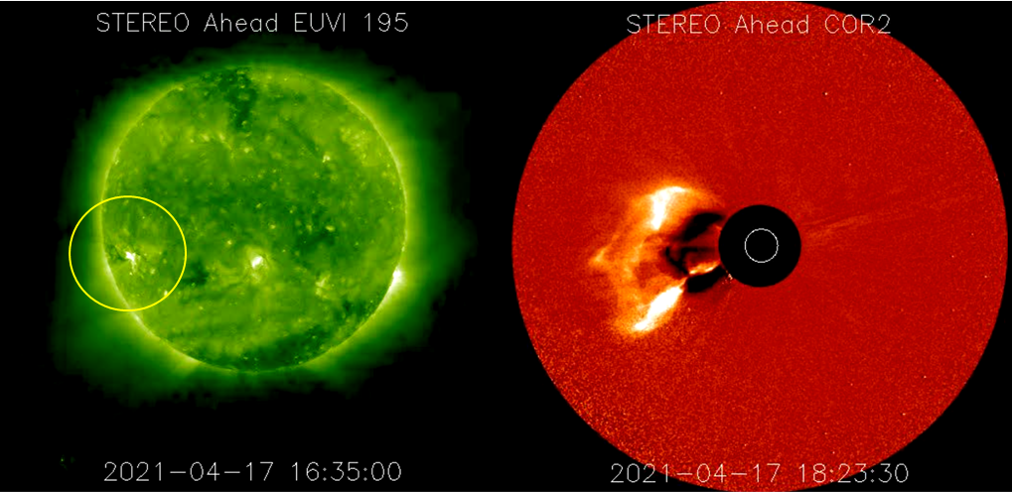
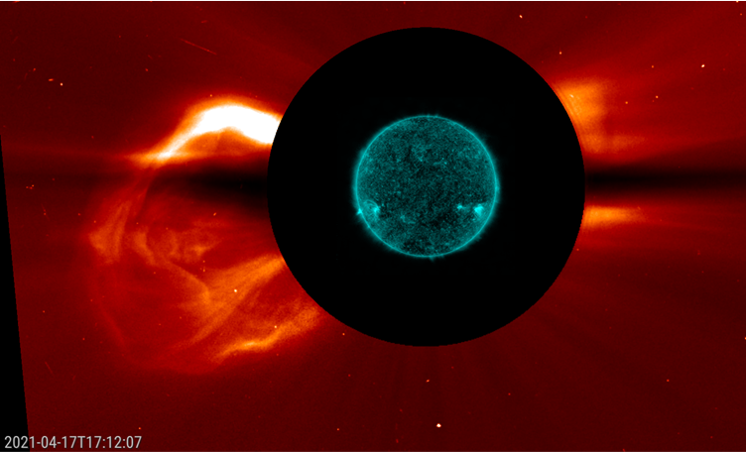
Sure enough, coronagraphs onboard both SOHO (below - https://sohowww.nascom.nasa.gov/ ) and STEREO-A (above right) indicated a CME with a true speed around 740 km/s towards the east, meaning that -as seen from Earth- the CME had no earth-directed component. As seen from STEREO-A, the bulk of the CME was not directed towards the spacecraft. Coronagraphic images do not exclude a glancing blow from the CME to the spacecraft, but so far (early 21 April), no CME signatures have been recorded in the in-situ solar wind data.
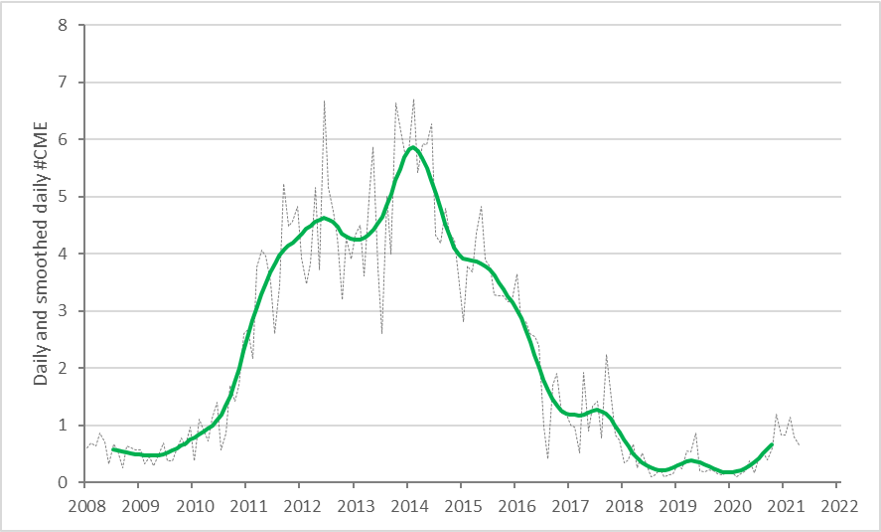
As observed by CACTus (http://www.sidc.oma.be/cactus/ ) in the SOHO coronagraph data (LASCO/C2), the number of CMEs has been gradually increasing over the last year. Graph underneath depicts the daily number of CMEs (averaged per month) and its smoothed value (Meeus) since the start of solar cycle 24. A maximum of nearly 6 CMEs per day was recorded early 2014. A minimum in the daily number of CMEs was observed in December 2019 (0.18), coinciding with the minimum sunspot number and the start of the new solar cycle 25 (see the press item at http://sidc.be/silso/node/167/#NewSolarActivity ). The current smooothed value is around 0.6 CMEs/day, still far away from the previous maximum but already 3 times more numerous than a good year ago. Excitement is building!
Review of solar activity
The solar activity was very low. Three active regions were seen on the solar disk: NOAA AR 2814 (Catania 87), AR 2815 and AR 2816. All of them exhibited a bipolar magnetic field and were classified as magnetic type Beta.
The flare level remained below the C-class. The highest flare registered was a B9.7 on April 17 peaking at 17:17 UT. The flare originated from a region behind the east limb (S21E88) and was associated with a back-sided CME and a type II radio emission.
No Earth-directed Coronal Mass Ejections (CMEs) were detected in the available chronograph imagery.
The greater than 10 MeV proton flux remained at background level.
The greater than 2 MeV electron flux crossed the 1000 pfu threshold on April 17th. A prolonged period with values above 10000 was registered on April 18th.
The electron fluence reached a moderate level on April 18th.
PROBA2 Observations (12 Apr 2021 - 18 Apr 2021)
Solar Activity
Solar flare activity was very low during the week.
In order to view the activity of this week in more detail, we suggest to go to the following website from which all the daily (normal and difference) movies can be accessed: https://proba2.oma.be/ssa
This page also lists the recorded flaring events.
A weekly overview movie can be found here (SWAP week 577). http://proba2.oma.be/swap/data/mpg/movies/weekly_movies/weekly_movie_2021_04_12.mp4
Details about some of this week's events can be found further below.
If any of the linked movies are unavailable they can be found in the P2SC movie repository here https://proba2.oma.be/swap/data/mpg/movies/
Saturday Apr 17
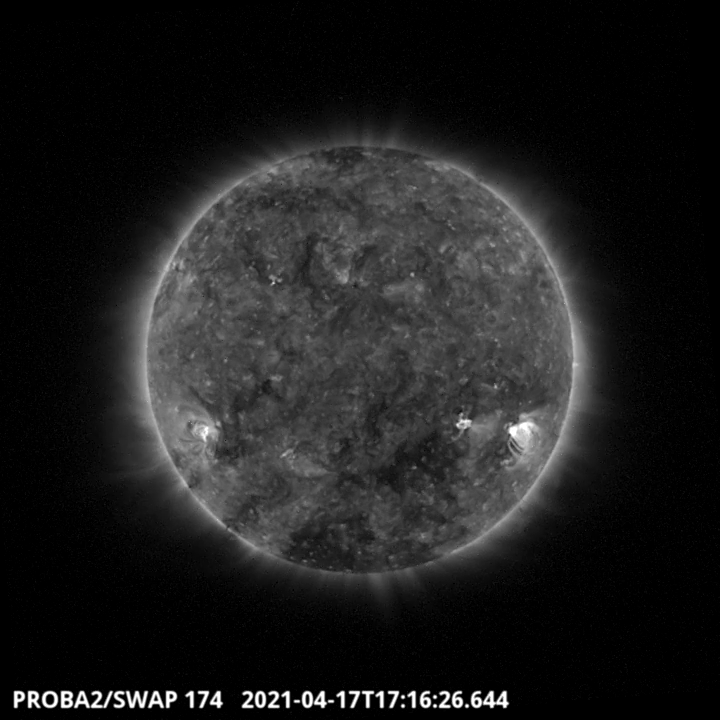
Flows on the South East part of the solar disk have been recorded as a B9.7 class flare. It is the highest flare of the week and it has been associated with a back-sided CME. Find a movie of the events here (SWAP movie) http://proba2.oma.be/swap/data/mpg/movies/20210417_swap_movie.mp4
The International Sunspot Number by Silso

The daily Estimated International Sunspot Number (EISN, red curve with shaded error) derived by a simplified method from real-time data from the worldwide SILSO network. It extends the official Sunspot Number from the full processing of the preceding month (green line). The graph shows a few days more than one solar rotation. The horizontal blue line shows the current monthly average. The yellow dots gives the number of stations that provided valid data. Valid data are used to calculate the EISN. The triangle gives the number of stations providing data. When a triangle and a yellow dot coincide, it means that all the data is used to calculate the EISN of that day.
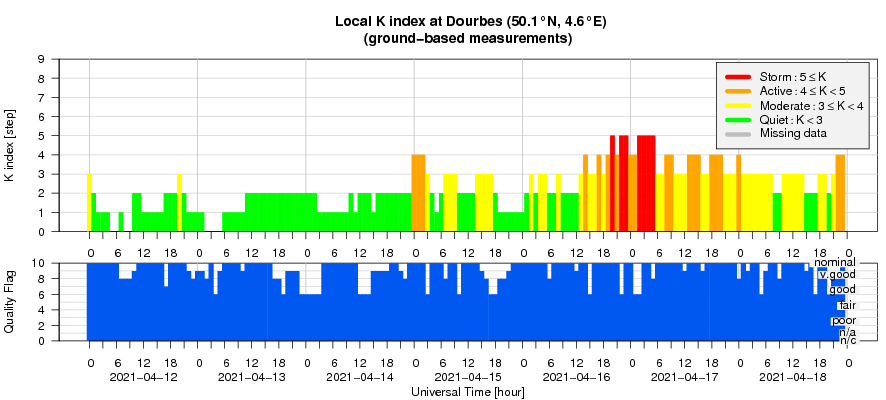
Review of geomagnetic activity
The solar wind parameters (based on DSCOVR and ACE data) reflected a slow solar wind regime until April 15th, when a drop of the temperature, increase in the magnetic field and density, and some increase in the solar wind speed suggested the arrival of an Interplanetary Coronal Mass Ejection (ICME) at Earth. The source for the ICME was identified as a coronal mass ejection setting off the west solar limb in the UTC morning of April 10th. On April 16th enhancements in the solar wind speed, temperature and magnetic field values were registered due to the mixed arrival of two high speed streams (HSSs) emanating from a small equatorial negative-polarity coronal hole and from a high-latitude extension of the souther polar coronal hole (with negative polarity as well). The solar wind speed reached even a velocity of up to 668 km/s.
The geomagnetic field was quiet until the ICME arrived causing a short-living minor geomagnetic storm late April 14, early April 15. Locally in Dourbes, only active conditions were detected. From the evening of April 16, a minor geomagnetic storm set in due to the arrival of the high speed stream associated with the coronal holes. From the second half of April 17, the storm weakened to active to unsettled conditions.
Geomagnetic Observations at Dourbes (12 Apr 2021 - 18 Apr 2021)
The SIDC Space Weather Briefing
The Space Weather Briefing presented by the forecaster on duty from April 11 to 18. It reflects in images and graphs what is written in the Solar and Geomagnetic Activity report.

A pdf-version: https://www.stce.be/briefings/20210419_SWbriefing.pdf
The movie: https://www.stce.be/briefings/20210419_SWbriefing.m4v
Review of ionospheric activity (12 Apr 2021 - 18 Apr 2021)
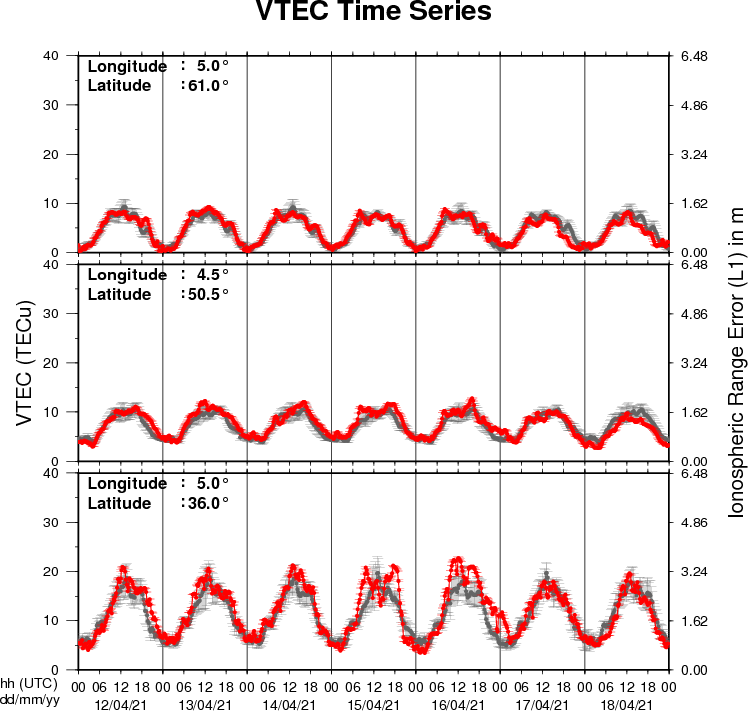
The figure shows the time evolution of the Vertical Total Electron Content (VTEC) (in red) during the last week at three locations:
a) in the northern part of Europe(N61°, 5°E)
b) above Brussels(N50.5°, 4.5°E)
c) in the southern part of Europe(N36°, 5°E)
This figure also shows (in grey) the normal ionospheric behaviour expected based on the median VTEC from the 15 previous days.
The VTEC is expressed in TECu (with TECu=10^16 electrons per square meter) and is directly related to the signal propagation delay due to the ionosphere (in figure: delay on GPS L1 frequency).
The Sun's radiation ionizes the Earth's upper atmosphere, the ionosphere, located from about 60km to 1000km above the Earth's surface.The ionization process in the ionosphere produces ions and free electrons. These electrons perturb the propagation of the GNSS (Global Navigation Satellite System) signals by inducing a so-called ionospheric delay.
See http://stce.be/newsletter/GNSS_final.pdf for some more explanations ; for detailed information, see http://gnss.be/ionosphere_tutorial.php