
The two strongest events that occurred during last week were two M-class flares. They were both born from active region (AR) NOAA 2473, which was also responsible for most of the M-class flaring the week before. This region was declining in sunspot area, but remained magnetically complex throughout its entire transit over the solar disk. So how do these two medium flares compare to each other?
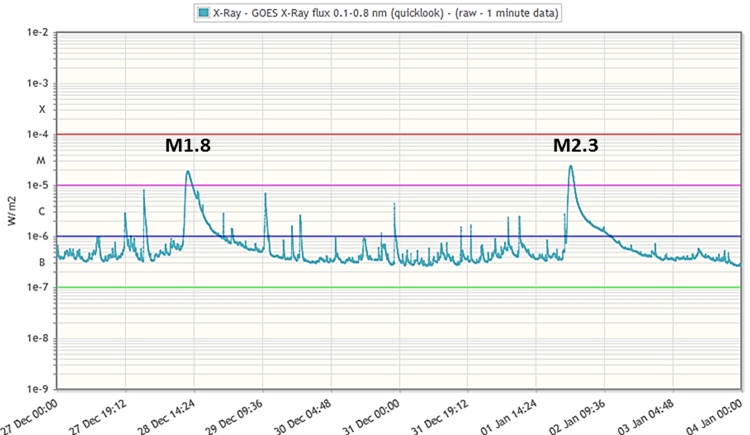
Aside having the same sunspot group as their "mother", the two events shared some other similarities. They were both of about equal strength, the M1.8 flare peaking on 28 December at 12:45UT and the M2.3 flare peaking on 02 January at 00:11UT. The difference in timing (noon vs. midnight) implies that any direct effect on communication or radar took place over nearly opposite parts of the Earth. Both flares were also long duration events, lasting respectively 169 and 111 minutes. Note that the end time is the time when the x-ray flux level decays to a point halfway between the maximum flux and the pre-flare background level. Hence, when there are no other actively flaring regions, one can follow the decline of the x-ray flux over a much longer timeframe than the timing of the flare's ending would suggest (see chart above). Another similarity was that the flares took place in about the same location of the AR, i.e. in the mid to trailing section. Both were also parallel ribbon flares, as can be seen in the extreme ultraviolet (EUV) images underneath taken by SDO (AIA 1600 filter).
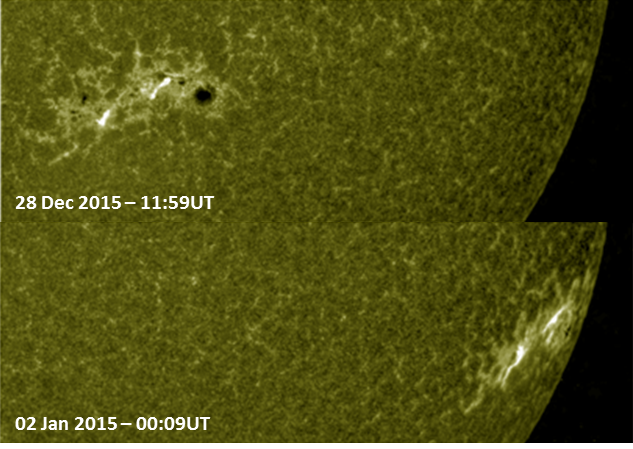
The main differences between the flares arose mainly from the different location on the solar disk when the flares were produced, as can be readily seen in the SDO/AIA131 images taken at the timing of the maximum x-ray flux. The M1 flare took place near disk centre slightly west of the central meridian (S19W09, i.e. 19 degrees south of the solar equator, 9 degrees west of the central meridian), whereas the M2 flare occurred much closer to the west limb (S21W69).

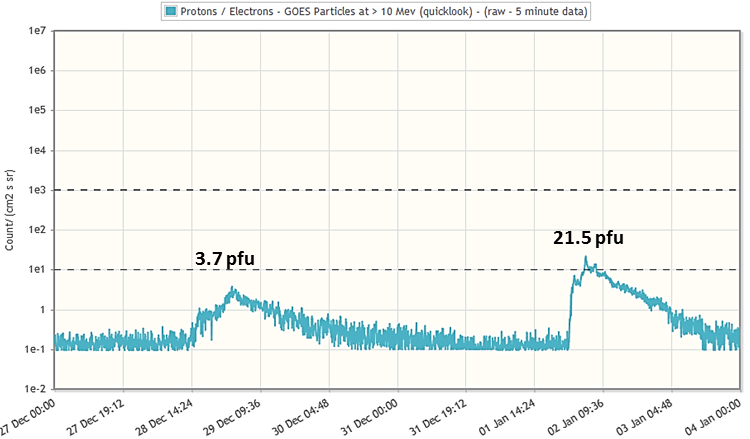
The different location influenced the observed increase in proton flux significantly. Because of its much more western position, the M2 flare was magnetically a lot better connected to Earth than the M1 flare. As a result (see graph underneath), the proton flux of the latter increased only very slowly, and reached its maximum only 9 hours after the x-ray peak, remaining well below the proton event threshold. Following the M2 flare, the proton flux increased very quickly and reached its maximum of 21 pfu (proton flux unit - more info) already on 02 January at 04:50UT. A genuine, albeit minor, proton event!
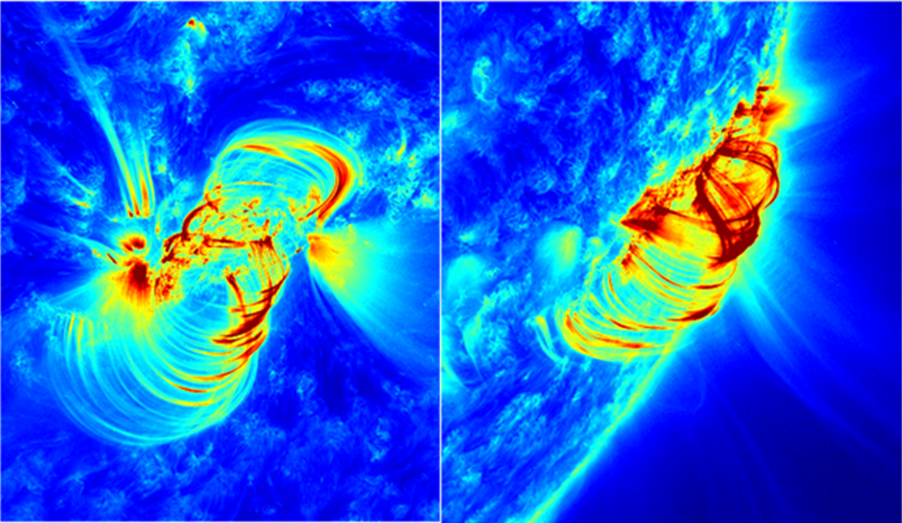
Both flares were accompanied by impressive and complex series of post-flare coronal loops (a so-called "arcade"). Figure underneath provides a snapshot of the loops respectively 5 and 2 hours after the maximum x-ray flux was reached. The images and clips are false colored SDO/AIA 171, to bring out the subtle details of these delicate arches.


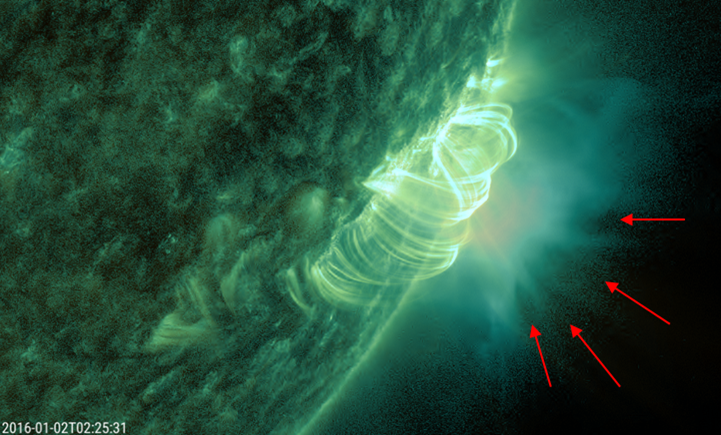
The aftermath of the flares was also characterized by different features. For example, during the declining phase of the M1 flare there were a number of impressive jets visible emanating from the main leading sunspot (more on jets). This can be seen in the MOVIE in the false colored SDO/AIA 171 clip. On the other hand, the position of the M2 flare offered a good view on the supra-arcade downflows. These are the dark streaks ("tadpoles") that can be seen moving sunward to the top of the developing post-flare loops. The movie contains a clip combining SDO/AIA 171 (yellow; moderate temperatures; loops) with SDO/AIA 131 (bluish; high temperatures; downflows) imagery. See also the annotated image underneath. The origin of these downflows is not well understood yet. One of the theories supports the idea that these are plasma voids following in the wake of shrinking magnetic flux tubes.
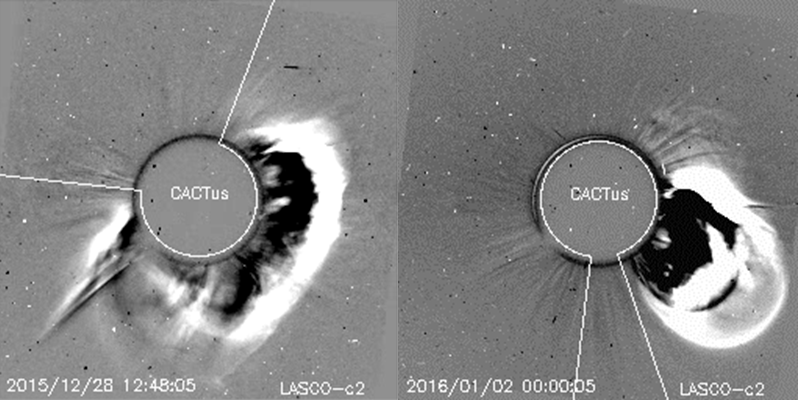
Finally, the difference in location of the flares obviously had its effect on the direction of the associated coronal mass ejection (CME). As can be seen in these coronagraphic images (see CACTus), the CME associated with the M1 flare was a partial halo CME, indicating that it had an Earth directed component. The CME associated with the M2 flare was much more solid and faster, but also not as wide and its bulk clearly directed away from the Sun-Earth line. In the end, the first CME caused a moderate geomagnetic storm a few days later, whereas the second CME apparently missed Earth and certainly did not leave an obvious signature in the solar wind parameters.
 |
 |
