- Table of Content
- 1.Rise of the so...
- 2.Review of sola...
- 3.Noticeable Sol...
- 4.PROBA2 Observa...
- 5.The Internatio...
- 6.Review of geom...
- 7.Geomagnetic Ob...
- 8.The SIDC Space...
- 9.Review of iono...
- 10.Activity calen...
2. Review of solar activity
3. Noticeable Solar Events (23 Aug 2021 - 29 Aug 2021)
4. PROBA2 Observations (23 Aug 2021 - 29 Aug 2021)
5. The International Sunspot Number by Silso
6. Review of geomagnetic activity
7. Geomagnetic Observations at Dourbes (23 Aug 2021 - 29 Aug 2021)
8. The SIDC Space Weather Briefing
9. Review of ionospheric activity (23 Aug 2021 - 29 Aug 2021)
10. Activity calendar
Rise of the solar flares
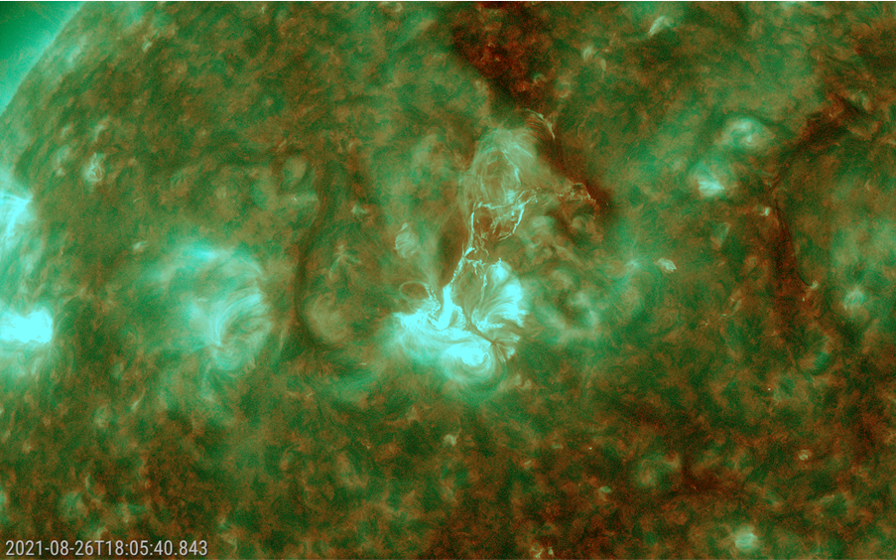
Solar flaring activity was at an elevated level last week. NOAA 2860 produced most of the 19 C-class flares for these 7 days, as well as the sole M-class event, whereas tiny sunspot group NOAA 2859 was the source of the most photogenic eruption. The latter took place on 26 August, with the C3.0 flare peaking at 18:18UT. The source of the eruption seems to have been an instability in the group filament located in the trailing (spotless) portion of the region. Coronal dimming was observed to the north of the region, as well as a coronal wave and post-eruption coronal loops. No wonder then that a partial halo coronal mass ejection (CME) was observed. Though it was thought it might have an earth-directed component, no obvious signature has been recorded in the solar wind data so far. The image underneath captures the eruption in progress at 18:05UT. It consists of SDO/AIA 193 imagery (green and blue component ; https://sdo.gsfc.nasa.gov/data/aiahmi/) overlaid on AIA 304 images (red component) thus combining views at high and low temperatures at resp. about 1.25 million and 80.000 degrees.
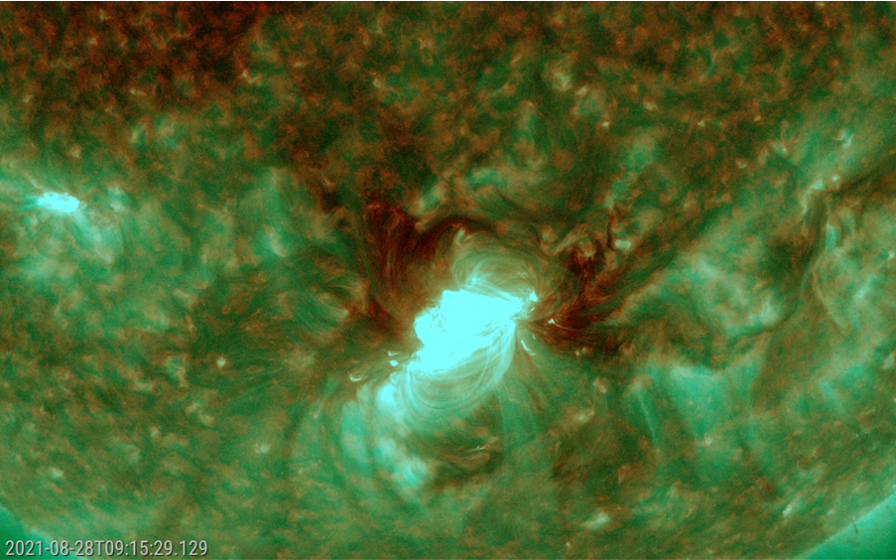
NOAA 2860 was the source of the strongest flare of the week, an M4.7 flare peaking on 28 August at 06:11UT. Also during this flaring event, coronal dimming was observed to the north of the region, as well as a coronal wave and post-eruption coronal loops. The associated partial halo CME was thought to have an earth-directed component, with the CME expected to arrive at Earth on 2 September. Imagery underneath was compiled from the same filters as described above. It shows the eruption at 09:15UT, about 3 hours after the peak in soft x-rays. The coronal dimming and post-flare loops are quite prominently visible. A movie of both events can be found in the online version of this article at https://www.stce.be/news/548/welcome.html
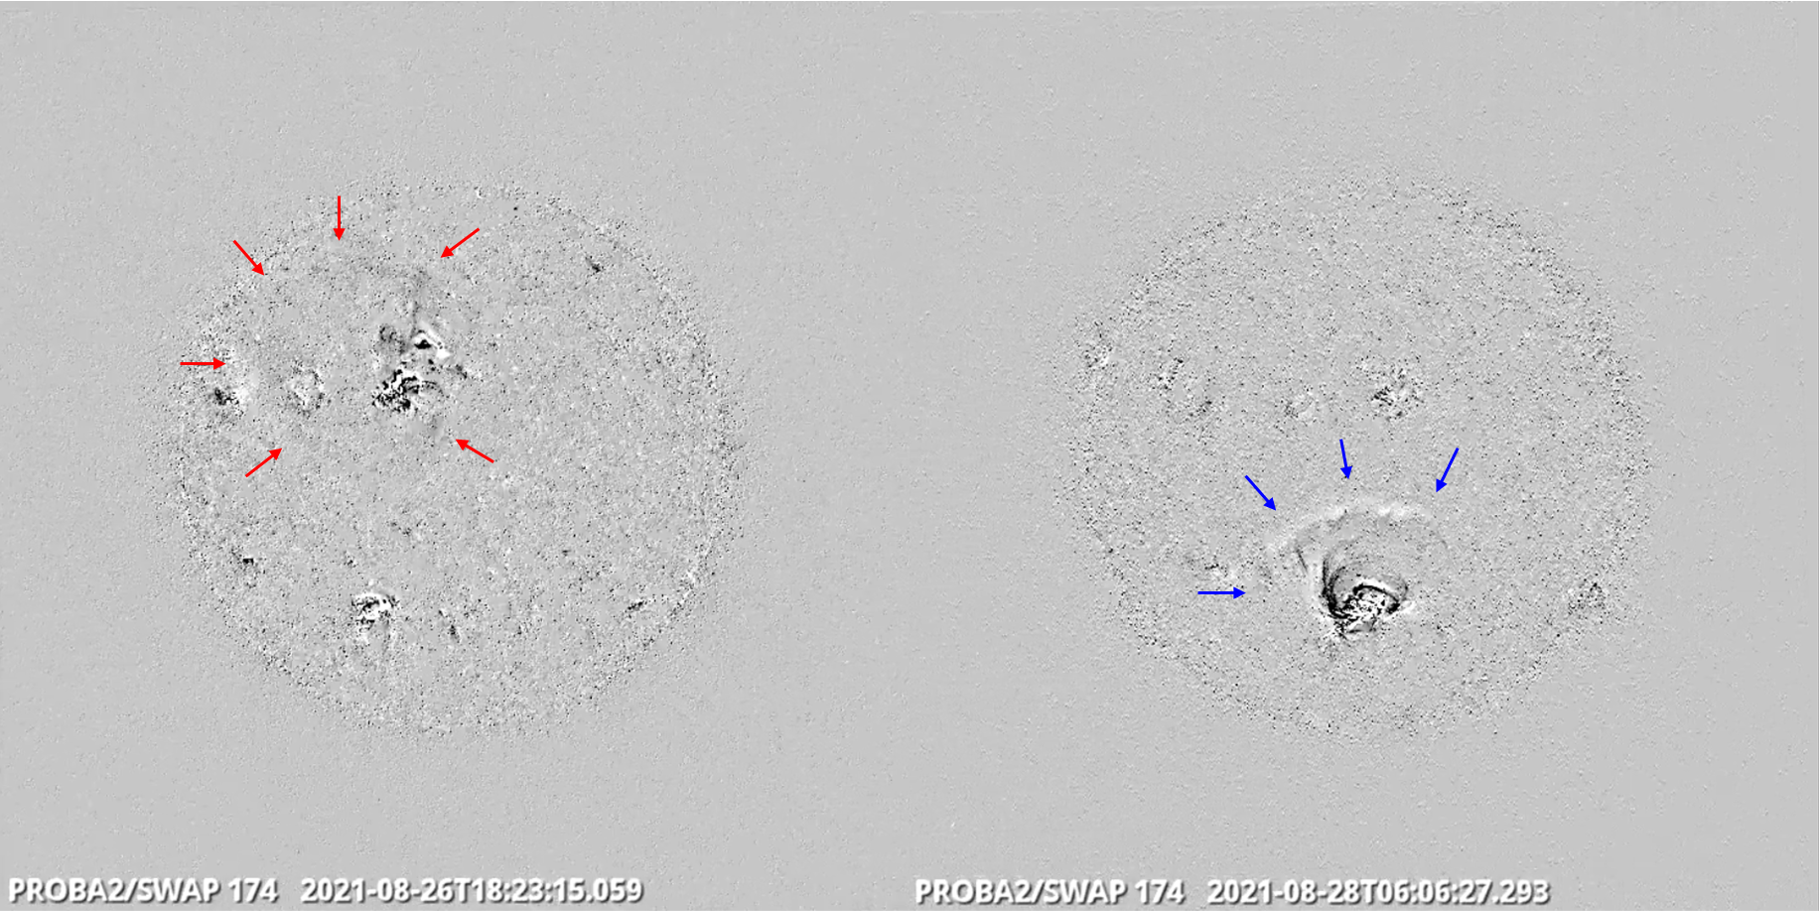
Coronal waves (or EIT waves) are bright wave fronts that can be seen propagating through the corona (Sun's hot atmosphere) and are associated with CMEs. This STCE newsitem at http://www.stce.be/news/241/welcome.html provides more info on these waves. These features are not so easily identified in the above movie clips, let alone in still images. That's why very often difference images are used (one image subtracted from the other) to increase the visibility. The two annotated PROBA2/SWAP images (https://proba2.sidc.be/ ) below show the (faint) outline of the coronal wave associated with the C3 flare on the left, and the more prominent coronal wave associated with the M4 flare on the right.
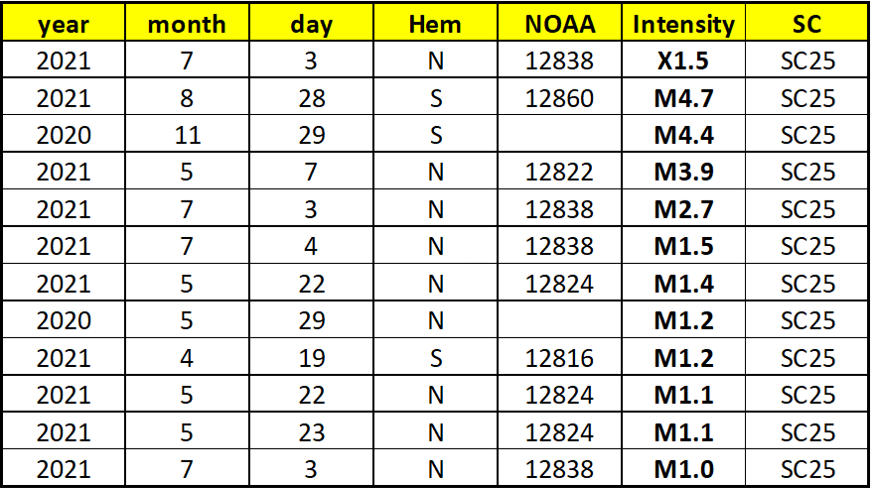
The M4.7 flare is the 11th M-class flare of the ongoing solar cycle (SC25). The strongest solar flare so far in SC25 was the X1.5 event on 3 July this year. The table underneath (Hem: solar hemisphere ; NOAA: group number) presents all M- and X-class flares from SC25. The data are presented as they are available at the relevant NOAA/SWPC websites. As SC25 further unfolds, stronger solar flares will be produced and so the table will gradually be populated by X-class flares, the strongest of which may happen even far into the solar cycle (September 2017 for SC24!).
Review of solar activity
Five active regions got numbered: NOAA AR 2858, 2859, 2860, 2861 and 2862. One M-class, twenty-one C-class and numerous B-class flares were reported by GOES.
The largest reported flare was an M4.7 flare observed on August 28 (peaked at 06:11 UT) which originated from NOAA AR 2860. The flare was associated with a coronal dimming and EIT wave, the on-disc signatures of the CME. A weak partial halo CME was indeed seen. The CME came into the field of view (FOV) of SOHO/LASCO C2 field of view at 07:48 UT on August 28. The CME had a projected plane-of-the-sky speed of about 350 km/s and angular width of about 180 degrees.
Three large filaments erupted.
A large filament (situated close to the extension of the northern polar coronal hole) erupted in the early morning of August 23. The eruption was associated with a faint and slow partial halo CME (angular width of about 180 degrees and velocity of 450 km/s). The CME came into the SOHO/LASCO C2 FOV at 06:00 UT on August 23.
A second filament, stretching from about 30 degrees North to 30 degrees South, erupted on August 24. The associated CME came into the SOHO/LASCO C2 FOV at 06:36 UT on August 24. The CME had a velocity of about 450 km/s and an angular width of about 100 degrees.
A third filament (northern hemisphere, near the central meridian) erupted around 15:00 UT on August 28. An associated CME was not detected.
Two small, positive polarity coronal holes were observed: one near the equator, another at 30 degrees in the Southern solar hemisphere. Both coronal holes crossed the central meridian in the early morning of August 24.
The greater than 10 MeV proton flux was at background levels during the whole week.
The greater than 2 MeV electron flux crossed the 1000 pfu threshold at about 02:00 UT on August 28 and it remained predominantly above the threshold until the end of the week.
During the first few days of the week the 24h electron fluence was at normal level. The value changed to moderate level in the morning of August 28 and stayed like this until the end of the week.
Noticeable Solar Events (23 Aug 2021 - 29 Aug 2021)
| DAY | BEGIN | MAX | END | LOC | XRAY | OP | 10CM | TYPE | Cat | NOAA |
| 28 | 0539 | 0611 | 0623 | S28W1 | M4.7 | 1N | 60 | IV/1II/1 | 32 | 2860 |
| LOC: approximate heliographic location | TYPE: radio burst type |
| XRAY: X-ray flare class | Cat: Catania sunspot group number |
| OP: optical flare class | NOAA: NOAA active region number |
| 10CM: peak 10 cm radio flux |
PROBA2 Observations (23 Aug 2021 - 29 Aug 2021)
Solar Activity
Solar flare activity fluctuated from very low to moderate during the week.
In order to view the activity of this week in more detail, we suggest to go to the following website from which all the daily (normal and difference) movies can be accessed: https://proba2.oma.be/ssa
This page also lists the recorded flaring events.
A weekly overview movie can be found at http://proba2.sidc.be/swap/data/mpg/movies/weekly_movies/weekly_movie_2021_08_23.mp4 (SWAP week 596).
Details about some of this week’s events can be found further below.
If any of the linked movies are unavailable they can be found in the P2SC movie repository: https://proba2.oma.be/swap/data/mpg/movies/
From August 24 on, two active regions awakened and produced several C flares, with even an M flare on August 28, most often associated with CMEs and EUV waves. A selection of the most noticeable of these events is presented below.

Flares occurring during the August 26 to 29 period - LYRA and GOES timeseries
Thursday Aug 26

An eruption associated with a C3.0 flare close to the central meridian that peaked at 18:18 UT on 2021-Aug-26 can be seen in the above SWAP difference image.
Find a movie of the event at https://proba2.sidc.be/swap/movies/20210826_swap_diff.mp4 (SWAP difference movie)
Saturday Aug 28


SWAP difference image (top) and direct observation (bottom) illustrating the eruption associated with the strongest flare of the period (M4.7, peaking at 06:11 UT on 2021-Aug-28). An EUV wave was also visible.
Find the movies for that day at https://proba2.sidc.be/swap/movies/20210828_swap_diff.mp4 (SWAP difference movie) and https://proba2.sidc.be/swap/movies/20210828_swap_movie.mp4 (SWAP movie)
Sunday Aug 29

A coronal mass ejection was observed at the South West Limb around 20:05 UT on 2021-Aug-29, as illustrated in the above SWAP difference image. It was associated with a B8.6 flare.
Find a movie of the day at https://proba2.sidc.be/swap/movies/20210829_swap_diff.mp4 (SWAP difference movie)
The International Sunspot Number by Silso
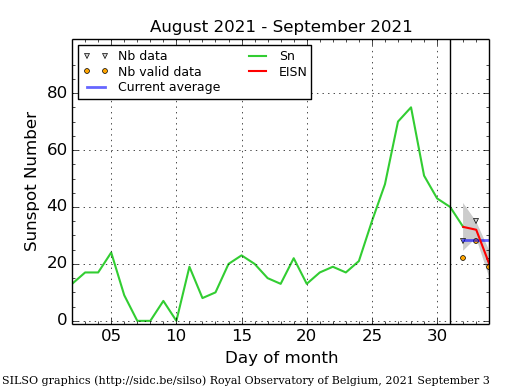
The daily Estimated International Sunspot Number (EISN, red curve with shaded error) derived by a simplified method from real-time data from the worldwide SILSO network. It extends the official Sunspot Number from the full processing of the preceding month (green line), a few days more than one solar rotation. The horizontal blue line shows the current monthly average. The yellow dots gives the number of stations that provided valid data. Valid data are used to calculate the EISN. The triangle gives the number of stations providing data. When a triangle and a yellow dot coincide, it means that all the data is used to calculate the EISN of that day.
Review of geomagnetic activity
Earth was under the influence of a slow solar wind with its speed between 300 to 450 km/s.
Early on August 27, a shock wave, a few hours later followed by an ICME passed the L1 point. The magnetic structure was associated with the filament eruption and partial halo CME of August 23. For little more than 1 day, the Bz component of the interplanetary magnetic field was negative (down to - 15 nT).
Until August 27, noon, the geomagnetic conditions were mostly quiet to unsettled. The ICME however, induced long intervals of active geomagnetic conditions (local station at Dourbes and NOAA reported K=4 and Kp=4, respectively). Additionally, NOAA reported one interval of Kp=5 on August 28.
Geomagnetic Observations at Dourbes (23 Aug 2021 - 29 Aug 2021)

The SIDC Space Weather Briefing
The Space Weather Briefing presented by the forecaster on duty from Aug 22 to 29. It reflects in images and graphs what is written in the Solar and Geomagnetic Activity report.

A pdf-version: https://www.stce.be/briefings/20210830_SWbriefing.pdf
The movie: https://www.stce.be/briefings/20210830_SWbriefing.m4v
Review of ionospheric activity (23 Aug 2021 - 29 Aug 2021)

The figure shows the time evolution of the Vertical Total Electron Content (VTEC) (in red) during the last week at three locations:
a) in the northern part of Europe(N61°, 5°E)
b) above Brussels(N50.5°, 4.5°E)
c) in the southern part of Europe(N36°, 5°E)
This figure also shows (in grey) the normal ionospheric behaviour expected based on the median VTEC from the 15 previous days.
The VTEC is expressed in TECu (with TECu=10^16 electrons per square meter) and is directly related to the signal propagation delay due to the ionosphere (in figure: delay on GPS L1 frequency).
The Sun's radiation ionizes the Earth's upper atmosphere, the ionosphere, located from about 60km to 1000km above the Earth's surface.The ionization process in the ionosphere produces ions and free electrons. These electrons perturb the propagation of the GNSS (Global Navigation Satellite System) signals by inducing a so-called ionospheric delay.
See http://stce.be/newsletter/GNSS_final.pdf for some more explanations ; for detailed information, see http://gnss.be/ionosphere_tutorial.php
Activity calendar
Check out our activity calendar: activities and encounters with space weather as main theme. We provide occasions to get submerged in the world of space weather through educational, informative and instructive activities.
Sept 15 - seminar: Statistical post-processing of the ECMWF ensemble forecasts of the RMIB, by Dr. Jonathan Demaeyer, RMI
Sept 24 and 25 - Wise Night, science festival
Oct 7 - seminar: A filter concept for reducing random variation in time series: Procedures, limits, applications, by Dr. Simo Spassov, RMI@Dourbes
Oct 11, 12,14,15 - SWx Introductory Course, by STCE - complete
Oct 21 - seminar: Understanding rainfall variability using climate models over the Ethiopian Highlands, by Dr. Bert Van Schaeybroeck, RMI
Oct 28 - seminar: Simulating tree growth response to climate change in structurally-complex oak and beech stands across Europe, by Dr. Louis DE WERGIFOSSE, UCLouvain
Nov 22,23,25,26 - SWx Introductory Course, by STCE - 3 seats available

Check: https://www.stce.be/calendar