Solar flaring activity was at an elevated level last week. NOAA 2860 produced most of the 19 C-class flares for these 7 days, as well as the sole M-class event, whereas tiny sunspot group NOAA 2859 was the source of the most photogenic eruption. The latter took place on 26 August, with the C3.0 flare peaking at 18:18UT. The source of the eruption seems to have been an instability in the group filament located in the trailing (spotless) portion of the region. Coronal dimming was observed to the north of the region, as well as a coronal wave and post-eruption coronal loops. No wonder then that a partial halo coronal mass ejection (CME) was observed. Though it was thought it might have an earth-directed component, no obvious signature has been recorded in the solar wind data so far. The image underneath captures the eruption in progress at 18:05UT. It consists of SDO/AIA 193 imagery (green and blue component) overlaid on AIA 304 images (red component) thus combining views at high and low temperatures at resp. about 1.25 million and 80.000 degrees.

NOAA 2860 was the source of the strongest flare of the week, an M4.7 flare peaking on 28 August at 06:11UT. Also during this flaring event, coronal dimming was observed to the north of the region, as well as a coronal wave and post-eruption coronal loops. The associated partial halo CME was thought to have an earth-directed component, with the CME expected to arrive at Earth on 2 September. Imagery underneath was compiled from the same filters as described above. It shows the eruption at 09:15UT, about 3 hours after the peak in soft x-rays. The coronal dimming and post-flare loops are quite prominently visible.

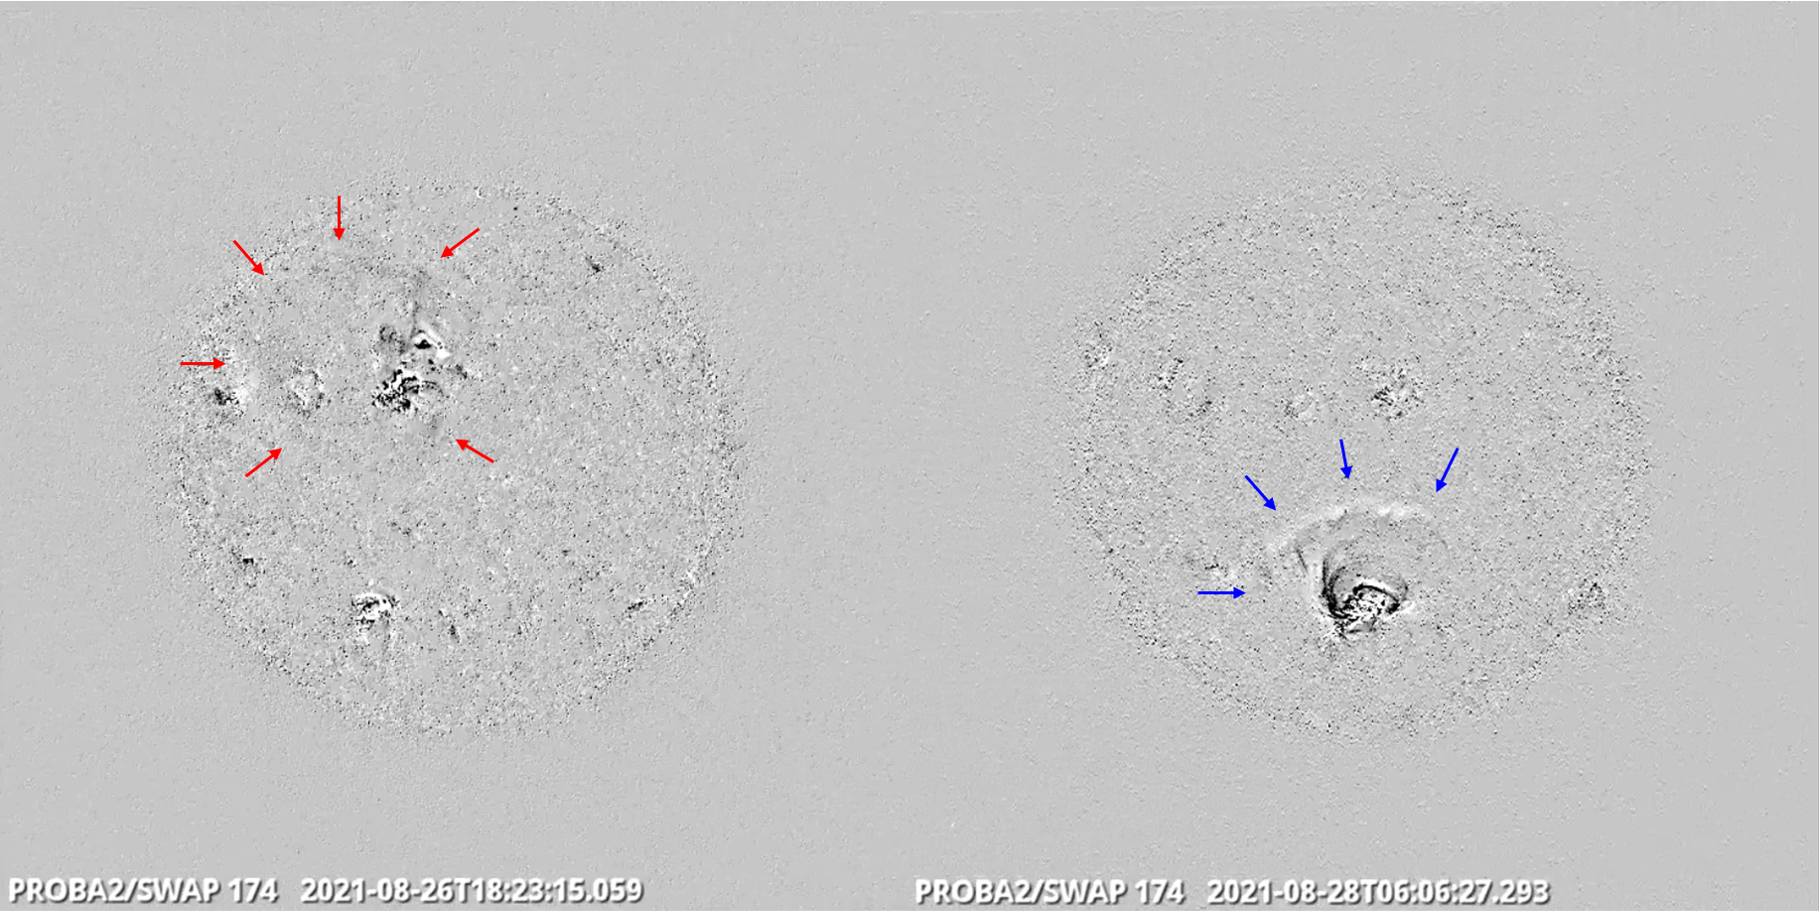
Coronal waves (or EIT waves) are bright wave fronts that can be seen propagating through the corona (Sun's hot atmosphere) and are associated with CMEs. This STCE newsitem provides more info on these waves. These features are not so easily identified in the above movie clips, let alone in still images. That's why very often difference images are used (one image subtracted from the other) to increase the visibility. The two annotated PROBA2/SWAP images below show the (faint) outline of the coronal wave associated with the C3 flare on the left, and the more prominent coronal wave associated with the M4 flare on the right.
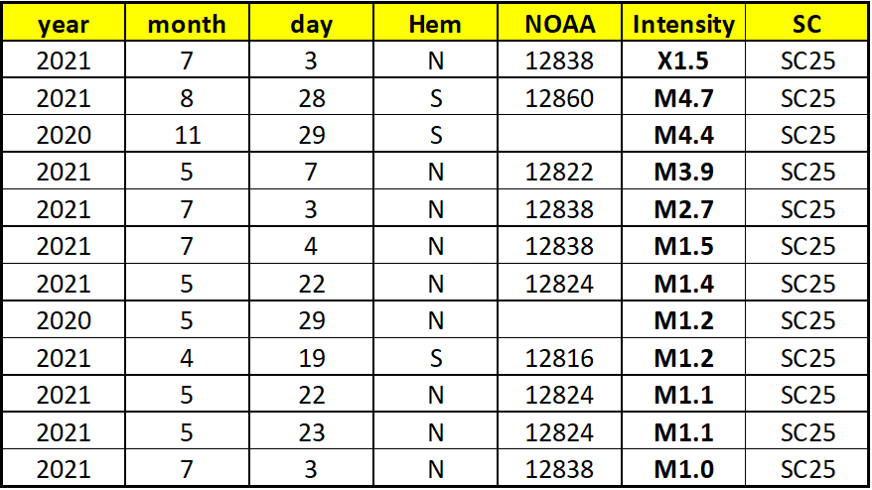
The M4.7 flare is the 11th M-class flare of the ongoing solar cycle (SC25). The strongest solar flare so far in SC25 was the X1.5 event on 3 July this year. The table underneath (Hem: solar hemisphere ; NOAA: group number) presents all M- and X-class flares from SC25. The data are presented as they are available at the relevant NOAA/SWPC websites. As SC25 further unfolds, stronger solar flares will be produced and so the table will gradually be populated by X-class flares, the strongest of which may happen even far into the solar cycle (September 2017 for SC24!).