- Table of Content
- 1.Elegy for a su...
- 2.Review of sola...
- 3.PROBA2 Observa...
- 4.The Internatio...
- 5.Noticeable Sol...
- 6.Review of geom...
- 7.Geomagnetic Ob...
- 8.The SIDC Space...
- 9.Review of iono...
2. Review of solar activity
3. PROBA2 Observations (20 Sep 2021 - 26 Sep 2021)
4. The International Sunspot Number by Silso
5. Noticeable Solar Events (20 Sep 2021 - 26 Sep 2021)
6. Review of geomagnetic activity
7. Geomagnetic Observations at Dourbes (20 Sep 2021 - 26 Sep 2021)
8. The SIDC Space Weather Briefing
9. Review of ionospheric activity (20 Sep 2021 - 26 Sep 2021)
Elegy for a sunspot group
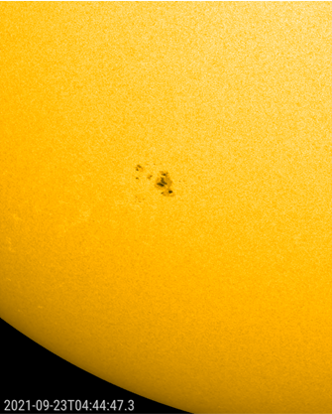
NOAA 2871 rounded the Sun's southeast limb late on 17 September. It was the complex remnant of NOAA 2860's main sunspot portion (see this STCE Newsitem at https://www.stce.be/news/548/welcome.html ) that transited the solar disk from 24 August till 3 September. The SDO/HMI (https://sdo.gsfc.nasa.gov/data/aiahmi/ ) images underneath show NOAA 2871 on its gradually decaying trend, with some magnetic flux emerging (more sunspots) on 24 and 25 September, before fully disintegrating during the subsequent days. Clips are available in the online version of this article at https://www.stce.be/news/552/welcome.html
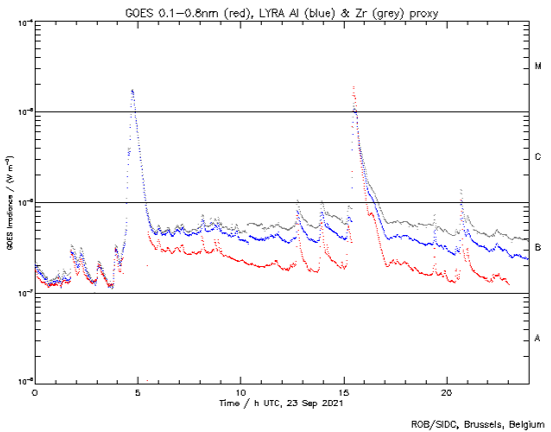
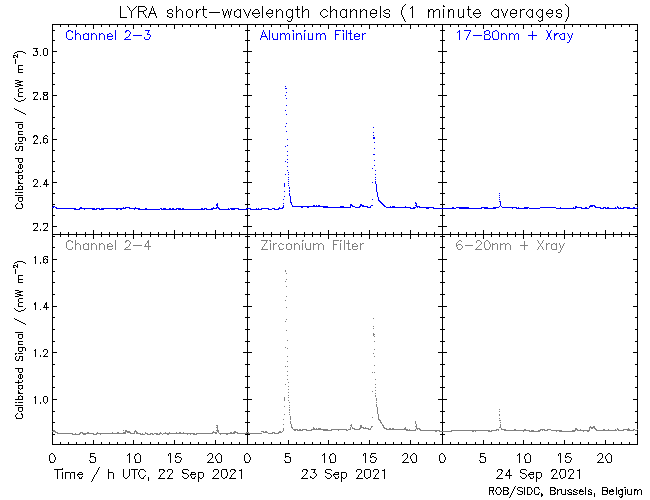
However, NOAA 2871 had no intention to go down quietly, producing at least one C-class flare on almost every day during its transit. Moreover, it produced 2 M-class flares on 23 September: An M2.8 peaking at 04:42UT, and an M1.8 reaching maximum intensity (in soft x-rays) at 15:28UT. The imagery underneath shows the evolution of the x-ray flux as measured by GOES-16, as well as in ultraviolet (UV) as measured by the LYRA instrument (https://proba2.sidc.be/about/LYRA ) on board the PROBA2 spacecraft. These UV data are calibrated to match the x-ray flux as well as possible. Note the first M-class event was missed by GOES-16 as the Sun was fully eclipsed by the Earth from 04:19UT till 05:26UT (i.e. eclipse-season: see NOAA's dedicated GOES eclipse page at https://www.ospo.noaa.gov/Operations/GOES/eclipse.html ). Fortunately, GOES-17 and PROBA2 had a clear view on the Sun and were able to record the intensity of the eruption.
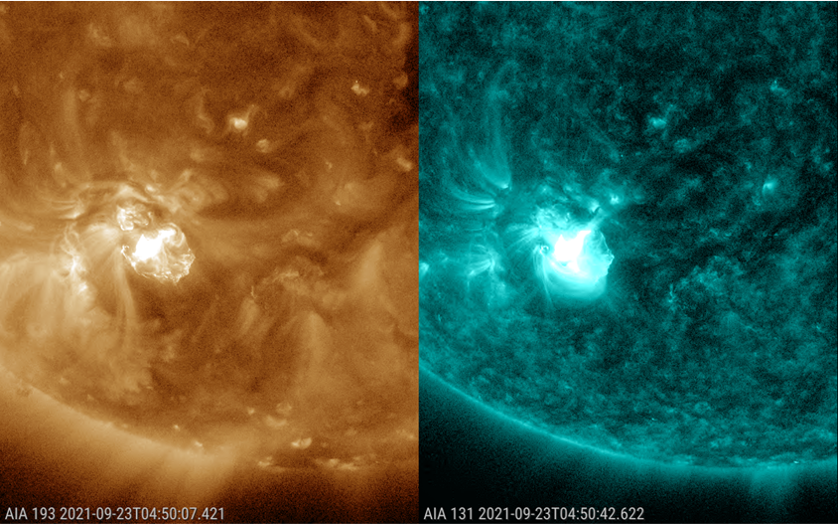
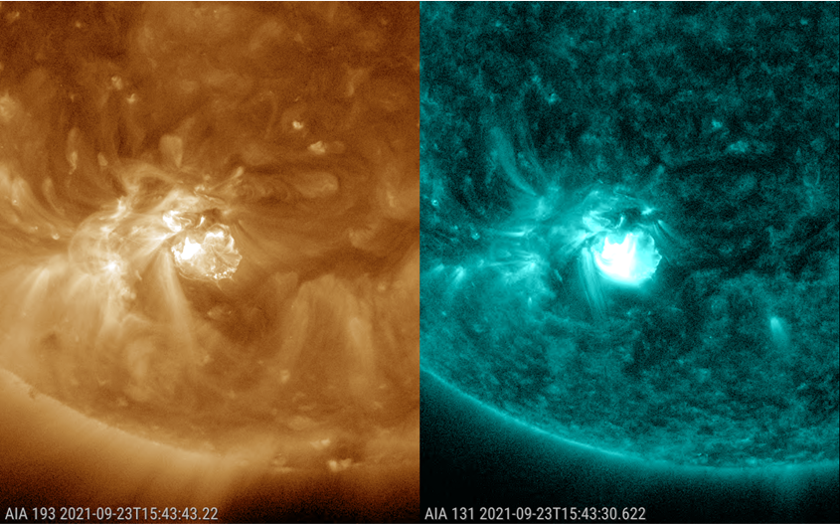
The two M-class events can be seen underneath in the SDO/AIA imagery. The screenshots were taken shortly after the time of maximum intensity of each flare. The image on the left is taken with the AIA 193 filter, offering a better view on subtle changes such as coronal dimming and coronal waves, whereas the AIA 131 provides a better view on the flare itself. The associated coronal mass ejections were mostly directed southward, but were thought to possibly have an earth-directed component.
Review of solar activity
Five active regions on the side of the Sun facing Earth got a NOAA number: AR 2871, 2872, 2873, 2875 and 2876. Two M-class, 6 C-class flare and numerous B-class flares were reported by GOES. The largest was an M2.9 flare which peaked on Sep 23 04:30 UT and originated from NOAA AR 2871.
Four potentially Earth directed Coronal Mass Ejections (CMEs) have been observed in coronagraph data, on sep 19 12:58UT, Sep 22 05:38UT, Sep 23 05:48UT and Sep 23 16:12UT.
The greater than 10 MeV proton flux was at background levels, the greater than 2MeV electron flux was bellow the 1000 pfu threshold, with exception Sep 23, and the 24h electron fluence was at normal levels.
PROBA2 Observations (20 Sep 2021 - 26 Sep 2021)
Solar Activity
Solar flare activity fluctuated from very low to moderate during the week.
In order to view the activity of this week in more detail, we suggest to go to the following website from which all the daily (normal and difference) movies can be accessed: https://proba2.oma.be/ssa
This page also lists the recorded flaring events.
A weekly overview movie can be found here (SWAP week 600): https://proba2.sidc.be/swap/data/mpg/movies/weekly_movies/weekly_movie_2021_09_20.mp4
Details about some of this week's events can be found further below.
If any of the linked movies are unavailable they can be found in the P2SC movie repository here: https://proba2.oma.be/swap/data/mpg/movies/
Thursday Sep 23
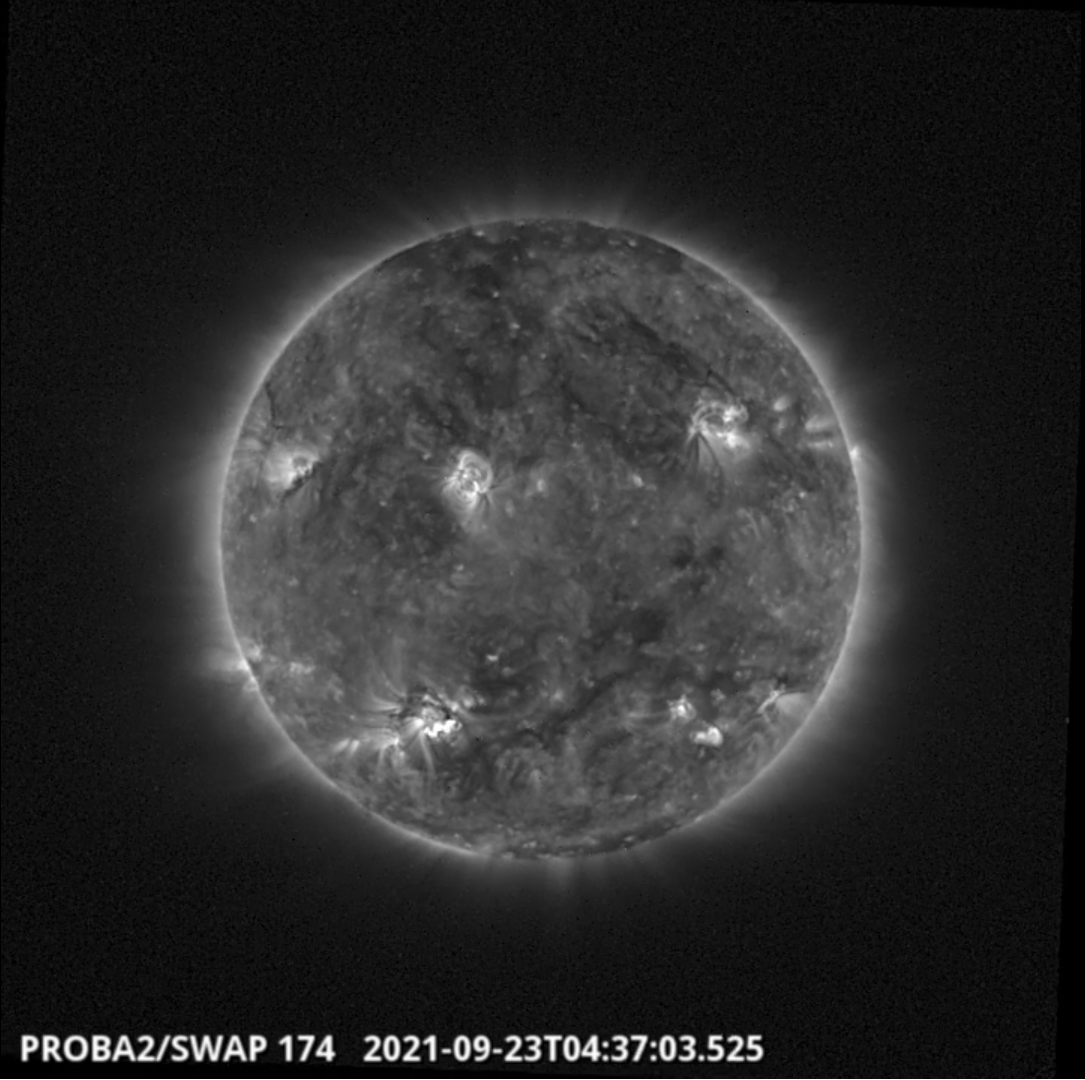
The largest flare of the week, an M2.8 flare, was observed by SWAP and LYRA. The flare is visible in the south-east of the solar disk on 2021-Sep-23, as shown in the SWAP image above taken at 04:37 UT.
Find a movie of the event here (SWAP movie): https://proba2.sidc.be/swap/movies/20210923_swap_movie.mp4
The International Sunspot Number by Silso
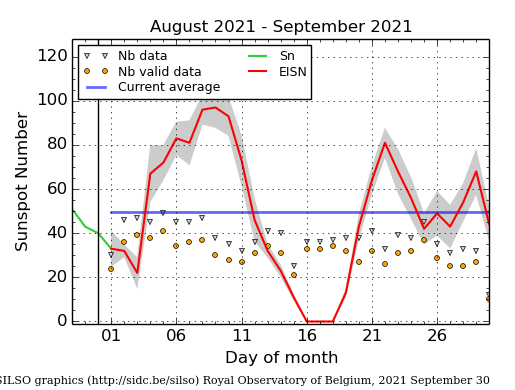
The daily Estimated International Sunspot Number (EISN, red curve with shaded error) derived by a simplified method from real-time data from the worldwide SILSO network. It extends the official Sunspot Number from the full processing of the preceding month (green line), a few days more than one solar rotation. The horizontal blue line shows the current monthly average. The yellow dots gives the number of stations that provided valid data. Valid data are used to calculate the EISN. The triangle gives the number of stations providing data. When a triangle and a yellow dot coincide, it means that all the data is used to calculate the EISN of that day.
Noticeable Solar Events (20 Sep 2021 - 26 Sep 2021)
| DAY | BEGIN | MAX | END | LOC | XRAY | OP | 10CM | TYPE | Cat | NOAA |
| 23 | 0435 | 0442 | 0450 | S27E21 | M2.8 | 1N | VI/2II/2 | 45 | 2871 | |
| 23 | 1523 | 1528 | 1539 | S30E15 | M1.8 | 1N | III/2 | 45 | 2871 |
| LOC: approximate heliographic location | TYPE: radio burst type |
| XRAY: X-ray flare class | Cat: Catania sunspot group number |
| OP: optical flare class | NOAA: NOAA active region number |
| 10CM: peak 10 cm radio flux |
Review of geomagnetic activity
The solar wind (as observed by ACE and DSCOVR) became enhanced on Sep 21-22. The origin was not clear, it could had been a boundary crossing or a co-rotating interaction region combined with the high speed stream associated with the positive polarity coronal holes present on the visible solar disk at the beginning of the week. The interplanetary magnetic field magnitude reached values up to 10 nT on Sep 21 23:15UT, and the Bz component fluctuated dropping to -9 nT at about Sep 21 19:00UT.
A second enhancement was observed mid-Sep 23 to Sep 26, possibly due to the arrival of the CME from Sep 19 combined with the negative polarity coronal hole that crossed central meridian on Sep 20. The solar wind speed increased to values up to 575 km/s about Sep 25 04:50 UTC.
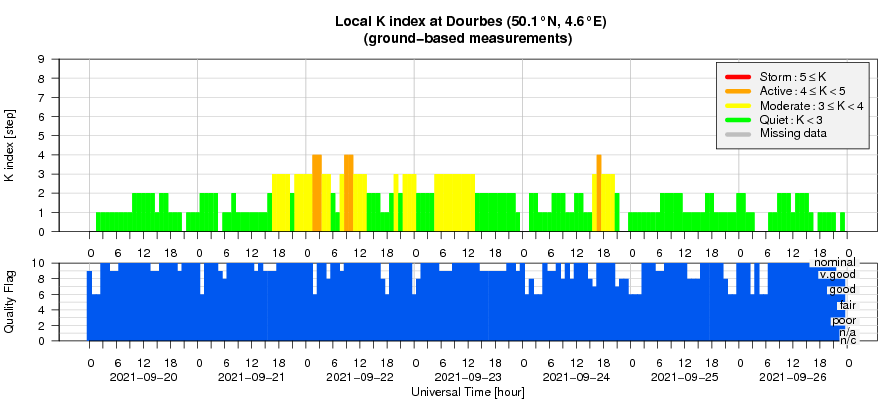
The geomagnetic conditions were varying from quiet to unsettled, with two active periods on Sep 22 and Sep 23 in response to the solar wind enhancement on Sep 21-22 (NOAA-Kp and K-Dourbes = 4).
Geomagnetic Observations at Dourbes (20 Sep 2021 - 26 Sep 2021)
The SIDC Space Weather Briefing
The Space Weather Briefing presented by the forecaster on duty from Sep 19 to 26. It reflects in images and graphs what is written in the Solar and Geomagnetic Activity report.

A pdf-version: https://www.stce.be/briefings/20210927_SWbriefing.pdf
The movie: https://www.stce.be/briefings/20210927_SWbriefing.m4v
Review of ionospheric activity (20 Sep 2021 - 26 Sep 2021)
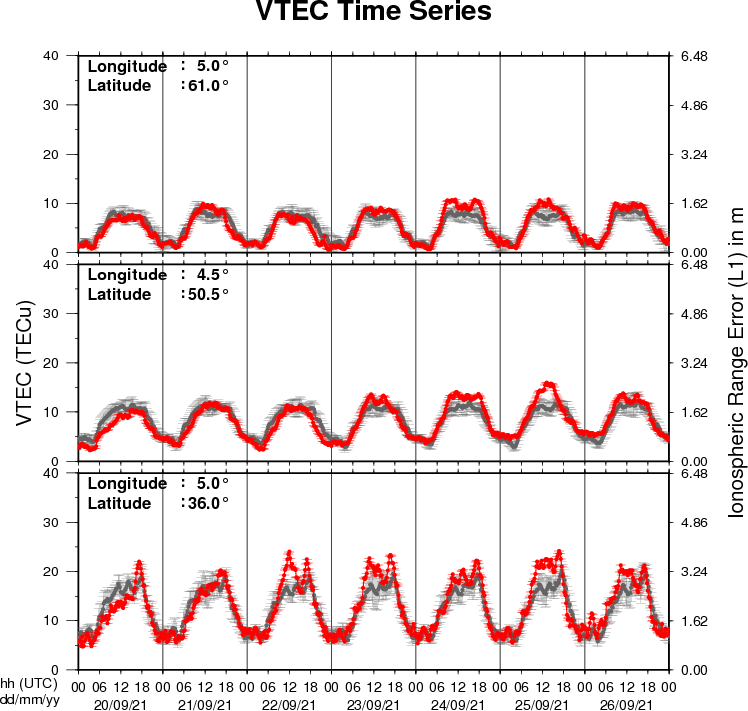
The figure shows the time evolution of the Vertical Total Electron Content (VTEC) (in red) during the last week at three locations:
a) in the northern part of Europe(N61°, 5°E)
b) above Brussels(N50.5°, 4.5°E)
c) in the southern part of Europe(N36°, 5°E)
This figure also shows (in grey) the normal ionospheric behaviour expected based on the median VTEC from the 15 previous days.
The VTEC is expressed in TECu (with TECu=10^16 electrons per square meter) and is directly related to the signal propagation delay due to the ionosphere (in figure: delay on GPS L1 frequency).
The Sun's radiation ionizes the Earth's upper atmosphere, the ionosphere, located from about 60km to 1000km above the Earth's surface.The ionization process in the ionosphere produces ions and free electrons. These electrons perturb the propagation of the GNSS (Global Navigation Satellite System) signals by inducing a so-called ionospheric delay.
See http://stce.be/newsletter/GNSS_final.pdf for some more explanations ; for detailed information, see http://gnss.be/ionosphere_tutorial.php