- Table of Content
- 1.From sunspot t...
- 2.Review of sola...
- 3.The Internatio...
- 4.PROBA2 Observa...
- 5.Noticeable Sol...
- 6.Review of geom...
- 7.Geomagnetic Ob...
- 8.The SIDC Space...
- 9.Review of iono...
- 10.STCE in action...
2. Review of solar activity
3. The International Sunspot Number by Silso
4. PROBA2 Observations (4 Oct 2021 - 10 Oct 2021)
5. Noticeable Solar Events (4 Oct 2021 - 10 Oct 2021)
6. Review of geomagnetic activity
7. Geomagnetic Observations at Dourbes (4 Oct 2021 - 10 Oct 2021)
8. The SIDC Space Weather Briefing
9. Review of ionospheric activity (4 Oct 2021 - 10 Oct 2021)
10. STCE in action
From sunspot to geomagnetic storm
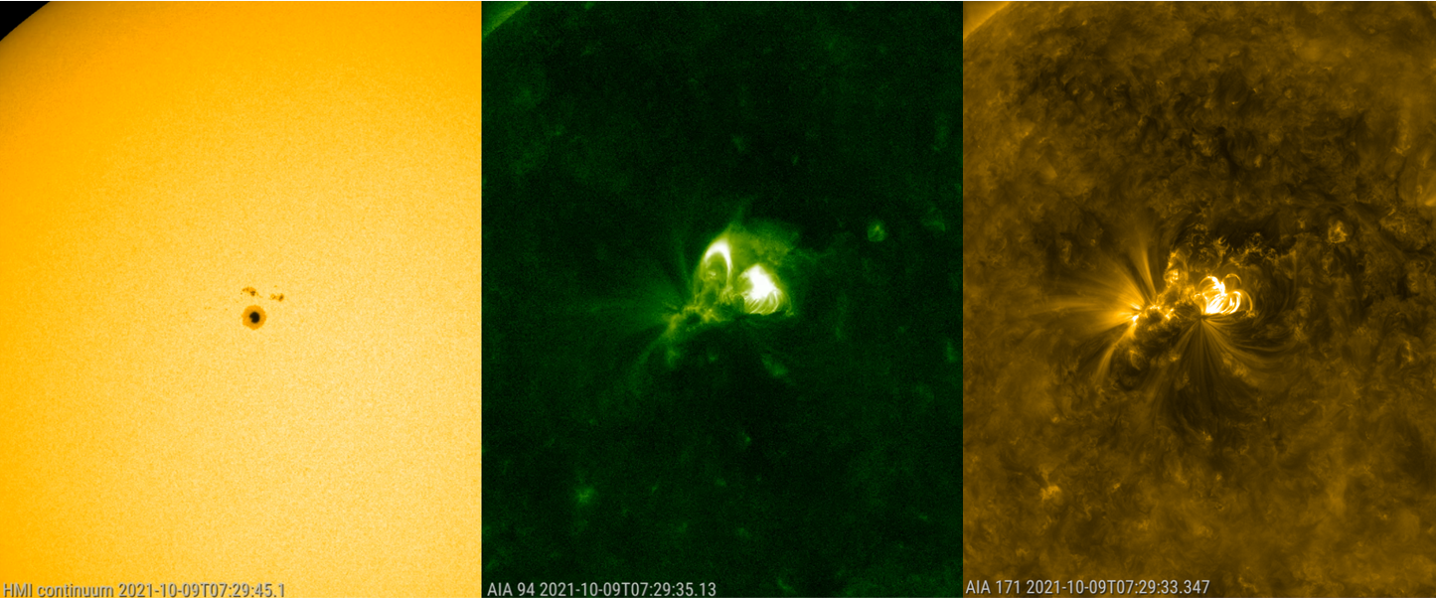
NOAA 2882 rounded the northeast solar limb on 3 October as a large but symmetric sunspot group. It was flare quiet, until a small bipolar region emerged nearby and to the north of the main spot on 7 October. The magnetic interaction resulted in a number of C-class flares, but more importantly an M1.6 flare on 9 October (peak at 06:38 UTC) while NOAA 2882 was close to the central meridian. The SDO (https://sdo.gsfc.nasa.gov/data/aiahmi/ ) images underneath show the sunspot region about an hour after the flare peak in x-ray. On the left is the white light image showing the sunspot group NOAA 2882, and in the middle is an extreme ultraviolet (EUV) image obtained via the AIA 094 filter, showing the area at a temperature of several million degrees. Aside some post-flare coronal loops over the main blast area (northwest, or "upper right" of the main spot), the EUV image also shows a cusp (flamelike structure) to the northeast (upper left) of the main spot. Though both features testify of the magnetic reconnection that took place, the cusp is only visible in high-temperature filters, i.e. it was not visible in EUV imagery with the AIA 171 filter (right image) that shows the corona at lower temperatures of about 700.000 degrees. Movies of the eruption are available in the online version of this article at https://www.stce.be/news/555/welcome.html
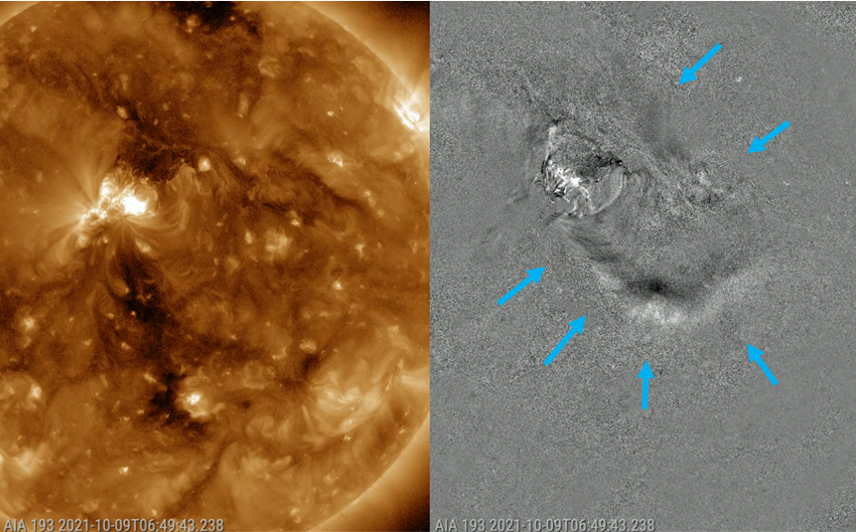
Cusps and post-flare coronal loops are indications that a coronal mass ejection (CME) might have been associated with the M1 flare. Further proof came from images with SDO/AIA 193 (temperatures of about 1.25 million degrees) showing coronal dimming (a temporary darkening in the solar corona, also known as "transient coronal hole") to the north of the region as well as the presence of a coronal wave (see this STCE Newsitem at https://www.stce.be/news/241/welcome.html for more info) emanating from the flare source location. The image underneath left shows the solar corona as seen with the AIA 193 filter, whereas the annotated image to the right is a difference AIA 193 image, i.e. one image subtracted from the other thus enhancing the details in these EUV images. The outlines of the coronal wave are highlighted with blue arrows on the difference image. Note how the coronal wave mimicks the boundaries of the elongated coronal holes to the south, southwest and northwest of the erupting region. The magnetic fields of the coronal holes effectively act as a magnetic wall against the expanding coronal wave, often giving it an asymmetic shape as is the case here.
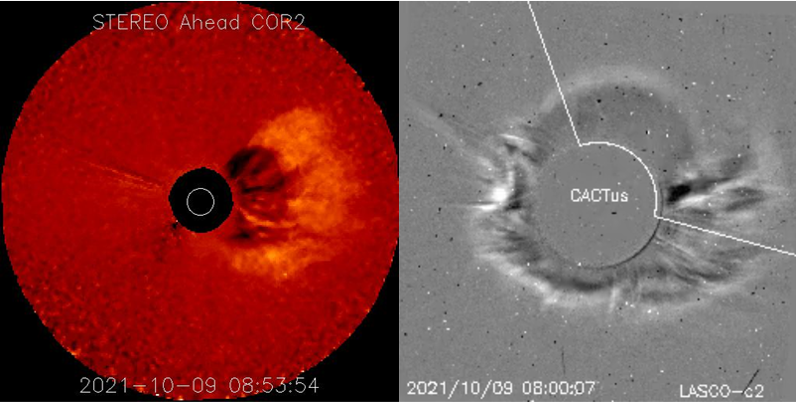
Sure enough, a CME was observed in the available coronagraphic images taken by coronagraphs on board the SoHO and STEREO-A spacecraft. This can be seen in the compilation underneath, with the left one taken by STEREO-A/COR2 (https://stereo-ssc.nascom.nasa.gov/beacon/ ) which is currently trailing the Earth by about 38 degrees (so the Earth in that image is to the right). The SoHO/LASCO C2 (https://soho.nascom.nasa.gov/ ) difference images on the right (CACTus, https://wwwbis.sidc.be/cactus/ ) show a clear and obvious halo CME (the more or less symmetric ring around the Sun) indicating this CME is directed straight to Earth. Space weather forecasters at the SIDC (http://www.sidc.be/ ) measured the projected speed (plane-of-the-sky) to be 692 km/s, with the true speed estimated to be around 950 km/s. Taking into account low values for the solar wind background, the transit time to Earth was calculated to be about 62 hours, and that the arrival at Earth would be early on 12 October, around 01:00 UTC with an uncertainty of 12 hours.
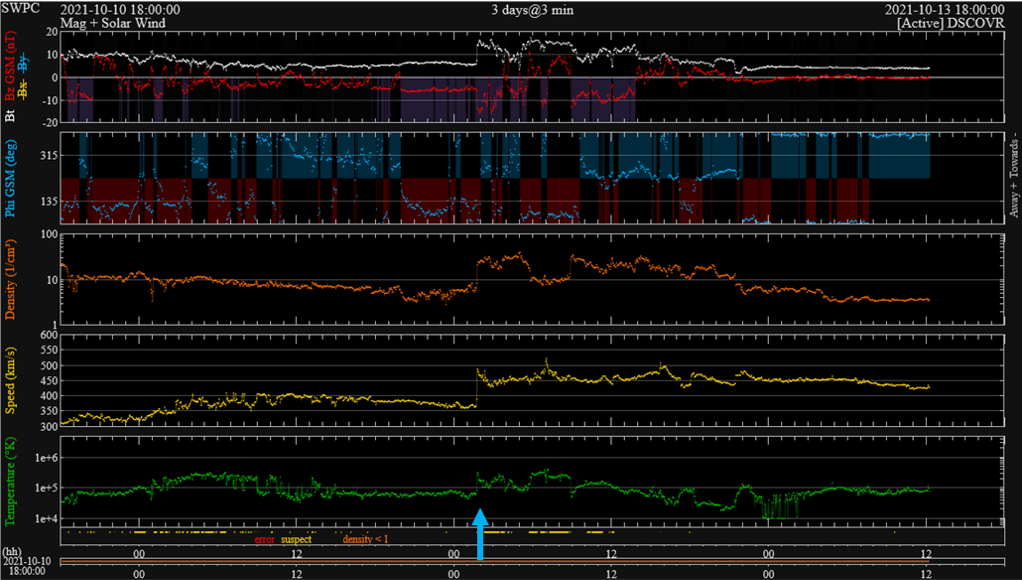
As it turned out, this was a very accurate prediction, as DSCOVR (https://www.swpc.noaa.gov/products/real-time-solar-wind ) recorded the shock of this interplanetary CME on 12 October at 01:45 UTC. The solar wind speed (yellow curve in graph underneath) jumped from about 365 to 490 km/s, while the magnitude of the Interplanetary Magnetic Field (IMF, white curve) jumped from about 5.5 to 14.5 nT. Bz (red curve) was below -5 nT most of the time since 0h UT, with a minimum of -16 nT. These conditions resulted in a minor (K Dourbes = 5) to moderate (Kp = 6) geomagnetic storm. The Dst index reached -53 nT, so barely making it into the moderate category. See the STCE SWx Classifications page at https://www.stce.be/educational/classification for details. Aurora were seen in Alaska and the northern USA states, Canada, Scandinavia and northern Scotland, featuring mostly the typical greenish color. Images are available at https://spaceweathergallery.com/aurora_gallery.html
Review of solar activity
The Sun was active over the past week. The Catania sunspots group 58 (NOAA AR-2882) has produced several flares including an M1.6- flare peaking at 06:38 UTC on Oct 9.
A full halo coronal mass ejection (CME) was observed by the coronagraph SOHO/LASCO on Oct 9 at 07:24 UTC. The CME was associated with the M1.6 flare originating from the Catania sunspots group 58 (NOAA AR-2882), which was at the time of the event located near the central meridian. The software CACTus estimated a (projected) speed of 692 km/s, the true speed 950 km/s.
The greater than 10 MeV proton flux was nominal.
The greater than 2 MeV electron flux was nominal with values below 1000 pfu.
The greater than 2 MeV electron fluence was also nominal.
The International Sunspot Number by Silso
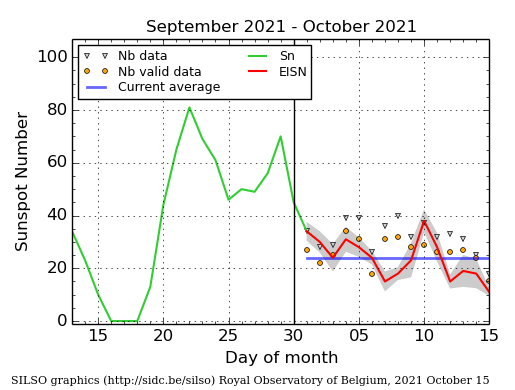
The daily Estimated International Sunspot Number (EISN, red curve with shaded error) derived by a simplified method from real-time data from the worldwide SILSO network. It extends the official Sunspot Number from the full processing of the preceding month (green line), a few days more than one solar rotation. The horizontal blue line shows the current monthly average. The yellow dots gives the number of stations that provided valid data. Valid data are used to calculate the EISN. The triangle gives the number of stations providing data. When a triangle and a yellow dot coincide, it means that all the data is used to calculate the EISN of that day.
PROBA2 Observations (4 Oct 2021 - 10 Oct 2021)
Solar Activity
Solar flare activity fluctuated from very low to moderate during the week.
In order to view the activity of this week in more detail, we suggest to go to the following website from which all the daily (normal and difference) movies can be accessed: https://proba2.oma.be/ssa
This page also lists the recorded flaring events.
A weekly overview movie can be found here (SWAP week 602): https://proba2.sidc.be/swap/data/mpg/movies/weekly_movies/weekly_movie_2021_10_04.mp4
Details about some of this week's events can be found further below.
If any of the linked movies are unavailable they can be found in the P2SC movie repository here: https://proba2.oma.be/swap/data/mpg/movies/
Saturday Oct 09:
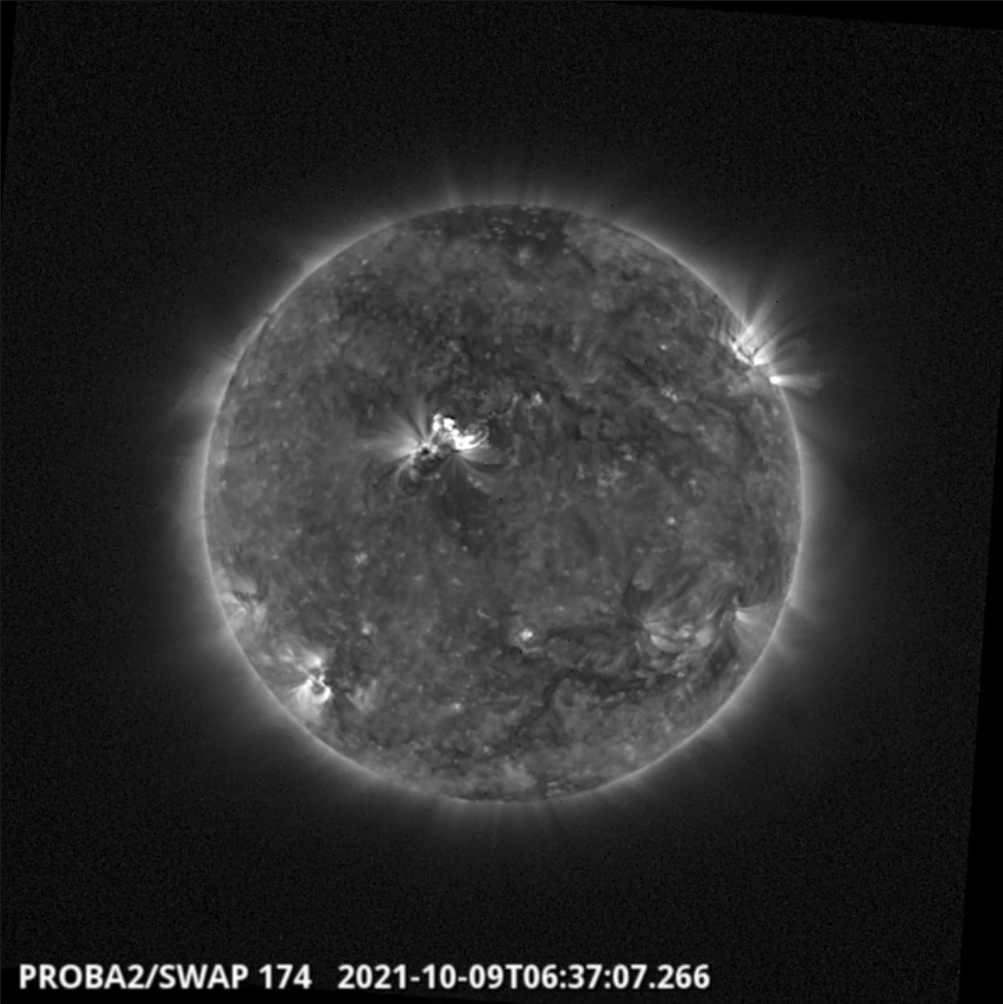
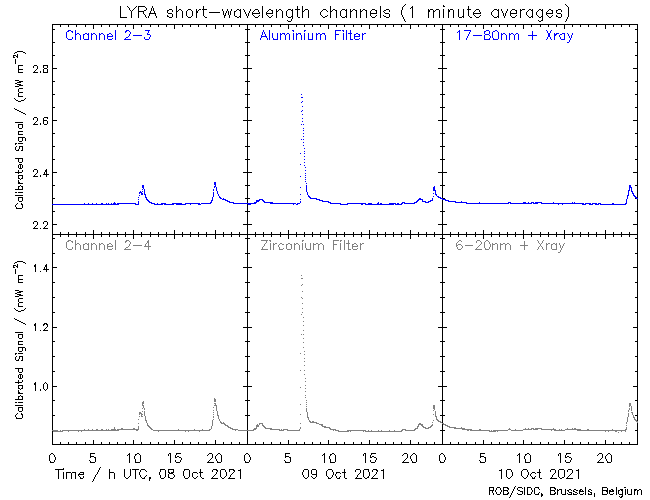
The largest flare of the week, an M1.6 flare, was observed by SWAP and LYRA. The flare is visible in the centre of the solar disk on 2021-Oct-09, as shown in the SWAP image above taken at 06:37 UT.
Find a movie of the event here (SWAP movie): https://proba2.sidc.be/swap/movies/20211009_swap_movie.mp4
Noticeable Solar Events (4 Oct 2021 - 10 Oct 2021)
| DAY | BEGIN | MAX | END | LOC | XRAY | OP | 10CM | TYPE | Cat | NOAA |
| 09 | 0619 | 0638 | 0653 | N17E9 | M1.6 | 2B | 430 | II/3III/3 | 58 | 2882 |
| LOC: approximate heliographic location | TYPE: radio burst type |
| XRAY: X-ray flare class | Cat: Catania sunspot group number |
| OP: optical flare class | NOAA: NOAA active region number |
| 10CM: peak 10 cm radio flux |
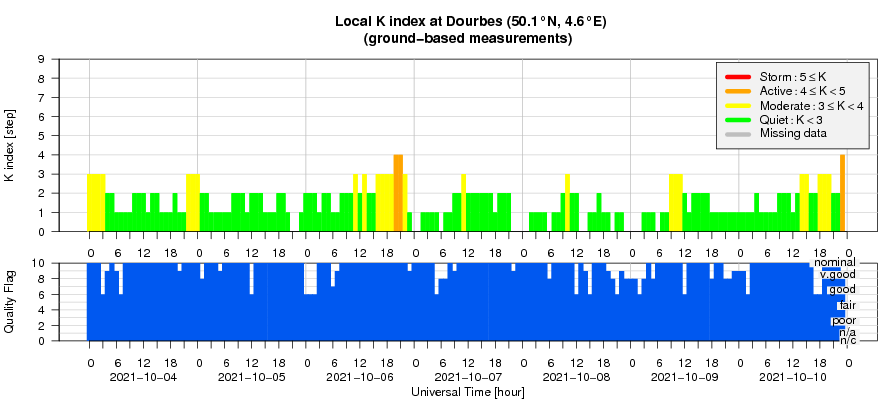
Review of geomagnetic activity
The Earth remained mostly under the slow solar wind speed regime (ranging between 244 km/s and 442 km/s). The interplanetary magnetic field magnitude increased on Oct 06 to 12.0 nT with its Bz components fluctuating between -9.9 nT and 9.9 nT. This enhancement was probably associated with a passage of transient solar wind structure with slow speed similar to the background solar wind.
The geomagnetic conditions were mostly quiet. In response to the slight enhancement of the interplanetary magnetic field and its southward directed Bz component reaching -9.9 nT, the geomagnetic conditions were at unsettled to active levels.
Geomagnetic Observations at Dourbes (4 Oct 2021 - 10 Oct 2021)
The SIDC Space Weather Briefing
The Space Weather Briefing presented by the forecaster on duty from Oct 3 to 10. It reflects in images and graphs what is written in the Solar and Geomagnetic Activity report.

A pdf-version: https://www.stce.be/briefings/20211011_SWbriefing.pdf
The movie: https://www.stce.be/briefings/20211011_SWbriefing.m4v
Review of ionospheric activity (4 Oct 2021 - 10 Oct 2021)
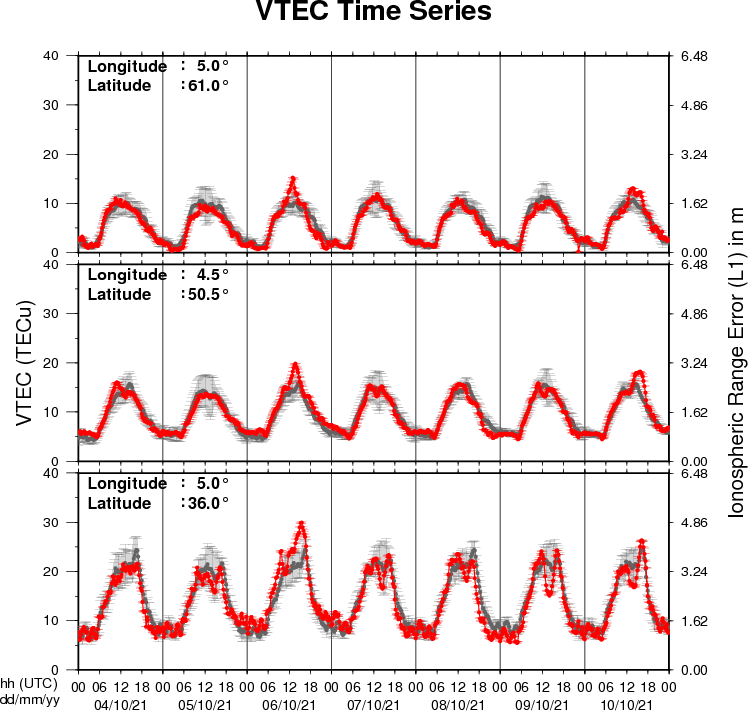
The figure shows the time evolution of the Vertical Total Electron Content (VTEC) (in red) during the last week at three locations:
a) in the northern part of Europe(N61°, 5°E)
b) above Brussels(N50.5°, 4.5°E)
c) in the southern part of Europe(N36°, 5°E)
This figure also shows (in grey) the normal ionospheric behaviour expected based on the median VTEC from the 15 previous days.
The VTEC is expressed in TECu (with TECu=10^16 electrons per square meter) and is directly related to the signal propagation delay due to the ionosphere (in figure: delay on GPS L1 frequency).
The Sun's radiation ionizes the Earth's upper atmosphere, the ionosphere, located from about 60km to 1000km above the Earth's surface.The ionization process in the ionosphere produces ions and free electrons. These electrons perturb the propagation of the GNSS (Global Navigation Satellite System) signals by inducing a so-called ionospheric delay.
See http://stce.be/newsletter/GNSS_final.pdf for some more explanations ; for detailed information, see http://gnss.be/ionosphere_tutorial.php
STCE in action
Check out our activity calendar: activities and encounters with the Sun-Space-Earth system and Space Weather as main themes. We provide occasions to get submerged in our world through educational, informative and instructive activities.
* October 21, Seminar - Understanding rainfall variability using climate models over the Ethiopian Highlands, organisation by the RMI
* October 25 - 29, European Space Weather Week, conference, Glasgow and online
* October 28, Seminar - Simulating tree growth response to climate change in structurally-complex oak and beech stands across Europe, organisation by the RMI
* November 22 - 26, Online SWx introductory Course (SWIC), organisation by the STCE - complete
* November 28, Dag van de wetenschap, Brussels, Belgium - STCE will bring 'Panic in the Space Weather Room'
* December 2, ISSI Game Changers Online Seminars: Tipping positive change to avoid climate tipping points
* December 3 - 4, Space Days at the Big Bang festival, STCE will bring 'Panic in the Space Weather Room' and 'Satellites'
* December 9, ISSI Game Changers Online Seminars: Space Weather
* December 16, ISSI Game Changers Online Seminars: Sursurface Life on Earth and on Other Planets in the Solar System
In 2022
* Januari 25, Public Lecture on the Solar Corona in EUV (Dutch), Urania, Hove, Belgium
* Januari 22, Public Lecture on Space Weather and Aviation (Dutch), Urania, Hove, Belgium
* April 28, Public Lecture on SDO/EUI, Astropolis, Oostende, Belgium
* August 25, Public Lecture on Space Weather and Aviation, Astropolis, Oostende, Belgium
Check: https://www.stce.be/calendar
We plan again an online SWIC in the week of Feb 14 to 18, 2022 and an on-site SWIC in the week of March 14 - 18, 2022. Registrations are not open yet, but you can note already the dates if you are interested.