- Table of Content
- 1.Antartic Solar...
- 2.EUHFORIA predi...
- 3.An exit in sty...
- 4.Review of sola...
- 5.The Internatio...
- 6.PROBA2 Observa...
- 7.Review of geom...
- 8.Geomagnetic Ob...
- 9.The SIDC Space...
- 10.Review of iono...
- 11.Action!
2. EUHFORIA predicts the Antarctic Solar Eclipse
3. An exit in style
4. Review of solar activity
5. The International Sunspot Number by Silso
6. PROBA2 Observations
7. Review of geomagnetic activity
8. Geomagnetic Observations in Belgium
9. The SIDC Space Weather Briefing
10. Review of ionospheric activity
11. Action!
Antartic Solar Eclipse

Let's hope the penguins have their eclipse glasses ready. They will form most of the crowd in the Antarctic that will be able to witness a total solar eclipse on December 4. Fortunately, spectators in parts of southern Africa, South Australia, New Zealand and South America will see a partial solar eclipse, if the weather cooperates of course. Simulation 1 (link below) shows the eclipse path, following the eclipse from west to east at a greater speed than the Earth's rotation (giving the false impression that the Earth is spinning in the wrong direction).
As always, the LYRA and SWAP instruments on PROBA2 are ready to observe this spectacle from their sun-synchronous orbit around Earth. Due to the high velocity at which the satellite orbits, the instruments onboard will be able to observe as much as three occultations, and one more passage of the Moon in the SWAP field-of-view. Also for PROBA2 the eclipse will almost be a total one: at the second occultation (that is a passage of the Moon in front of the Sun) more than 95% of the solar disk will be covered! All four passages of the Moon before SWAP's eye are shown in�simulation 2 (link below). All observations will become available on the PROBA2 website: https://proba2.sidc.be/2021Dec4Eclipse .
Simulation 1: proba2.sidc.be/sites/default/files/videos/original/anim3d-360_0.mp4
Simulation 2: proba2.sidc.be/sites/default/files/videos/original/eclipse_2021-12-04_0.mov
EUHFORIA predicts the Antarctic Solar Eclipse
Scientists try to predict how the solar atmosphere would look like during the 04/12/2021 eclipse. They made a picture by running a computer programme called EUHFORIA, https://euhforia.com.
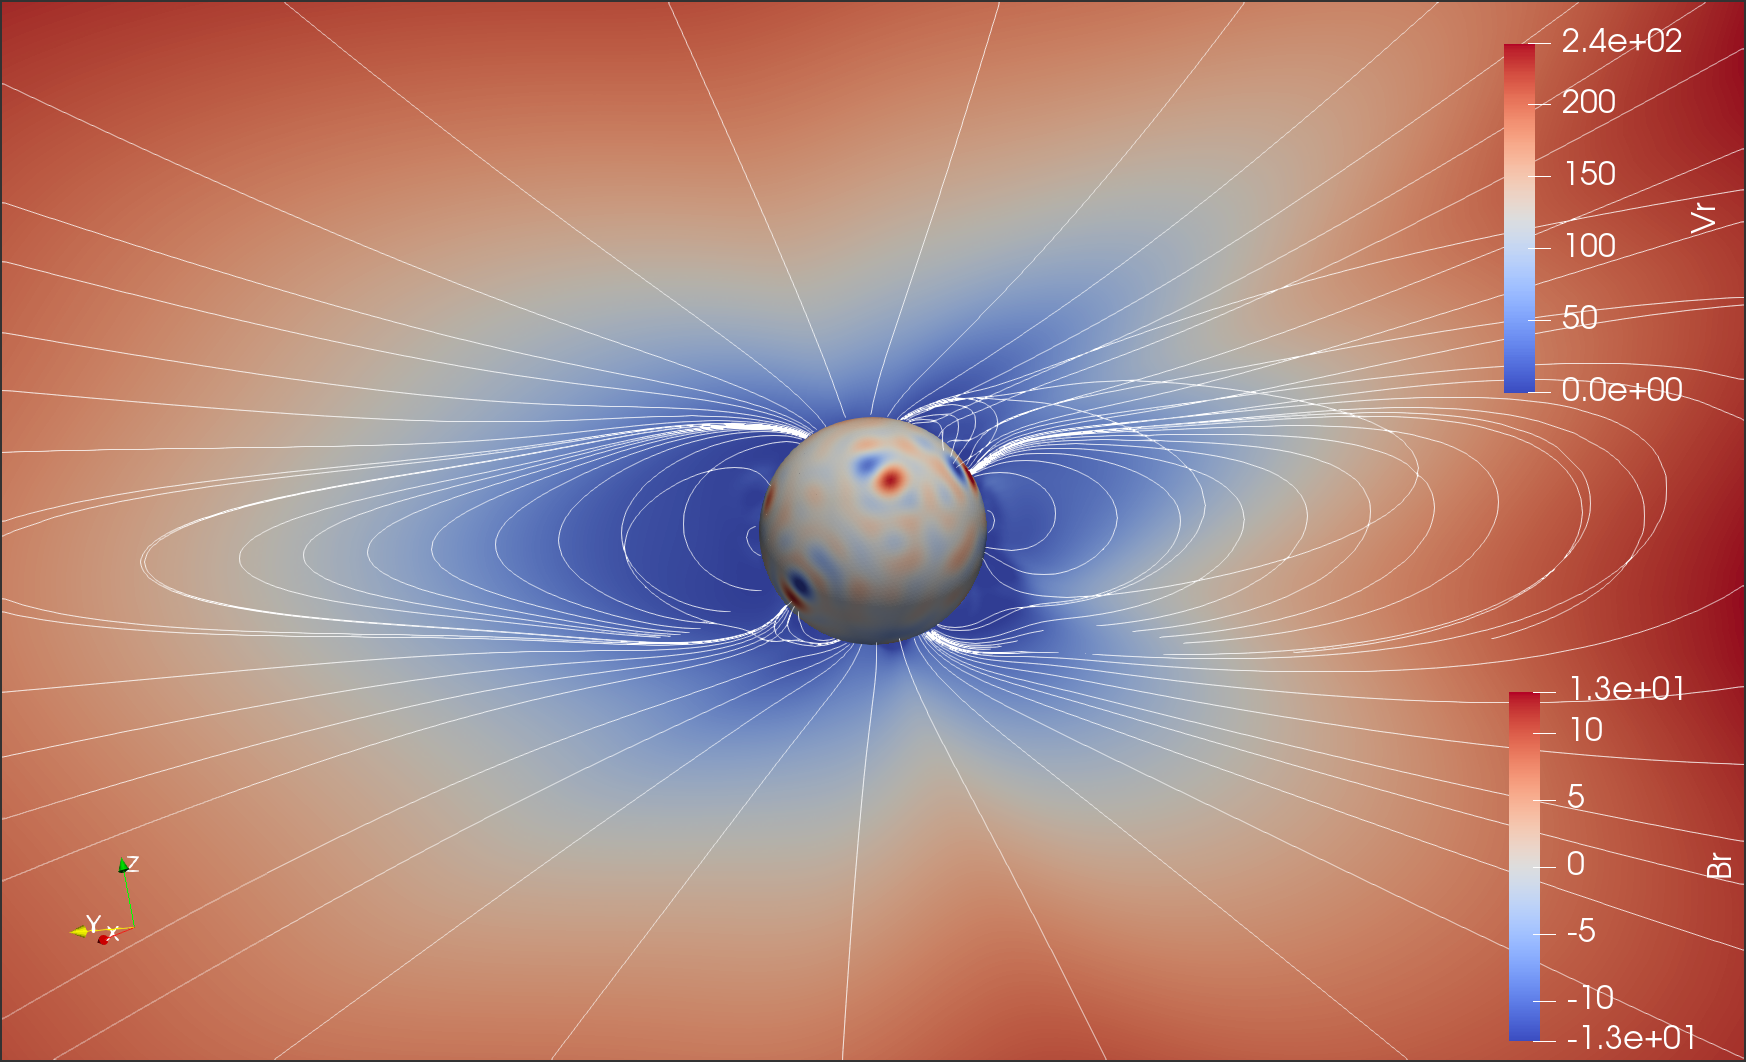
The color bar at the bottom right gives the strength of the magnetic field (in Gauss) on the Sun. In a real eclipse picture, you can't see the solar surface because it is behind the moon. The color bar at the top right represents the radial velocity of the solar wind (in km/s) in the solar corona.
Big dipole, big and bigger streamers
The Sun is the blue-grey-red sphere. The colours tell you how strong the radial magnetic field is and is similar to magnetograms from the HMI instrument onboard of the satellite SDO. You can see also the positive (red) coronal hole at the solar North pole and the negative (blue) coronal hole at the solar South pole giving rise to a dipole field.The magnetic field in space shown by the white lines has indeed a dominant dipole structure. This is what we expected because we are still close to solar minimum. However, we see also intense red/blue areas at different latitudes. These are active regions that give rise to more complex magnetic structures.
The background red/blue color represents the radial velocity of the wind in km/s with blue a slow wind and red a fast wind. If we link the color scale representing the speed with the white magnetic field lines, we see the so-called streamers: magnetic closed structures extending to several solar radii that are trapping the wind and producing slow wind patches (in blue). At the poles we have open magnetic field lines allowing the wind to accelerate and generate faster wind (in red).
The EUHFORIA model predicts thus an overal dipolar magnetic structure with two big equatorial streamers and local active regions with small pseudo-streamers close to the solar surface.
Real eclipse pictures
Eclipse pictures made from Earth show the surroundings of the Sun reflecting visible light. Such pictures give an idea of the shape and orientation of the streamers which we can qualitatively compare with our picture made by running the new EUHFORIA programme.
Improved computer programme
With the old version of EUHFORIA, it was impossible to produce such pictures because we were not able to calculate the solar wind speed and the magnetic field at places far away from the Sun. The new version of EUHFORIA is a much stronger programme. The programmers also made sure that the new version was as fast as the old version. Which is crucial if we want to use EUHFORIA for forecast purposes.
Let�s ask the penguins on December 4!
An exit in style
NOAA 2891 was responsible for various M- and C-class flares while transiting the solar disk from 26 October till 7 November. It also was the source of the fast coronal mass ejection (CME) which resulted in the strong geomagnetic storm of 3-4 November (see this STCE Newsitem at https://www.stce.be/news/561/welcome.html ). The region was spotless and significantly less flare-active when it rounded the northwest limb late on 7 November. So it came a little bit as a surprize when a long duration M2 flare from what was likely Region 2891's location was observed on 9 November (peak at 17:02UT). This was an energetic eruption, slightly enhancing the greater then 10 MeV proton flux at geosynchronous orbits to 2.6 pfu, but remaining well below the alert threshold of 10 pfu. The eruption was also accompanied by a fast CME (900 km/s) which was -in view of the source location- not directed to Earth.
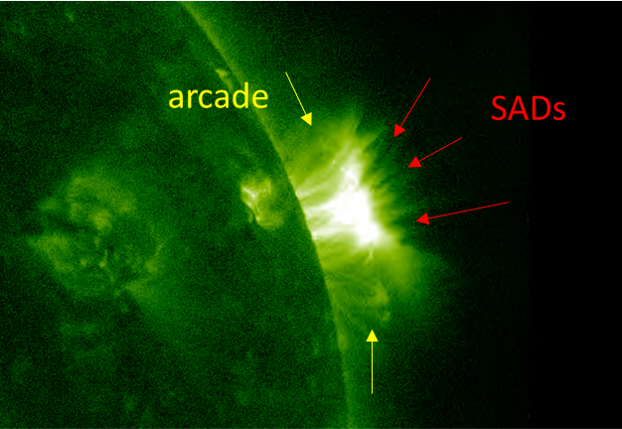
The above extreme ultraviolet (EUV) imagery of the flaring event (SDO/AIA 094 - https://sdo.gsfc.nasa.gov/data/aiahmi/ ) reveals the presence of so-called supra-arcade downflows (SADs) which were for the first time observed on 20 January 1999 by the Soft X-ray Telescope (SXT) on Yohkoh. They are dark voids that usually flow downwards above post-flare loops during the decay phase of the flare (McKenzie and Hudson 1999 - https://ui.adsabs.harvard.edu/abs/1999ApJ...519L..93M/abstract). Hence their name: supra ("above") arcade (= series of post-flare loops) downflows. Because of their appearance, they are often also called "tadpoles". See the annotated image above as well as this STCE Newsitem at https://www.stce.be/news/331/welcome.html for another example. A clip of this event can be found in the online version of this article at https://www.stce.be/news/562/welcome.html
With the launch of the Solar Dynamics Observatory (SDO), SADs were observed more frequently by the higher temperature EUV channels such as AIA131 or AIA094 which are sensitive to high temperatures plasma of several million to about 10 million degrees. SADs are thought to play an important role in the release of flare energy, with their temperature generally lower than that of the surrounding structures. The velocity of SADs ranges from a few tens to hundreds of km/s (no typo!), but no matter what velocities the SADs have, they finally stop at the flare loop top, and the rate of deceleration, while uncertain, appears to be consistent with drag. Several models have been proposed to explain the formation of SADs (see e.g. Li et al. 2021 at https://ui.adsabs.harvard.edu/abs/2021ApJ...915..124L/abstract for a discussion). One of the more recent models was proposed by Xue et al. (2020 - https://ui.adsabs.harvard.edu/abs/2020ApJ...898...88X/abstract ), who directly explained the formation of SADs by stating that the patchy and bursty magnetic reconnection outflows may push away surrounding plasma and leave dark lanes behind them. The magnetic field may play an important role in inhibiting plasma mixing and preventing SADs from being filled by ambient plasma immediately. Considering there are plenty of other models proposed, the last word on the formation of SADs is certainly not said.
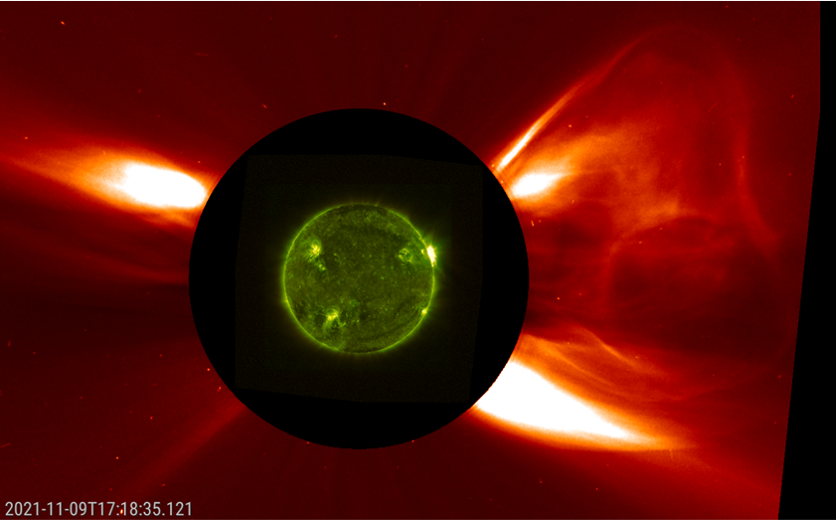
In the composition underneath, the SDO/AIA 094 (green) imagery is overlaid with the PROBA2/SWAP wide-field EUV imagery (yellow - https://proba2.sidc.be/ ) on top of the LASCO/C2 coronagraphic imagery. It shows the fast, non earth-directed CME that was associated with this energetic event. Note, in the clip, the continued patchy outflow once the CME has left the coronagraph's field-of-view.
Review of solar activity
Active region, NOAA ARs 2896, 2897, 2898, 2898, 2900 and 2901 were present on the side of the Sun facing Earth. They all had simple magnetic field configuration (alpha or beta) and none produced a C-flare or higher.
A partial halo CME was observed on 24 November at 14:26 UT (LASCO-C2), coming from a filament eruption in the southern hemisphere. The bulk of the material was directed to the south, but with an Earth directed component.
A small equatorial coronal hole crossed the central meridian on 23 November.
The greater than 10 MeV proton flux was at nominal levels. The greater than 2 MeV electron flux was at nominal levels most of the week, except a few hours on 24 and 26 November. The greater than 2 MeV electron fluence was at normal levels.
The International Sunspot Number by Silso
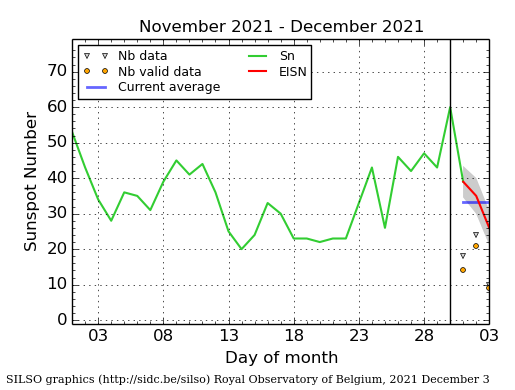
The daily Estimated International Sunspot Number (EISN, red curve with shaded error) derived by a simplified method from real-time data from the worldwide SILSO network. It extends the official Sunspot Number from the full processing of the preceding month (green line), a few days more than one solar rotation. The horizontal blue line shows the current monthly average. The yellow dots gives the number of stations that provided valid data. Valid data are used to calculate the EISN. The triangle gives the number of stations providing data. When a triangle and a yellow dot coincide, it means that all the data is used to calculate the EISN of that day.
PROBA2 Observations
Solar Activity
Solar flare activity was very low during the week.
In order to view the activity of this week in more detail, we suggest to go to the following website from which all the daily (normal and difference) movies can be accessed: https://proba2.oma.be/ssa
This page also lists the recorded flaring events.
A weekly overview movie can be found here (SWAP week 609). https://proba2.oma.be/swap/data/mpg/movies/weekly_movies/weekly_movie_2021_11_22.mp4
Details about some of this week�s events can be found further below.
If any of the linked movies are unavailable they can be found in the P2SC movie repository here https://proba2.oma.be/swap/data/mpg/movies/
Wednesday Nov 24
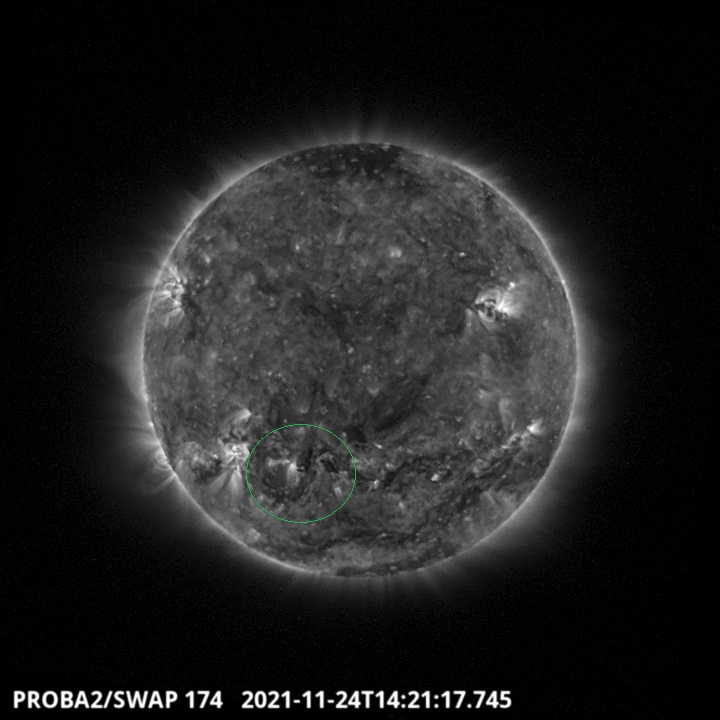
A filament eruption took place in the South hemisphere around 14:21 UT, followed by a coronal mass ejection (CME) - SWAP image. Find a movie of the events here (SWAP movie) https://proba2.oma.be/swap/data/mpg/movies/20211124_swap_movie.mp4
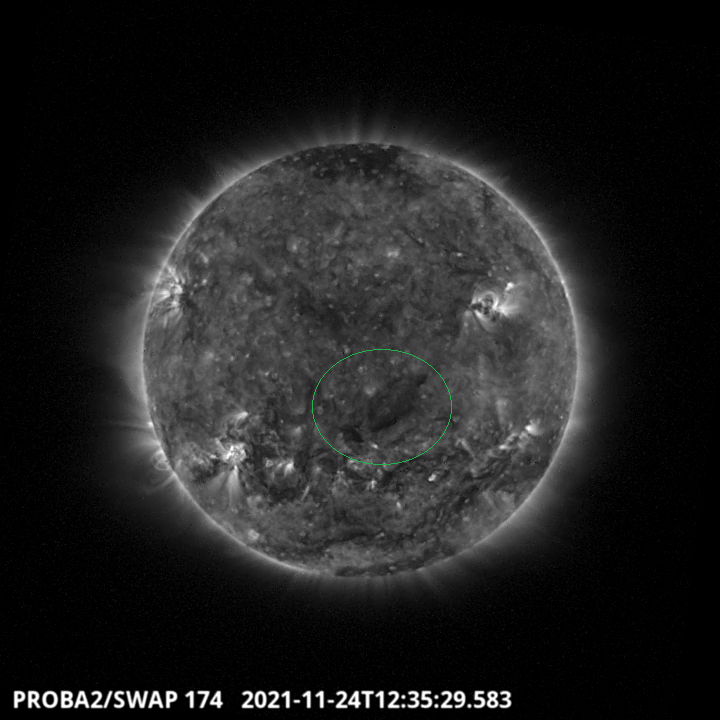
A Coronal hole crossed the central meridian around 12:35UT - SWAP image
Find a movie of the events here (SWAP movie) https://proba2.oma.be/swap/data/mpg/movies/20211124_swap_movie.mp4
Review of geomagnetic activity
The solar wind speed was around 600 km/s at the beginning of the week, due to a high speed stream that started the previous week, but it decreased in the coming days to reach 300 km/s on 27 November. A shock from the 24 November CME passed the spacecraft DSCOVR in L1 at 21:50 UT on 27 November. The magnetic field jumped from 6 nT to 13 nT (reaching 17 nT later) and the speed from 300 km/s to 380 km/s. The bulk of the ICME seemed to have passed south of the Earth and its effect was weak. Bz reached -16 nT, but only briefly, with V around 400 km/s.
This led to only unsettled geomagnetic conditions (K_BEL and Kp equal 3). The magnetic field remained elevated for several days (around 10 nT), as the Earth was probably passing through the elongated flank of the CME.
Quiet to unsettled geomagnetic conditions were observed for the entire week (K_BEL and Kp between 0 and 3).
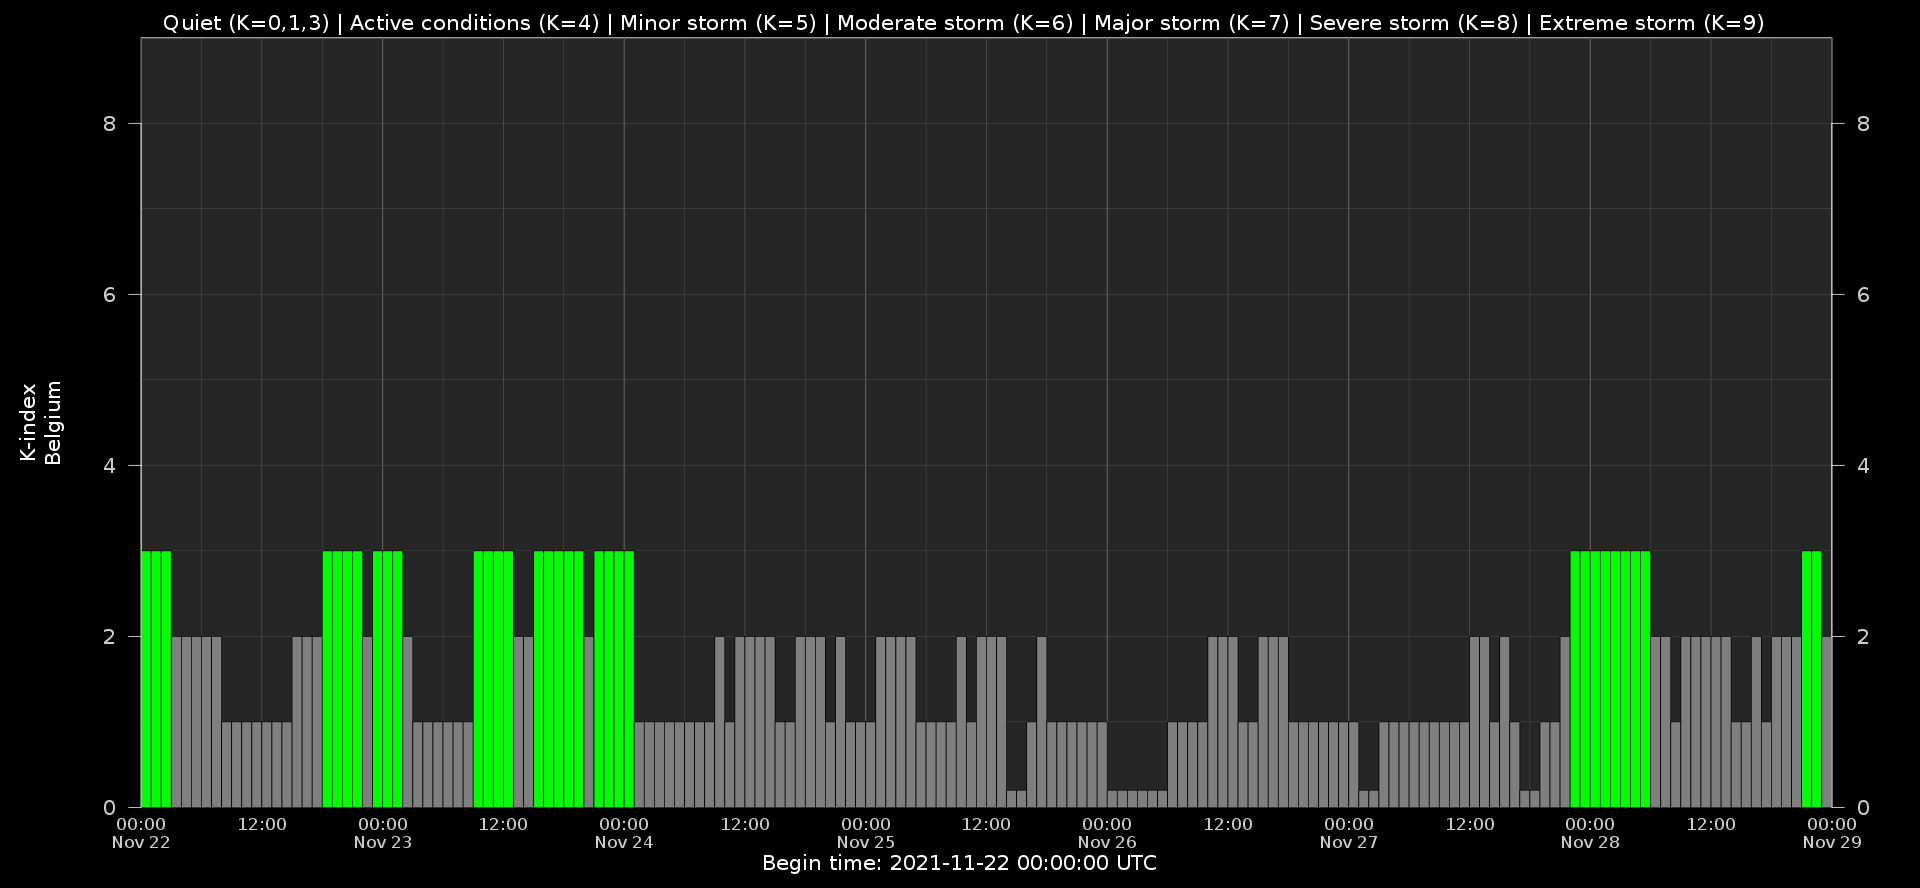
Geomagnetic Observations in Belgium
Local K-type magnetic activity index for Belgium based on data from Dourbes (DOU) and Manhay (MAB). Comparing the data from both measurement stations allows to reliably remove outliers from the magnetic data. At the same time the operational service availability is improved: whenever data from one observatory is not available, the single-station index obtained from the other can be used as a fallback system.
Both the two-station index and the single station indices are available on http://ionosphere.meteo.be/geomagnetism/K_BEL/
The SIDC Space Weather Briefing
The Space Weather Briefing presented by the forecaster on duty from Nov 21 to 28. It reflects in images and graphs what is written in the Solar and Geomagnetic Activity report.
A pdf-version: https://www.stce.be/briefings/20211129_SWbriefing.pdf
The movie: https://www.stce.be/briefings/20211129_SWbriefing.m4v
Review of ionospheric activity
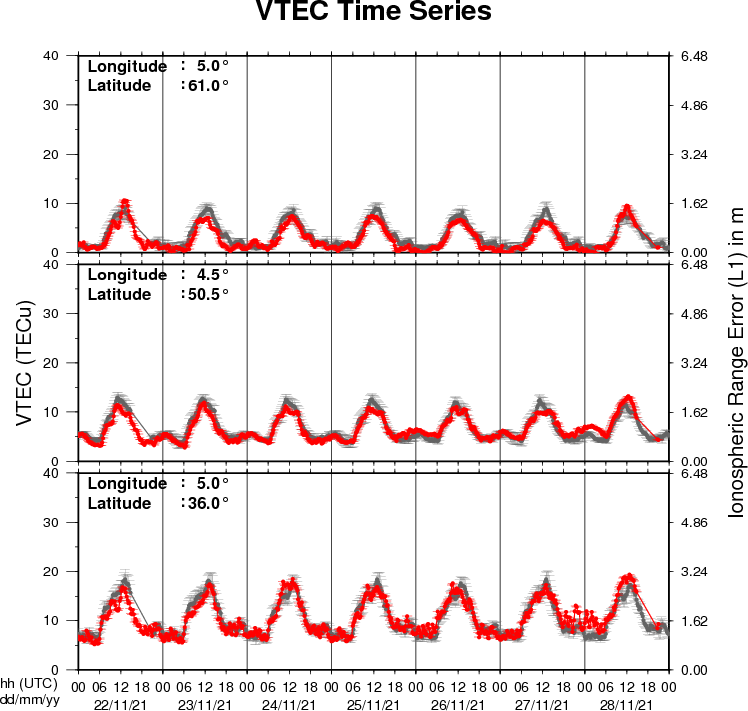
The figure shows the time evolution of the Vertical Total Electron Content (VTEC) (in red) during the last week at three locations:
a) in the northern part of Europe(N61�, 5�E)
b) above Brussels(N50.5�, 4.5�E)
c) in the southern part of Europe(N36�, 5�E)
This figure also shows (in grey) the normal ionospheric behaviour expected based on the median VTEC from the 15 previous days.
The VTEC is expressed in TECu (with TECu=10^16 electrons per square meter) and is directly related to the signal propagation delay due to the ionosphere (in figure: delay on GPS L1 frequency).
The Sun's radiation ionizes the Earth's upper atmosphere, the ionosphere, located from about 60km to 1000km above the Earth's surface.The ionization process in the ionosphere produces ions and free electrons. These electrons perturb the propagation of the GNSS (Global Navigation Satellite System) signals by inducing a so-called ionospheric delay.
See http://stce.be/newsletter/GNSS_final.pdf for some more explanations ; for detailed information, see http://gnss.be/ionosphere_tutorial.php
Action!
Check out our activity calendar: activities and encounters with the Sun-Space-Earth system and Space Weather as main theme. We provide occasions to get submerged in our world through educational, informative and instructive activities.
If you want your event in our calendar, contact us: stce_coordination at stce.be
in 2021
* December 9, ISSI Game Changers Online Seminars: Space Weather
* December 10, Seminar: Recent advances and perspectives of the SWIFF plasmasphere model, BIRA-IASB, online
* December 16, ISSI Game Changers Online Seminars: Sursurface Life on Earth and on Other Planets in the Solar System
In 2022
* Januari 25, Public Lecture on the Solar Corona in EUV (Dutch), Urania, Hove, Belgium
* February 14-18, online Space Weather Introductory Course by SWEC, Space Weather Education Center - registrations are open
* February 22, Public Lecture on Space Weather and Aviation (Dutch), Urania, Hove, Belgium
* February 26, Public Lecture on Space Weather, Satellites and Aviation (Dutch), UGent Volkssterrenwacht Armand Pien, Gent, Belgium
* March 14-16, onsite (!) Space Weather Introductory Course by SWEC, Space Weather Education Center - registrations are open
* April 28, Public Lecture on SDO/EUI, Astropolis, Oostende, Belgium
* August 25, Public Lecture on Space Weather and Aviation, Astropolis, Oostende, Belgium
* October 24-28, 18th European Space Weather Week, Zagreb, Croatia
Check: https://www.stce.be/calendar