- Table of Content
- 1.Sparkling NOAA...
- 2.News from PITH...
- 3.Time Lapse of ...
- 4.Review of sola...
- 5.Review of geom...
- 6.PROBA2 Observa...
- 7.The Internatio...
- 8.Noticeable Sol...
- 9.Geomagnetic Ob...
- 10.The SIDC Space...
- 11.Review of iono...
- 12.Action!
2. News from PITHIA-NRF
3. Time Lapse of SUN
4. Review of solar activity
5. Review of geomagnetic activity
6. PROBA2 Observations (28 Mar 2022 - 3 Apr 2022)
7. The International Sunspot Index by SILSO
8. Noticeable Solar Events (28 Mar 2022 - 3 Apr 2022)
9. Geomagnetic Observations in Belgium (28 Mar 2022 - 3 Apr 2022)
10. The SIDC Space Weather Briefing
11. Review of ionospheric activity (28 Mar 2022 - 3 Apr 2022)
12. Action!
Sparkling NOAA 2975
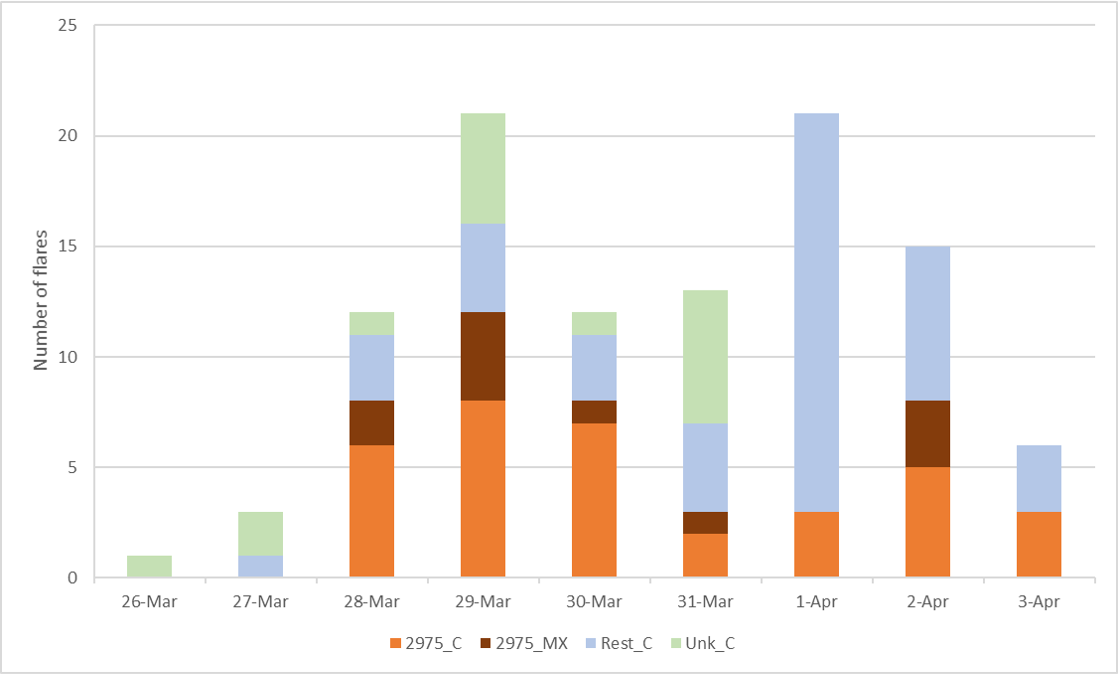
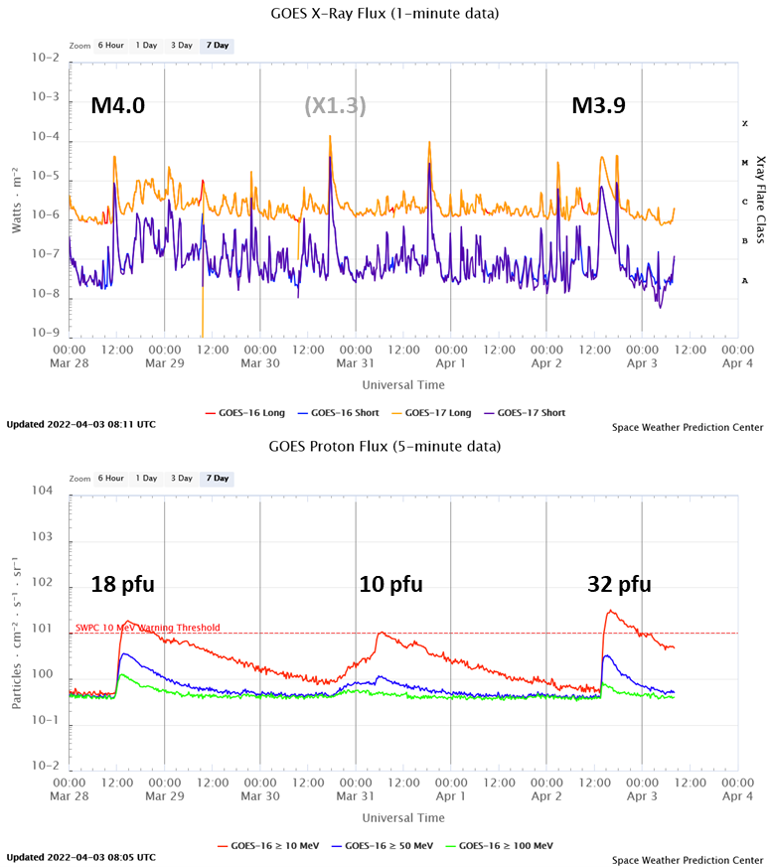
NOAA 2975 kept the space weather forecasters quite busy last week. This complex active region produced one third of all the C-class flares, and was the source of all 10 M-class flares as well as the sole X-class event on 30 March. Underneath is an overview of the solar flare production covering the period 26 March - 03 April. NOAA 2975 started to develop late on 27 March, and was already producing M-class flares a day later. According to the NOAA/GOES data (https://www.swpc.noaa.gov/products/solar-and-geophysical-event-reports ), NOAA 2975 produced about two thirds of its flares during the 28-30 March timeframe, culminating in the X1 flare on 30 March (peak at 17:37UT). Flare production then decreased somewhat, while two closely-spaced active regions in the southern hemisphere (NOAA 2978/2981) took over the C-class flare generation, coinciding with the emergence of numerous small spots in their intermediate portion. Then, on 2 April, NOAA 2975 resumed flare production as a result of interactions with the main spot of nearby NOAA 2976 and the newly emerged sunspot region NOAA 2984.
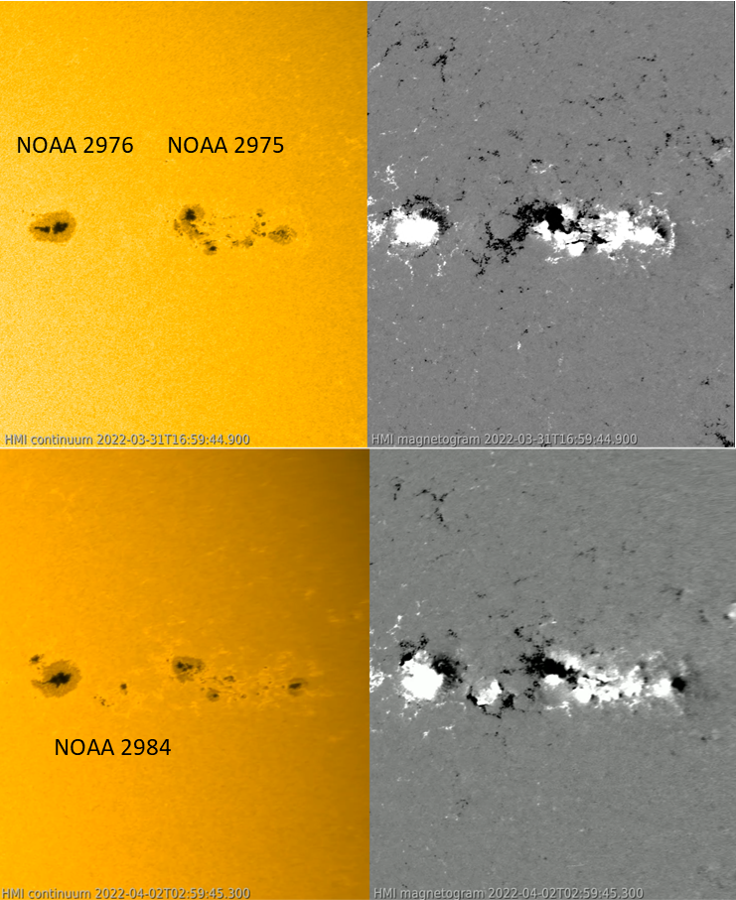
The evolution of NOAA 2975 can be seen in the imagery underneath in white light images (left) and in the magnetograms (right) as obtained by the SDO/HMI instrument (http://sdo.gsfc.nasa.gov/data/aiahmi/ ). White and black denote opposite magnetic polarity (resp. "positive" and "negative"). Dates are 31 March and 2 April. The associated clip is available in the online version of this article at https://www.stce.be/news/581/welcome.html It was created using SWHV (http://swhv.oma.be/user_manual/ ). Instead of letting the regions move through the field of view, SWHV was set up in this case such that it seems to keep hovering right above NOAA 2975, thus allowing for a better view on its evolution. The image "distortions" at the end of the clip are due to the west solar limb approaching.
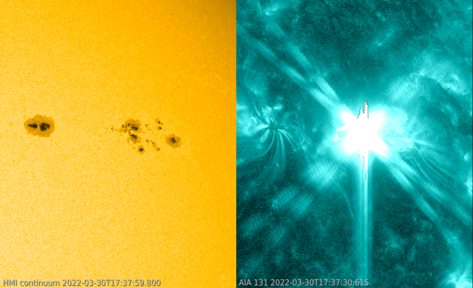
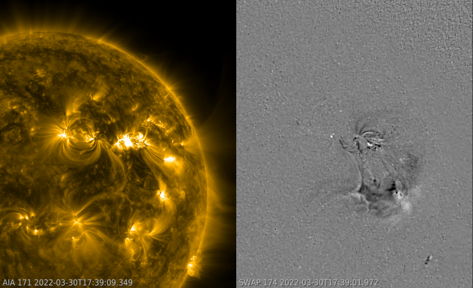
The X1 flare took place in the trailing portion of NOAA 2975, as shown in the white light (left) and extreme ultraviolet (EUV) images (link image) taken by SDO instruments at the timing of the soft x-rays peak. It was associated with a coronal wave (see the STCE news item at https://www.stce.be/news/241/welcome.html for more info) as shown in the PROBA2/SWAP (https://proba2.sidc.be/ssa ) difference imagery, i.e. one image subtracted from the next. A coronal mass ejection (CME) was associated with this eruption, but although it seemed to have an earth-directed component, no obvious signature of it was detected in the solar wind parameters near Earth during the subsequent days.
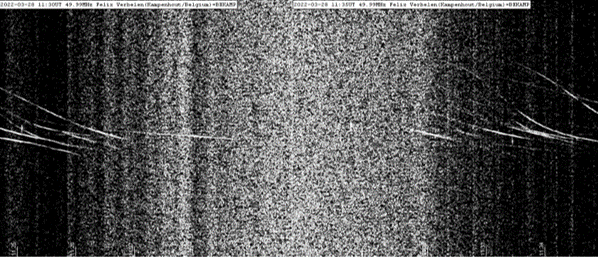
All this extra x-ray radiation energized the ionosphere, a layer of charged particles in the Earth's atmosphere that influences radio communication and satellite-based communication and navigation. Meteor observers using radio equipment were not very happy with all this flaring activity from last week. Indeed, the extra radiation disturbed the ionosphere at the frequencies observed (here around 49 MHz), and so no reflected signal from meteors could be recorded. The attached graph (Credits Felix Verbelen from the BRAMS network - https://brams.aeronomie.be/ ) runs from 11:25UT until 11:35UT and shows a lot of noise between 11:26 and 11:32UT on 28 November, coinciding with the peak of the M4 flare (11:29UT). See this link at https://www.youtube.com/watch?v=JcmTKL560Wg (03:19-05:39) for more info on meteor detection using radio-equipment, and this STCE news item at https://www.stce.be/news/222/welcome.html for an annotated radiospectrogram. In the case of the M4 flare, the disturbed ionosphere did not permit meteor observations for about 6 minutes. The radio observers did report several of these short radio black-outs during last week's elevated solar activity.
Some of the strong flares were also associated with a proton event. Such was the case with NOAA 2975's first M-class flare (M4.0 on 28 March), resulting in a peak in the greater than 10 MeV proton flux of 18.7 pfu (https://www.stce.be/educational/acronym#P ). The other event reached 32.2 pfu and was associated with the long duration M3.9 flare on 2 April. There was also a small proton event that reached its maximum of 10.6 pfu early on 31 March. Though there may be a small contribution related to the X1.3 flare from the day before, it is more likely that this event was driven by the shock from the "cannibal CME" from 28 March. These are called "Energetic Storm Particles" (ESPs) and are accelerated at shocks associated with CMEs observed near Earth. ESPs can be detected several hours before the start of the geomagnetic storm (see e.g. Mäkelä et al. 2011 - https://agupubs.onlinelibrary.wiley.com/doi/full/10.1029/2011JA016683 ). In this case, a gradual rise was observed to start around 17 UT on 30 March and to reach its maximum around 06UT on 31 March, i.e. a few hours after the shock passage of the interplanetary CME. All 3 events rank only as minor solar radiation storms (S1) on the NOAA scale (https://www.swpc.noaa.gov/noaa-scales-explanation ).
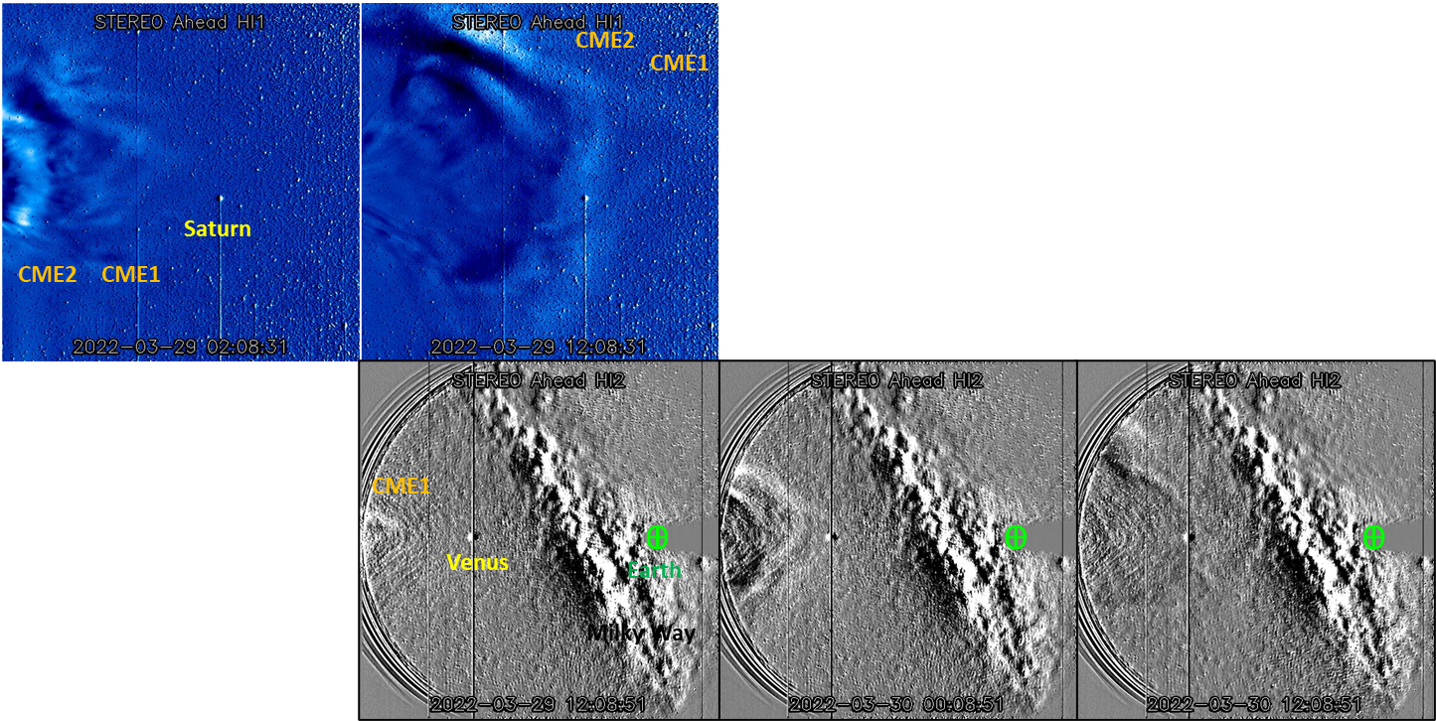
The propagation of the two CMEs produced by NOAA 2975 on 28 March, as discussed in a previous STCE news item (https://www.stce.be/news/580/welcome.html ), could be nicely tracked by the heliospheric imager (HI) on board the STEREO-A spacecraft (https://stereo-ssc.nascom.nasa.gov/beacon/ ). This instrument consists of two cameras, HI-1 and HI-2, which have 20 degrees and 70 degrees fields of view and are off-pointed from the Sun direction by 14.0 degrees and 53.7 degrees respectively, with their optical axes aligned in the ecliptic plane (situation sketch for 29 March in the online version). This arrangement allows the plane-of-the-sky observation of potentially earth-directed CMEs along the Sun–Earth line to the vicinity of the Earth and beyond (see Eyles et al. 2008, https://rd.springer.com/article/10.1007/s11207-008-9299-0 ). The annotated image underneath covers the period from early 29 March till noon 30 March, with in the top row the HI1 images and the bottom row containing the HI2 images. The 2nd column has HI1 and HI2 images at the same time, i.e. 29 March at 12:08UT. These images nicely show how the second, faster CME is gradually catching up with the preceding slower CME, but not entirely overtaking it.
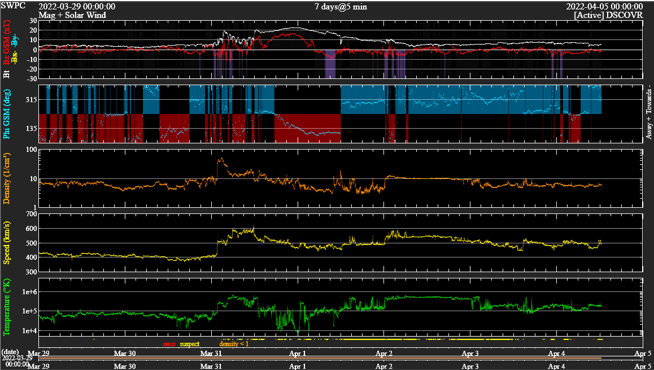
The arrival time of the resulting interplanetary CME structure (shock at 01:41UT on 31 March; DSCOVR - https://www.swpc.noaa.gov/products/real-time-solar-wind ) nicely corresponded with the predictions, but the intensity of the ensuing geomagnetic storm was rather disappointing, with only a minor storm (Kp=5) recorded in the Kp index instead of the anticipated Kp=7. Though the solar wind speed (yellow curve) lived up to expectations reaching 600 km/s, Bz (red curve) certainly did not (https://www.stce.be/educational/acronym#B ). Bz was only weakly negative and reached briefly -12 nT. That's way too low a value for creating a potent geomagnetic storm. As the solar activity is stil ramping up to its solar cycle maximum, future storms may be a lot stronger and leave a more distinct signature.
News from PITHIA-NRF
The Plasmasphere Ionosphere Thermosphere Integrated Research Environment and Access services: a Network of Research Facilities (PITHIA-NRF) has launched its first newsletter!
https://pithia-nrf.eu/pdf/pithia-nrf-newsletter-issue-1.pdf

You can subscribe. Just check at the bottom of the newsletter.
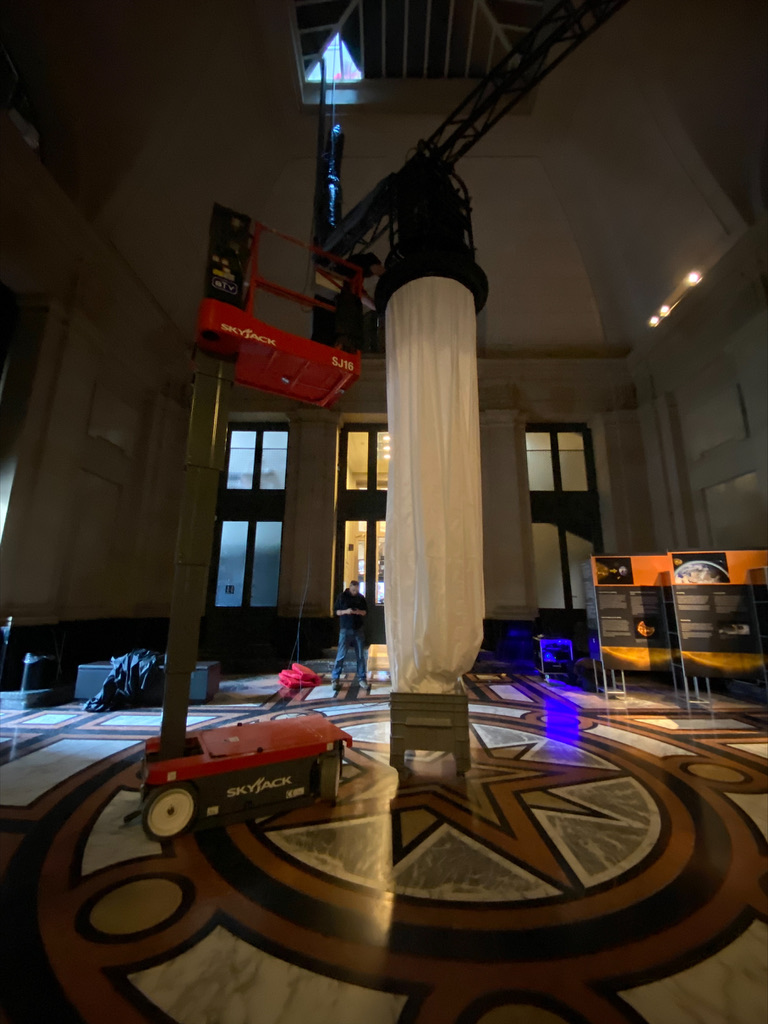
Time Lapse of SUN
SUN
05.04.2022 - 24.04.2022 at the AfricaMuseum: https://www.africamuseum.be/en
This extraordinary piece of light artwork was put together on April 1.
Check out the time lapse: https://www.stce.be/movies/SUN%20RMCA%20timelapse.mp4
Review of solar activity
Flares
Solar activity was moderate to high. Eleven Active Regions (ARs) were present. AR NOAA 2975, 2976, 2978 and 2981 were magnetically complex producing mainly C and M-class flares, while AR NOAA 2975, the most active region over the week, was the region of origin of an X1.3-class flare on 30 March 2022 with peak time 17:37UTC.
The events with the largest impact were, at the beginning of the week, a M4.0-class flare, peak time 28 March 2022 11:29UTC followed by a M1.0-class flare with peak time 19:23UTC, both from AR NOAA 2975. As AR NOAA 2975 became more complex in the middle of the week, it produced the X1.3-class flare on 30 March 2022 and a M9.5-class flare, peak time 31 March 18:35UTC. At the same time AR NOAA 2978 increased in complexity and was the source of eruptive events as well. By the end of the week, AR NOAA 2975 was the origin of a M3.9-class flare, peak time 2 April 13:55UTC.
Coronal Mass Ejections
The M4.0-class flare, peak time 28 March 11:29UTC, was associated with a CME which became visible on 28 March 12:00UTC. The M1.0-class flare, peak time 28 March 19:23UTC, was associated with a CME which became visible on 28 March 20:24UTC. The CMEs arrived on 31 March.
The X1.3-class flare on 30 March 2022 was associated with a CME seen in Stereo A Cor2 images on 30 March 18:23UTC. The possibility of an Earth-directed component was predicted low and a signature of arrival was not clear later in the solar conditions.
Solar particles near Earth
The greater than 10 MeV proton flux was above the 10pfu threshold on 31 March 06:20-07:25UTC (as a response to the M4.0-class flare, peak time 28 March 19:23UTC), 2 April 14:30-22:50 UTC (as a response to ICME arrival) and 3 April 00:05-00:10 UTC (as a response to the M3.4-class flare, peak time 2 April 13:55UTC).
The greater than 2MeV electron flux crossed the 1000 pfu threshold on 3 April 09:20-23:15 UTC.
The electron fluence was at nominal levels until 3 April 2022, when it rose to moderate levels.
Review of geomagnetic activity
Two ICMEs arrived to the Earth on 31 March 2022. A shock-like structure has been detected by DSCOVR and ACE on 31 March around 01:41UTC. The magnetic field reached 23 nT, with Bz reaching -13 nT, the solar wind speed peaked at 630 km/s. The ICME impact combined with a High Speed Stream (HSS) on 2 April, causing an isolated period of minor storm conditions on 2 April 03:00-06:00UTC (Kp=5). The HSS emanated from a negative polarity southern and equatorial coronal hole present at central meridian on 29-30 March.
At the beginning of the week, HSS influences led to active conditions, before dropping to quiet by 29 March. The ICMEs arrival on 31 March in combination with the HSS associated with the CH present at central meridian on 29-30 March caused minor storm conditions with Kp reaching 5. The effects could be seen until the end of the period.
PROBA2 Observations (28 Mar 2022 - 3 Apr 2022)
Solar Activity
Solar flare activity fluctuated between low and high during the week.
In order to view the activity of this week in more detail, we suggest to go to the following website from which all the daily (normal and difference) movies can be accessed: https://proba2.oma.be/ssa
This page also lists the recorded flaring events.
A weekly overview movie can be found here (SWAP week 627): https://proba2.sidc.be/swap/data/mpg/movies/weekly_movies/weekly_movie_2022_03_28.mp4
Details about some of this week's events can be found further below.
If any of the linked movies are unavailable they can be found in the P2SC movie repository here:
https://proba2.oma.be/swap/data/mpg/movies/
Wednesday Mar 30
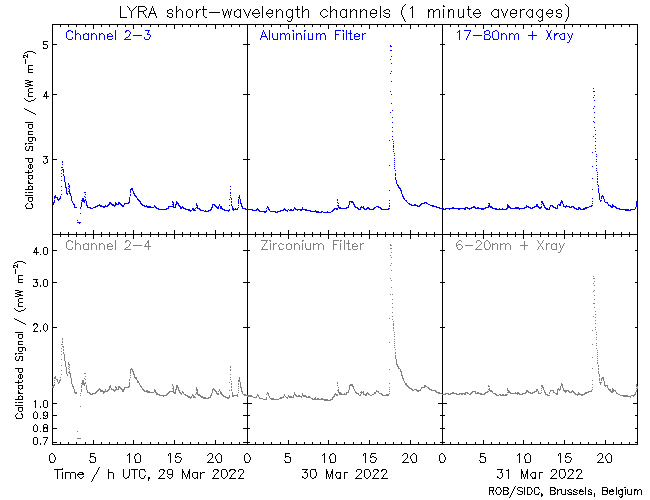
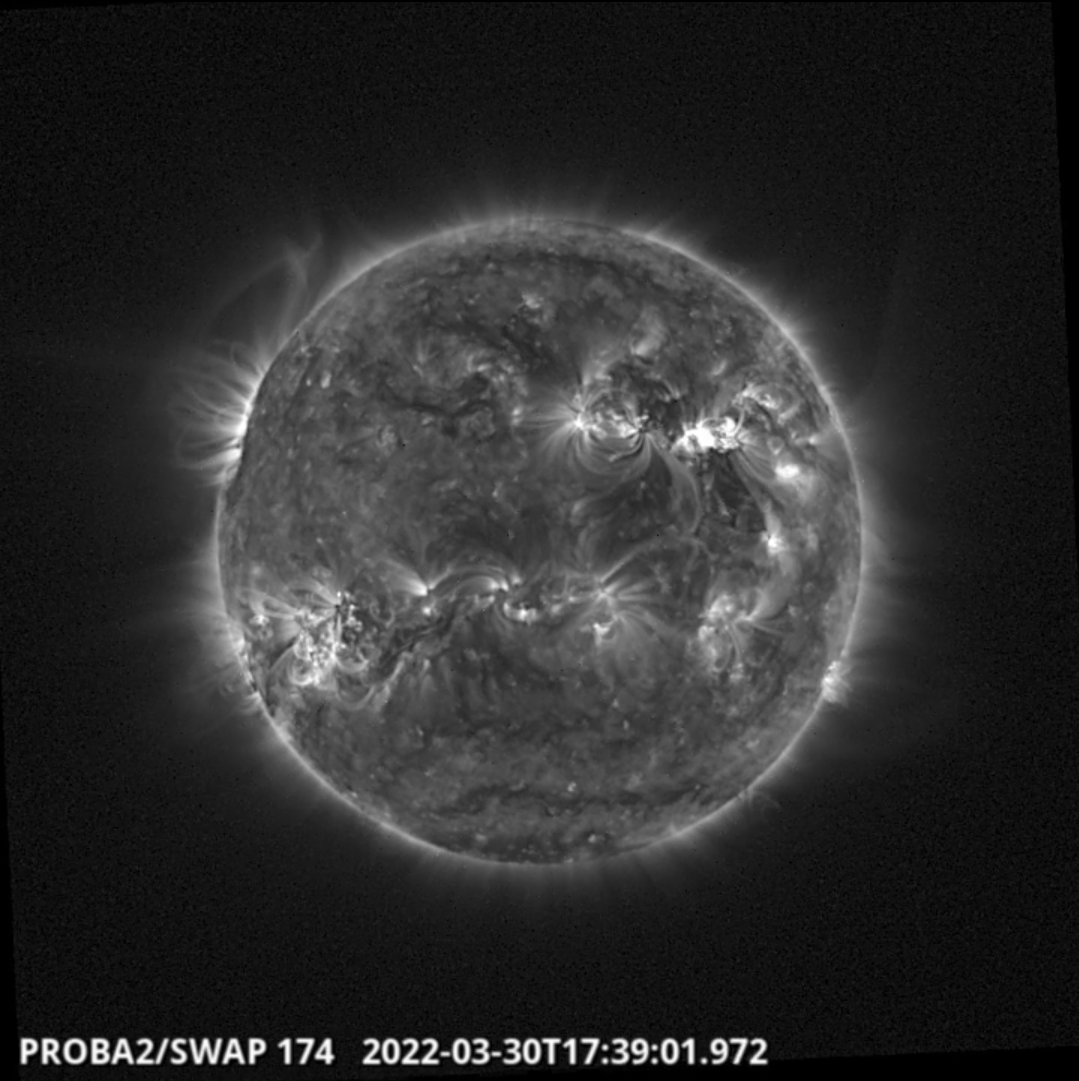
The largest flare of the week, an X1.3 flare, was observed by SWAP and LYRA. The flare is visible in the north-west quadrant on 2022-Mar-30, as shown in the SWAP image above taken at 17:39 UT.
Find a movie of the event here (SWAP movie)
: https://proba2.sidc.be/swap/movies/20220330_swap_movie.mp4
The International Sunspot Index by SILSO
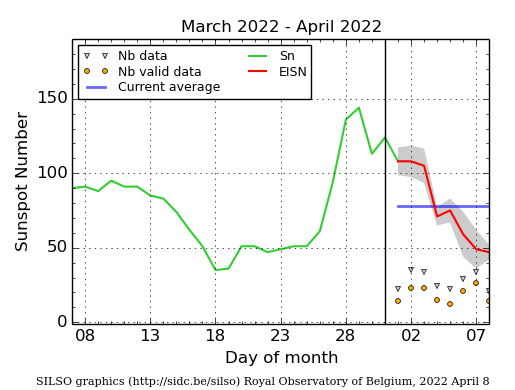
The daily Estimated International Sunspot Number (EISN, red curve with shaded error) derived by a simplified method from real-time data from the worldwide SILSO network. It extends the official Sunspot Number from the full processing of the preceding month (green line), a few days more than one solar rotation. The horizontal blue line shows the current monthly average. The yellow dots give the number of stations that provided valid data. Valid data are used to calculate the EISN. The triangle gives the number of stations providing data. When a triangle and a yellow dot coincide, it means that all the data is used to calculate the EISN of that day.
Noticeable Solar Events (28 Mar 2022 - 3 Apr 2022)
| DAY | BEGIN | MAX | END | LOC | XRAY | OP | 10CM | TYPE | Cat | NOAA |
| 28 | 1058 | 1129 | 1145 | M4.0 | II/3IV/2 | 64 | 2975 | |||
| 28 | 1732 | 1741 | 1747 | M1.0 | 46 | 64 | 2975 | |||
| 28 | 1908 | 1923 | 1940 | M1.0 | 64 | 2975 | ||||
| 28 | 2049 | 2059 | 2109 | N14W11 | M1.1 | SN | 64 | 2975 | ||
| 29 | 0057 | 0111 | 0126 | N16W10 | M2.2 | 2N | CTM/1 | 64 | 2975 | |
| 29 | 0148 | 0158 | 0203 | S19W13 | M1.1 | SF | 19 | III/2 | 63 | 2974 |
| 29 | 0917 | 0938 | 0955 | M1.0 | VI/2III/2 | |||||
| 29 | 2143 | 2152 | 2157 | M1.6 | CTM/1 | 64 | 2975 | |||
| 30 | 1721 | 1737 | 1746 | X1.3 | 540 | II/3IV/1III/2 | 64 | 2975 | ||
| 31 | 1817 | 1835 | 1845 | N13W47 | M9.6 | 1B | 700 | II/2IV/1 | 64 | 2975 |
| 02 | 0239 | 0256 | 0307 | M2.9 | III/2 | 64 | 2975 | |||
| 02 | 1256 | 1355 | 1444 | N15W61 | M3.9 | SN | II/2 | 65 | 2976 | |
| 02 | 1734 | 1744 | 1751 | N14W78 | M4.3 | 1N | 110 | 64 | 2975 |
| LOC: approximate heliographic location | TYPE: radio burst type |
| XRAY: X-ray flare class | Cat: Catania sunspot group number |
| OP: optical flare class | NOAA: NOAA active region number |
| 10CM: peak 10 cm radio flux |
Geomagnetic Observations in Belgium (28 Mar 2022 - 3 Apr 2022)
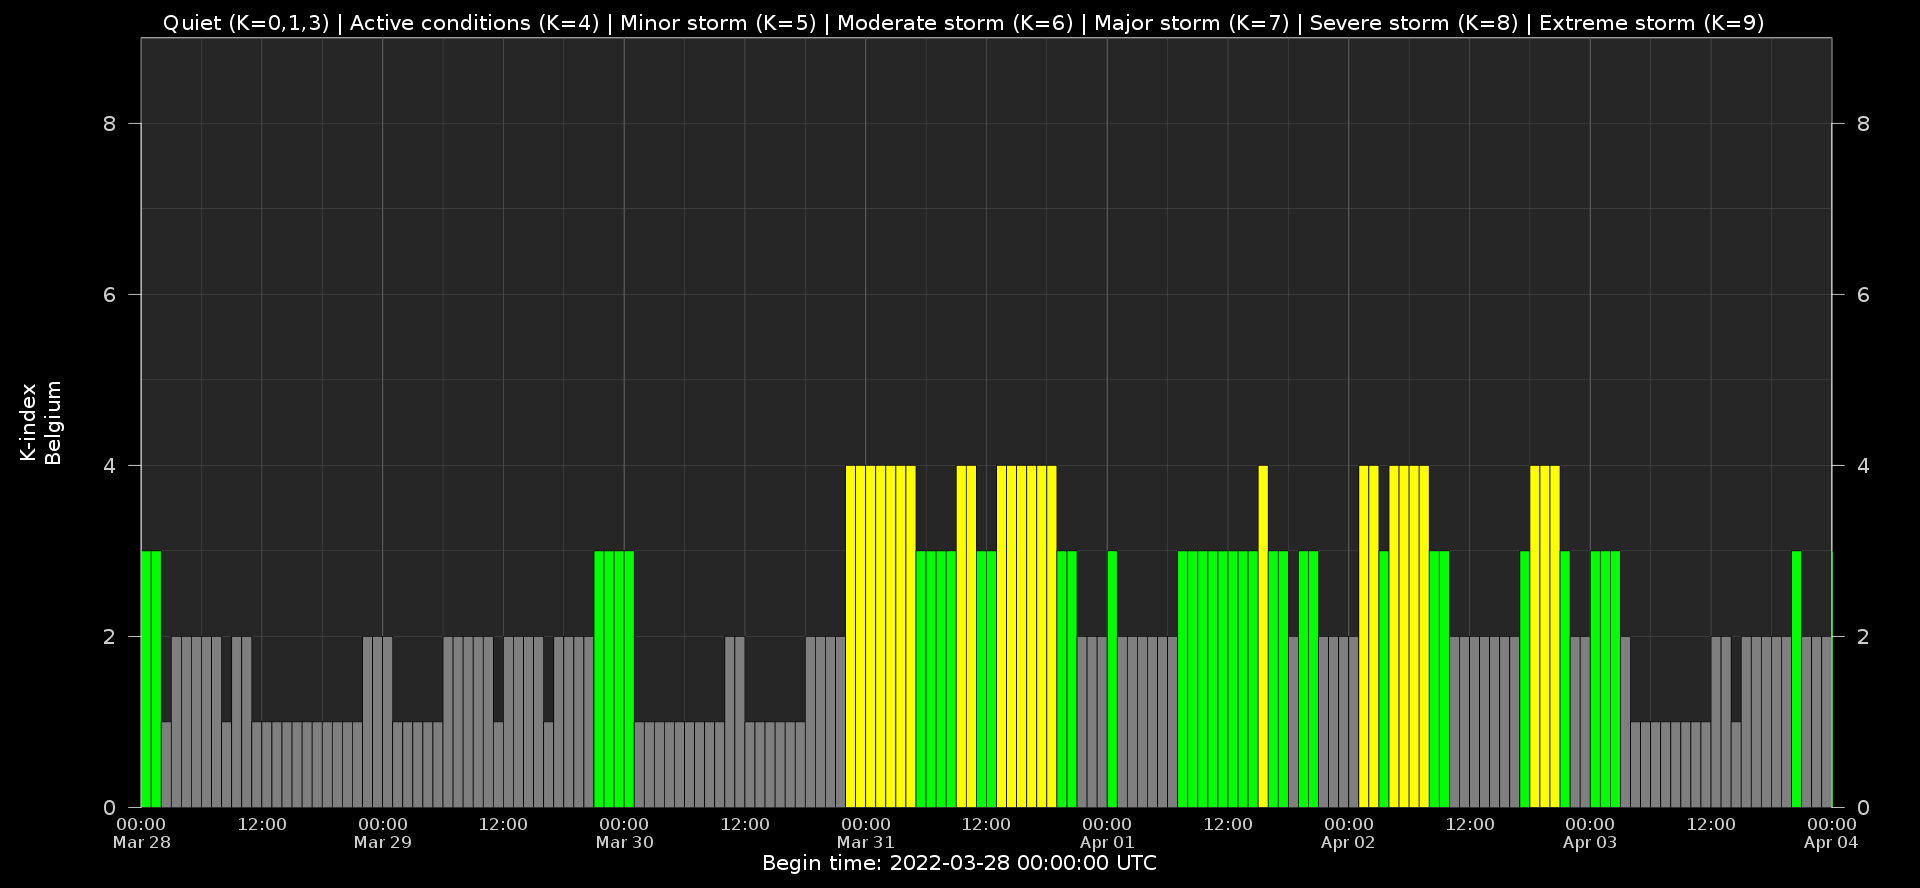
Local K-type magnetic activity index for Belgium based on data from Dourbes (DOU) and Manhay (MAB). Comparing the data from both measurement stations allows to reliably remove outliers from the magnetic data. At the same time the operational service availability is improved: whenever data from one observatory is not available, the single-station index obtained from the other can be used as a fallback system.
Both the two-station index and the single station indices are available here: http://ionosphere.meteo.be/geomagnetism/K_BEL/
The SIDC Space Weather Briefing
The forecaster on duty presented a space weather overview from March 27 to April 3. The pdf and amazing movies can be found in: https://www.stce.be/briefings/20220408/
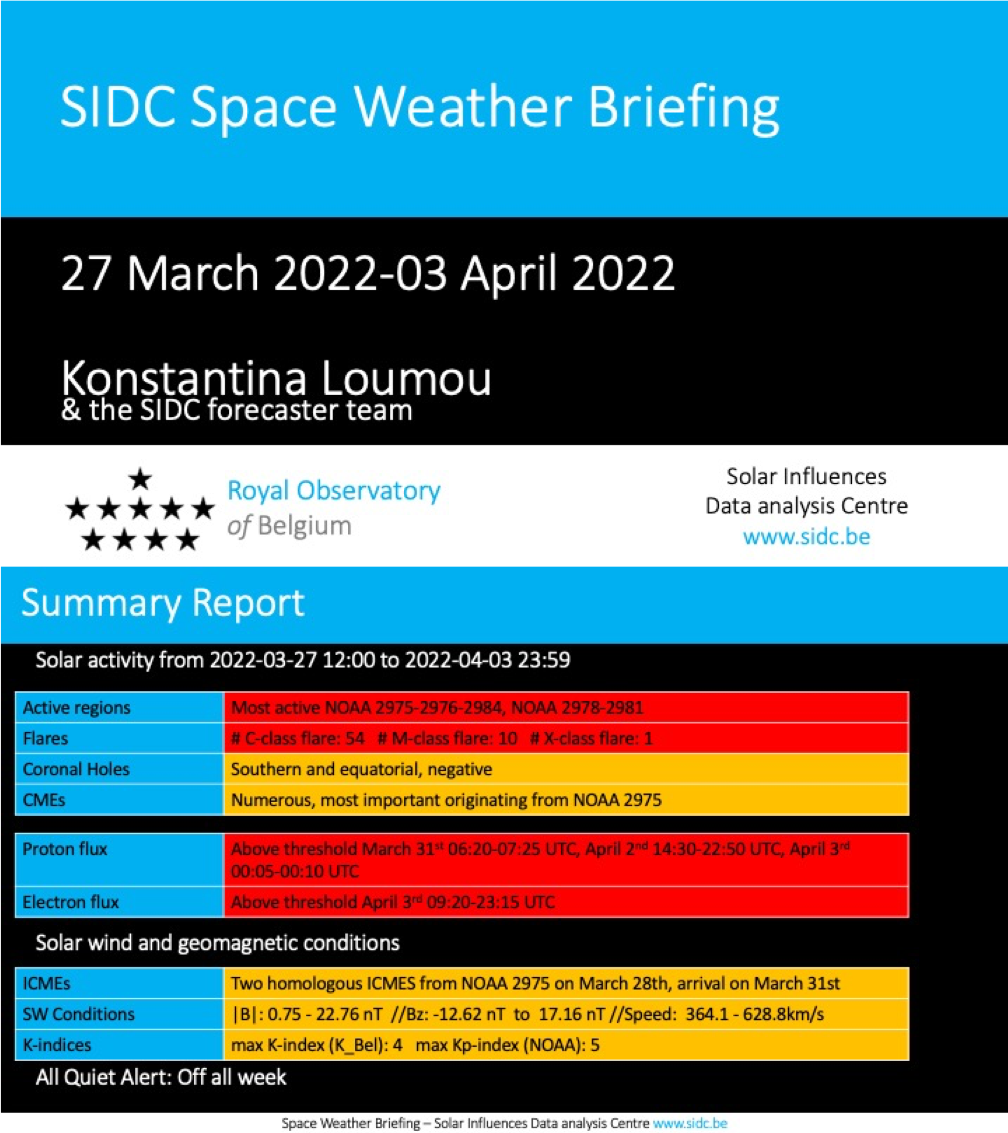
The colours say enough.
Review of ionospheric activity (28 Mar 2022 - 3 Apr 2022)
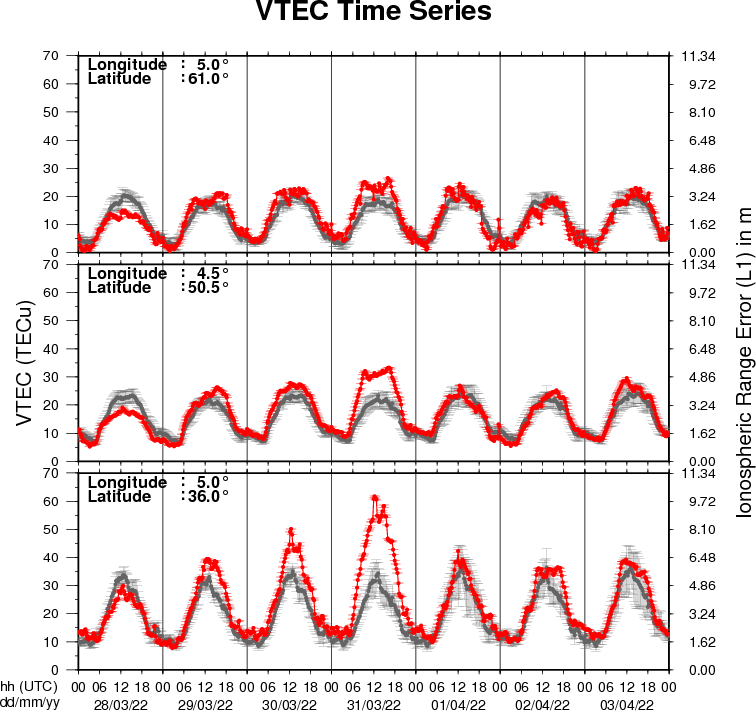
The figure shows the time evolution of the Vertical Total Electron Content (VTEC) (in red) during the last week at three locations:
a) in the northern part of Europe(N 61deg E 5deg)
b) above Brussels(N 50.5deg, E 4.5 deg)
c) in the southern part of Europe(N 36 deg, E 5deg)
This figure also shows (in grey) the normal ionospheric behaviour expected based on the median VTEC from the 15 previous days.
The VTEC is expressed in TECu (with TECu=10^16 electrons per square meter) and is directly related to the signal propagation delay due to the ionosphere (in figure: delay on GPS L1 frequency).
The Sun's radiation ionizes the Earth's upper atmosphere, the ionosphere, located from about 60km to 1000km above the Earth's surface.The ionization process in the ionosphere produces ions and free electrons. These electrons perturb the propagation of the GNSS (Global Navigation Satellite System) signals by inducing a so-called ionospheric delay.
See http://stce.be/newsletter/GNSS_final.pdf for some more explanations ; for detailed information, see http://gnss.be/ionosphere_tutorial.php
Action!
Check out our activity calendar: activities and encounters with the Sun-Space-Earth system and Space Weather as the main theme. We provide occasions to get submerged in our world through educational, informative and instructive activities.
If you want your event in our calendar, contact us: stce_coordination at stce.be
* April 5-24, SUN exhibit at the AfricaMuseum, Tervuren, belgium
* April 22, Workshop PromOptica - Electromagnetic Radiation Sensors, Royal Observatory of Belgium, Brussels, Belgium
* April 26, Public Lecture on the Solar Corona in EUV (Dutch), Urania, Hove, Belgium
* April 27-29, STCE at the Symposium on Space Educational Activities, Barcelona, Spain
* April 28, Public Lecture on SolO/EUI, Astropolis, Oostende, Belgium
* July 3, Public Lecture on ROB's mission to the Sun, Cosmodrome, Genk, Belgium
* August 25, Public Lecture on Space Weather and Aviation, Astropolis, Oostende, Belgium
* October 24-28, 18th European Space Weather Week, Zagreb, Croatia
Check: https://www.stce.be/calendar