
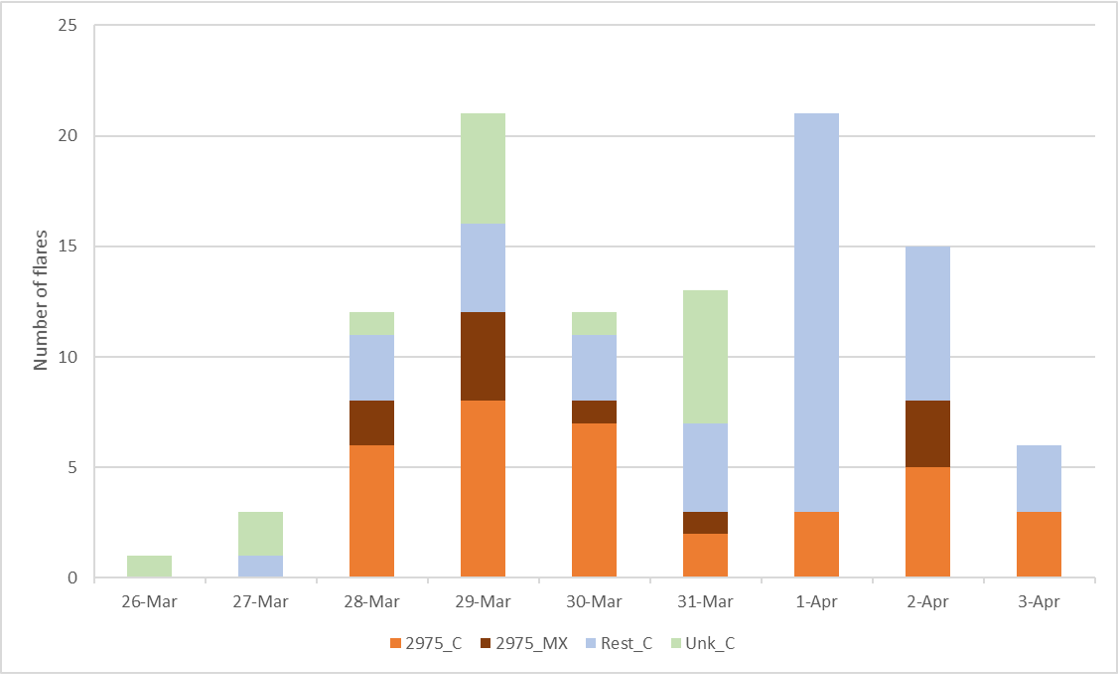
NOAA 2975 kept the space weather forecasters quite busy last week. This complex active region produced one third of all the C-class flares, and was the source of all 10 M-class flares as well as the sole X-class event on 30 March. Underneath is an overview of the solar flare production covering the period 26 March - 03 April. NOAA 2975 started to develop late on 27 March, and was already producing M-class flares a day later. According to the NOAA/GOES data, NOAA 2975 produced about two thirds of its flares during the 28-30 March timeframe, culminating in the X1 flare on 30 March (peak at 17:37UT). Flare production then decreased somewhat, while two closely-spaced active regions in the southern hemisphere (NOAA 2978/2981) took over the C-class flare generation, coinciding with the emergence of numerous small spots in their intermediate portion. Then, on 2 April, NOAA 2975 resumed flare production as a result of interactions with the main spot of nearby NOAA 2976 and the newly emerged sunspot region NOAA 2984.
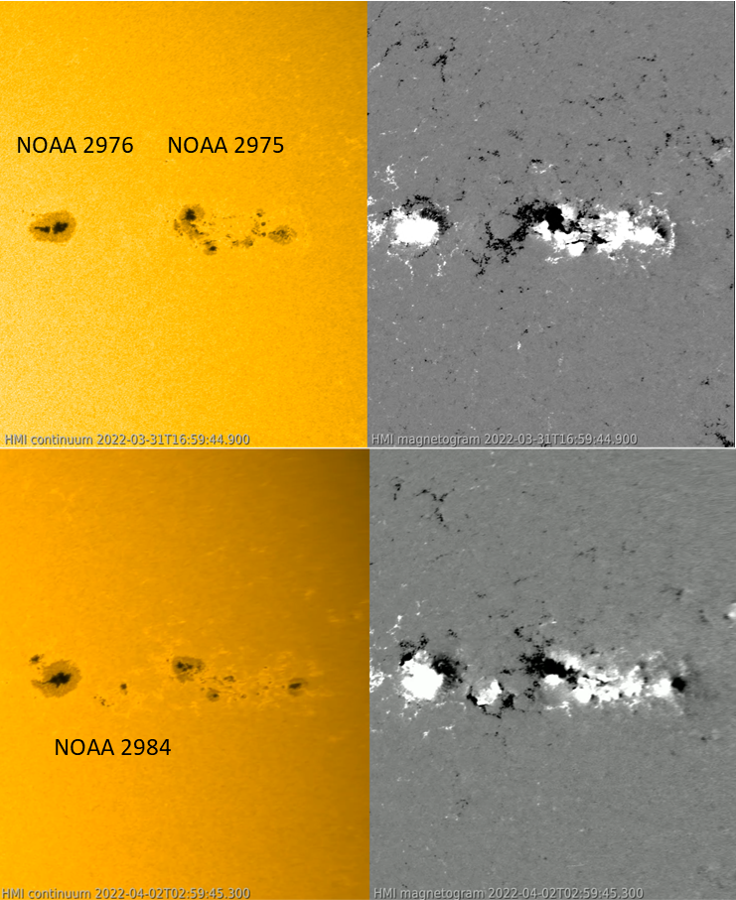
The evolution of NOAA 2975 can be seen in the imagery underneath in white light images (left) and in the magnetograms (right) as obtained by the SDO/HMI instrument. White and black denote opposite magnetic polarity (resp. "positive" and "negative"). Dates are 31 March and 2 April (annotated image). The associated clip was created using SWHV. Instead of letting the regions move through the field of view, SWHV was set up in this case such that it seems to keep hovering right above NOAA 2975, thus allowing for a better view on its evolution. The image "distortions" at the end of the clip are due to the west solar limb approaching.

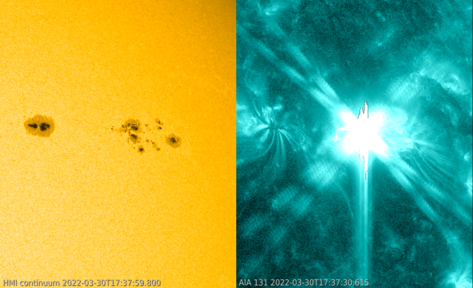
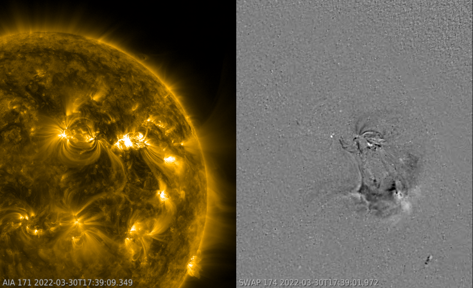
The X1 flare took place in the trailing portion of NOAA 2975, as shown in the white light (left) and extreme ultraviolet (EUV) images (image) taken by SDO instruments at the timing of the soft x-rays peak. It was associated with a coronal wave (see the STCE news item for more info) as shown in the PROBA2/SWAP difference imagery (image), i.e. one image subtracted from the next. A coronal mass ejection (CME) was associated with this eruption, but although it seemed to have an earth-directed component, no obvious signature of it was detected in the solar wind parameters near Earth during the subsequent days.

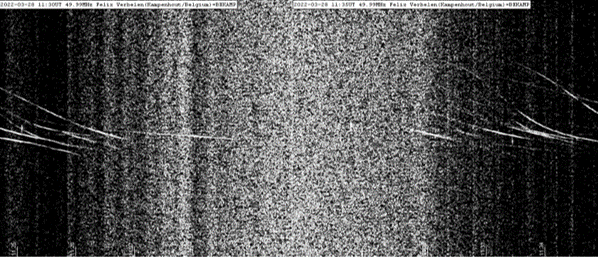
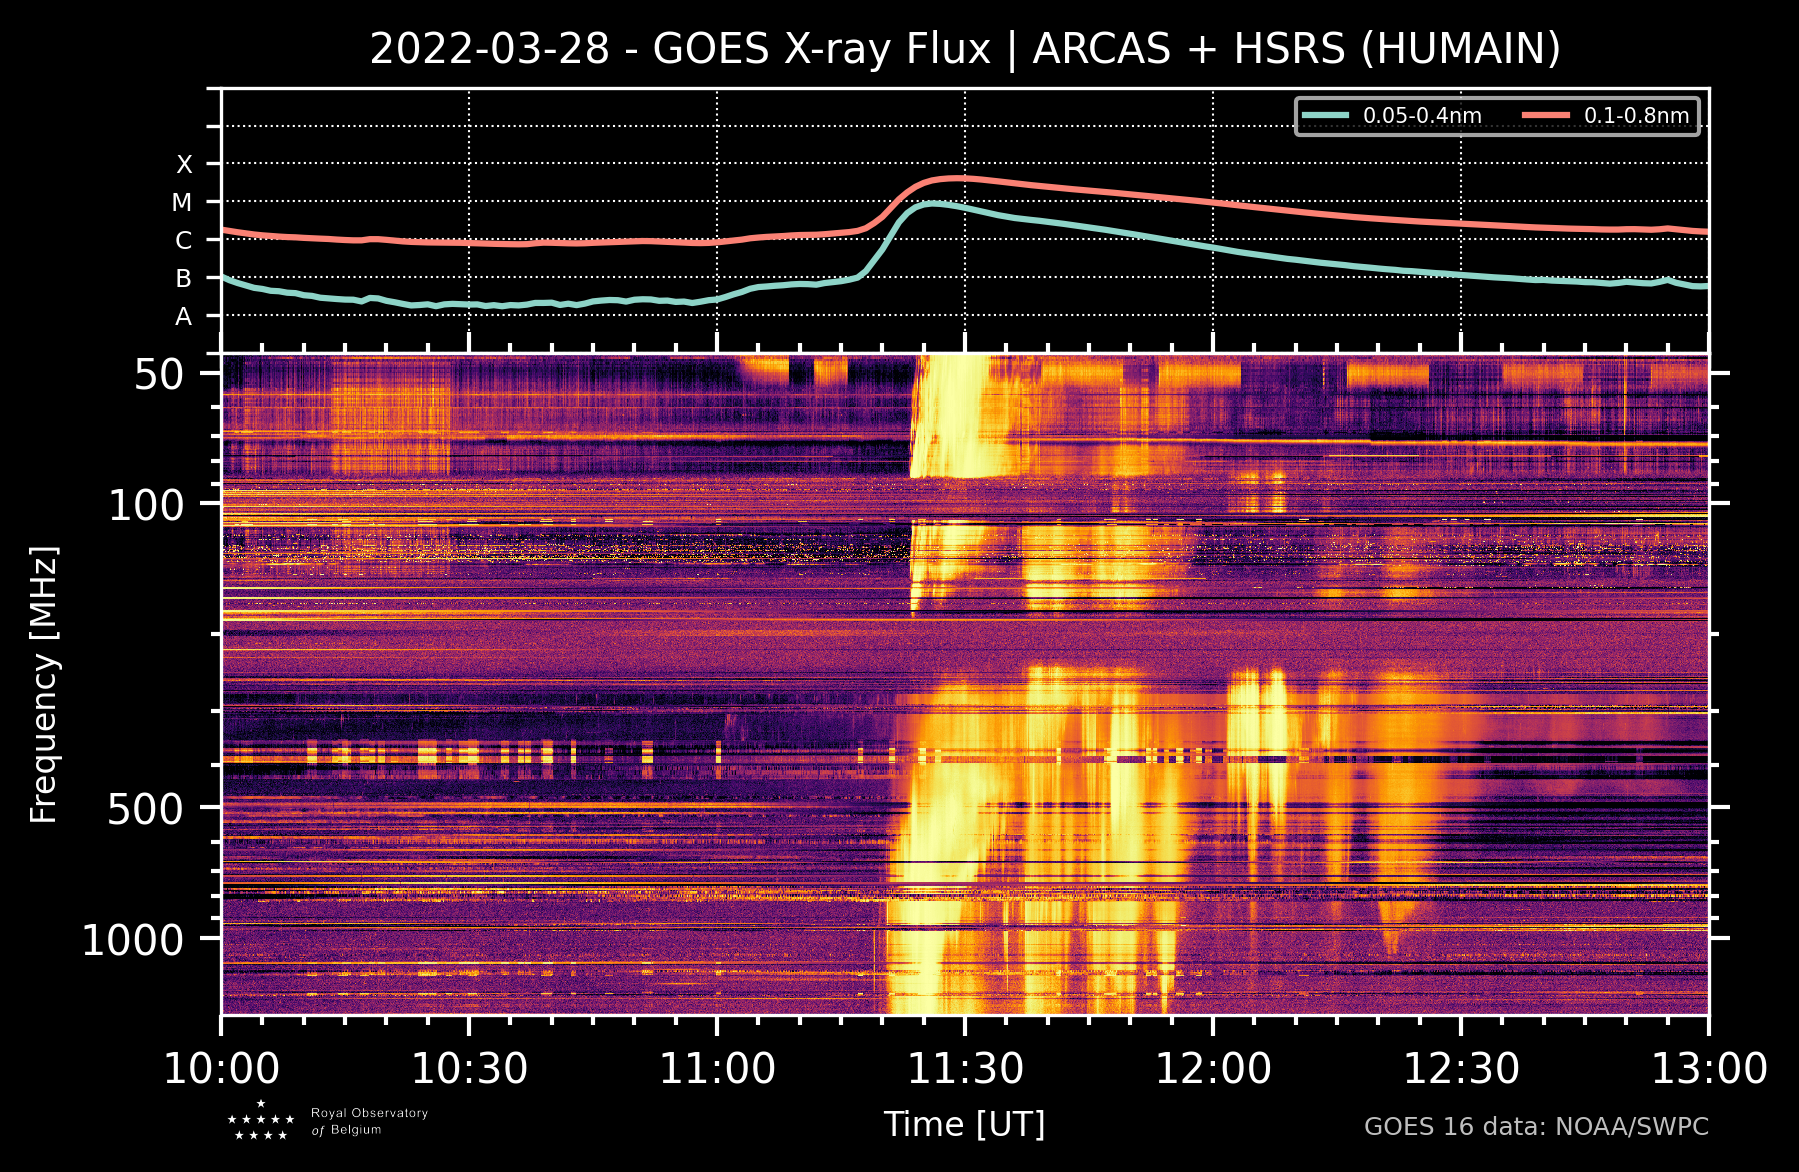
All this extra x-ray radiation energized the ionosphere, a layer of charged particles in the Earth's atmosphere that influences radio communication (HF Com - 3-30 MHz) and satellite-based communication and navigation. Meteor observers using radio equipment were also not very happy with all this flaring activity from last week. Indeed, the radio emission associated with these flares occasionally interfered with the radio frequencies used for radio meteor detection extra radiation disturbed the ionosphere at the frequencies observed (here around 49 MHz), and so no reflected signal from meteors could be recorded. The attached graph (Credits Felix Verbelen from the BRAMS network) runs from 11:25UT until 11:35UT and shows a lot of noise between 11:26 and 11:32UT on 28 March, coinciding with the radio emission around the time of the peak of the M4 flare (11:29UT). This can be seen in this radiospectrogram recorded by the radio station at Humain Belgium, showing the influence of a Type II radio burst around 11:30UT. See the STCE clip (03:19-05:39) for more info on meteor detection using radio-equipment, and this STCE news item for an annotated radiospectrogram. In the case of the M4 flare, the disturbed ionosphere associated radio emission did not permit meteor observations for about 6 minutes. The radio observers did report several of these short radio black-outs disturbances during last week's elevated solar activity.
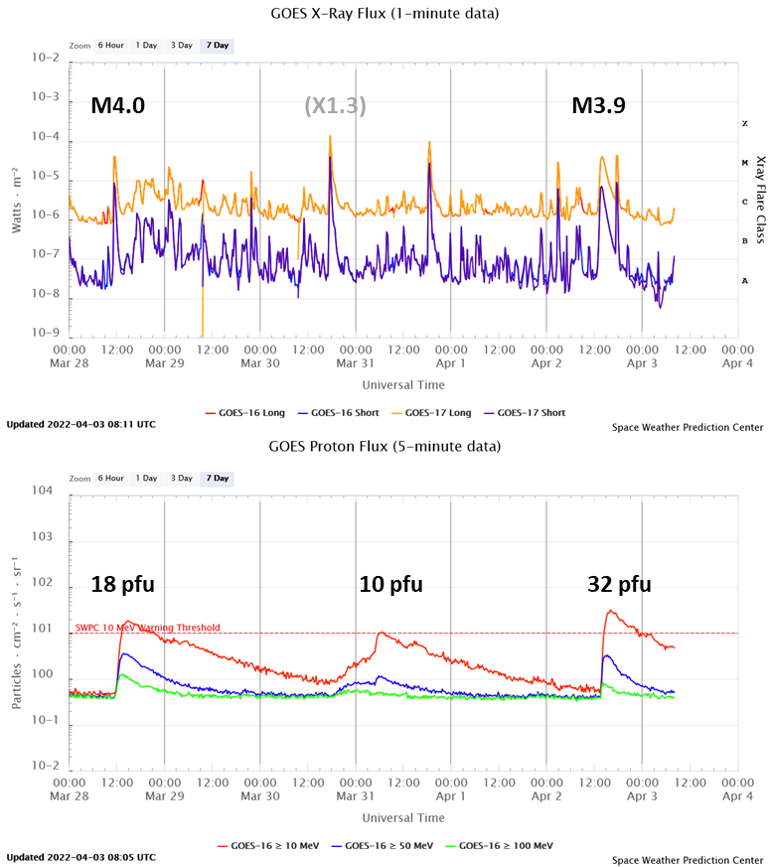
Some of the strong flares were also associated with a proton event. Such was the case with NOAA 2975's first M-class flare (M4.0 on 28 March), resulting in a peak in the greater than 10 MeV proton flux of 18.7 pfu. The other event reached 32.2 pfu and was associated with the long duration M3.9 flare on 2 April. There was also a small proton event that reached its maximum of 10.6 pfu early on 31 March. Though there may be a small contribution related to the X1.3 flare from the day before, it is more likely that this event was driven by the shock from the "cannibal CME" from 28 March. These are called "Energetic Storm Particles" (ESPs) and are accelerated at shocks associated with CMEs observed near Earth. ESPs can be detected several hours before the start of the geomagnetic storm (see e.g. Mäkelä et al. 2011). In this case, a gradual rise was observed to start around 17 UT on 30 March and to reach its maximum around 06UT on 31 March, i.e. a few hours after the shock passage of the interplanetary CME. All 3 events rank only as minor solar radiation storms (S1) on the NOAA scale.
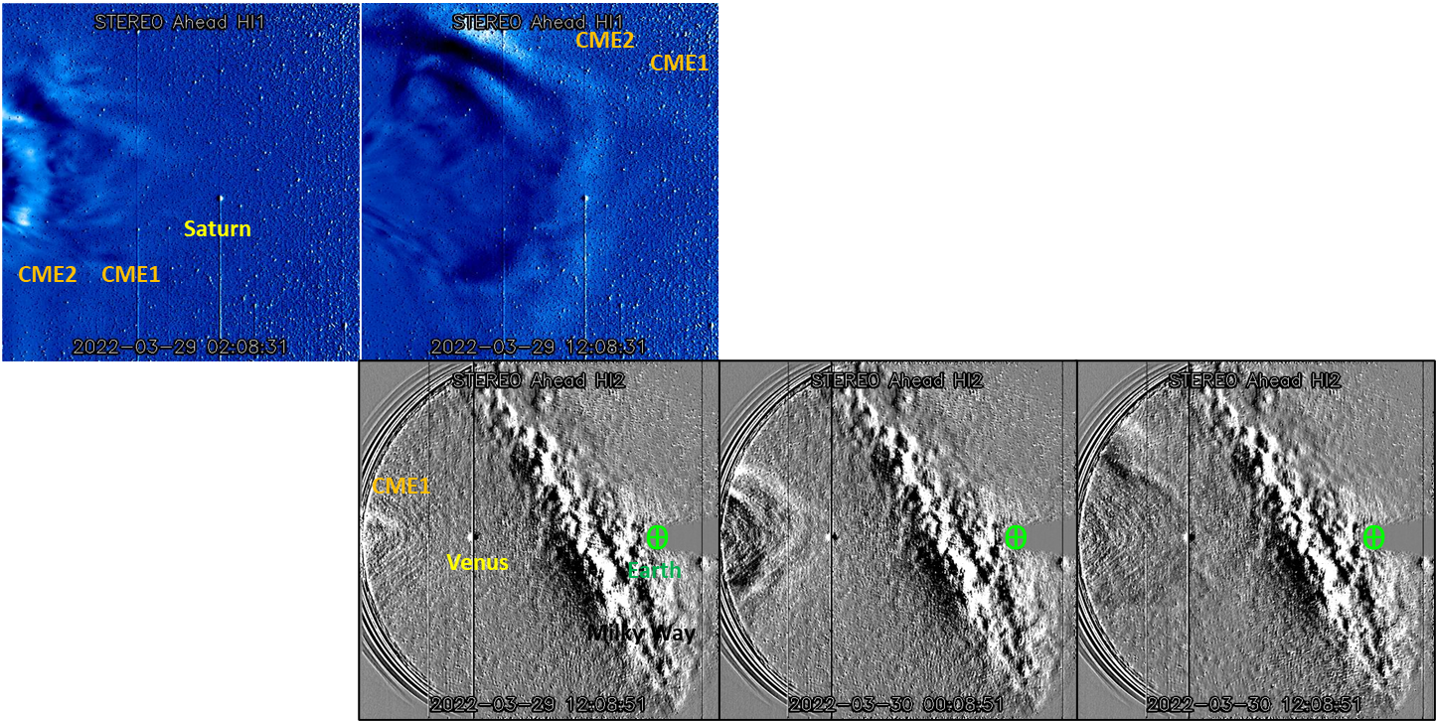
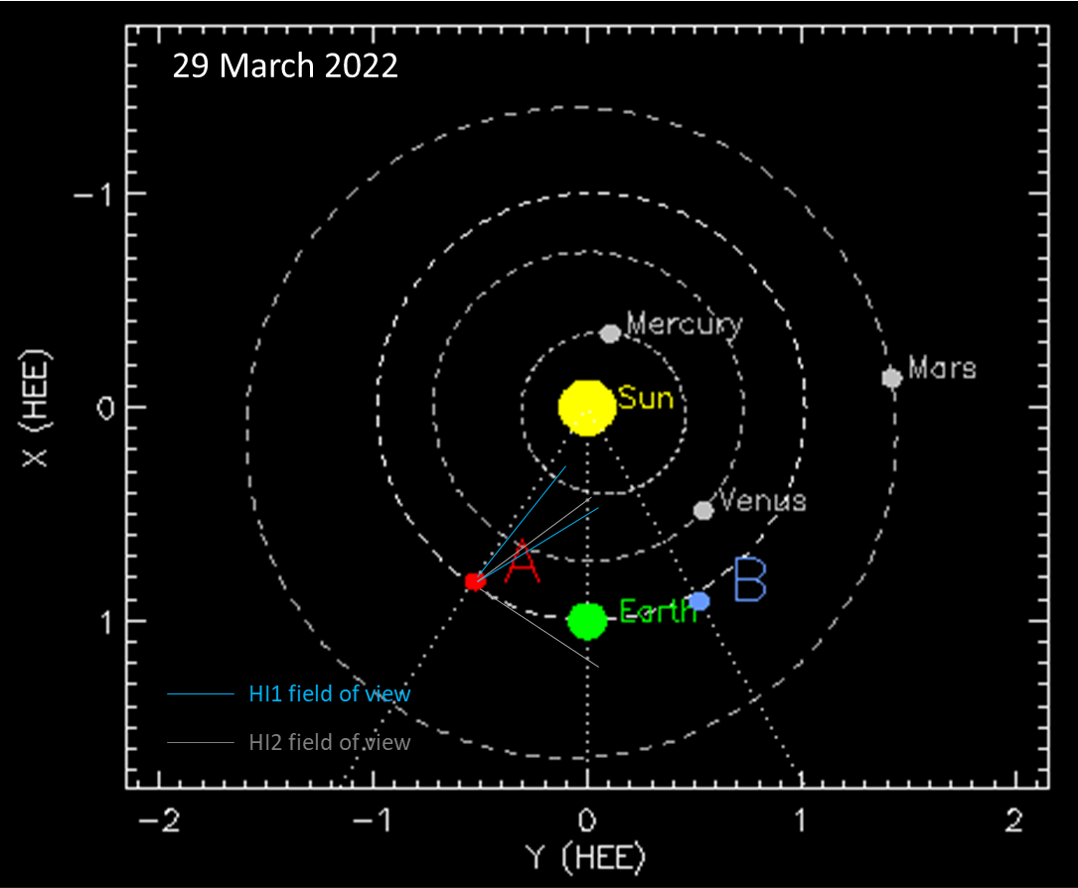
The propagation of the two CMEs produced by NOAA 2975 on 28 March, as discussed in a previous STCE news item, could be nicely tracked by the heliospheric imager (HI) on board the STEREO-A spacecraft. This instrument consists of two cameras, HI-1 and HI-2, which have 20 degrees and 70 degrees fields of view and are off-pointed from the Sun direction by 14.0 degrees and 53.7 degrees respectively, with their optical axes aligned in the ecliptic plane (situation sketch for 29 March). This arrangement allows the plane-of-the-sky observation of potentially earth-directed CMEs along the Sun–Earth line to the vicinity of the Earth and beyond (see Eyles et al. 2008). The annotated image underneath covers the period from early 29 March till noon 30 March, with in the top row the HI1 images and the bottom row containing the HI2 images. The 2nd column has HI1 and HI2 images at the same time, i.e. 29 March at 12:08UT. These images nicely show how the second, faster CME is gradually catching up with the preceding slower CME, but not entirely overtaking it.
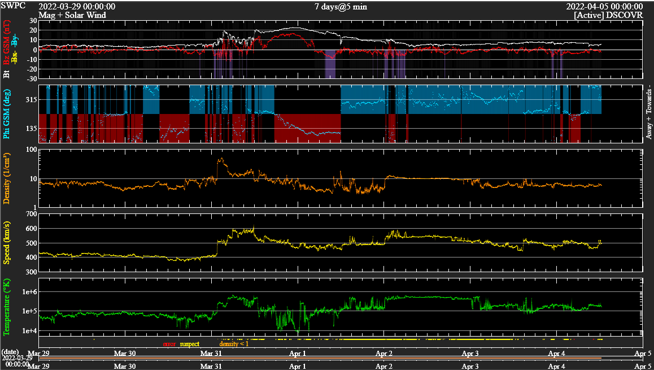
The arrival time of the resulting interplanetary CME structure (shock at 01:41UT on 31 March; DSCOVR) nicely corresponded with the predictions, but the intensity of the ensuing geomagnetic storm was rather disappointing, with only a minor storm (Kp=5) recorded in the Kp index instead of the anticipated Kp=7. Though the solar wind speed (yellow curve) lived up to expectations reaching 600 km/s, Bz (red curve) certainly did not. Bz was only weakly negative and reached briefly -12 nT. That's way too low a value for creating a potent geomagnetic storm. As the solar activity is stil ramping up to its solar cycle maximum, future storms may be a lot stronger and leave a more distinct signature.
