- Table of Content
- 1.The latest sun...
- 2.Congratulation...
- 3.Save the date:...
- 4.Review of sola...
- 5.Review of geom...
- 6.PROBA2 Observa...
- 7.International ...
- 8.Geomagnetic Ob...
- 9.The SIDC Space...
- 10.Action!
2. Congratulations, Dr Talpeanu!
3. Save the date: Open Days
4. Review of solar activity
5. Review of geomagnetic activity
6. PROBA2 Observations
7. International Sunspot Number by SILSO
8. Geomagnetic Observations in Belgium
9. The SIDC Space Weather Briefing
10. Action!
The latest sunspot numbers
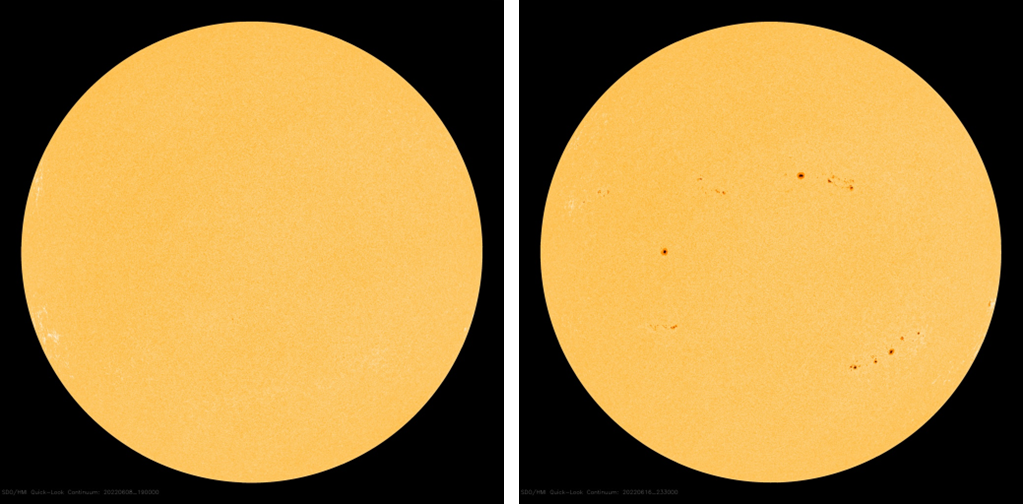
SILSO, the Sunspot Index and Long-term Solar Observations (https://www.sidc.be/silso/ ), has issued its most recent sunspot bulletin. These bulletins can be downloaded at https://www.sidc.be/silso/sunspotbulletin or you can register to receive these and other reports by mail (http://www.sidc.be/registration/registration_step1.php ). For June, the provisional monthly mean International Sunspot Number (ISN) was 70.6, down from the 96.5 May value. The highest daily sunspot numbers were recorded on the 16th and 17th (both 151), and the lowest was a meager 4 on June, 8th. This was the lowest daily ISN since 11 December 2021, when it was 0 thus marking the last spotless day so far (https://www.sidc.be/silso/spotless ). Underneath a comparison highlighting the different outlook of the solar disk on 8 and 16 June (white light, SDO/HMI, https://sdo.gsfc.nasa.gov/data/aiahmi/ ).
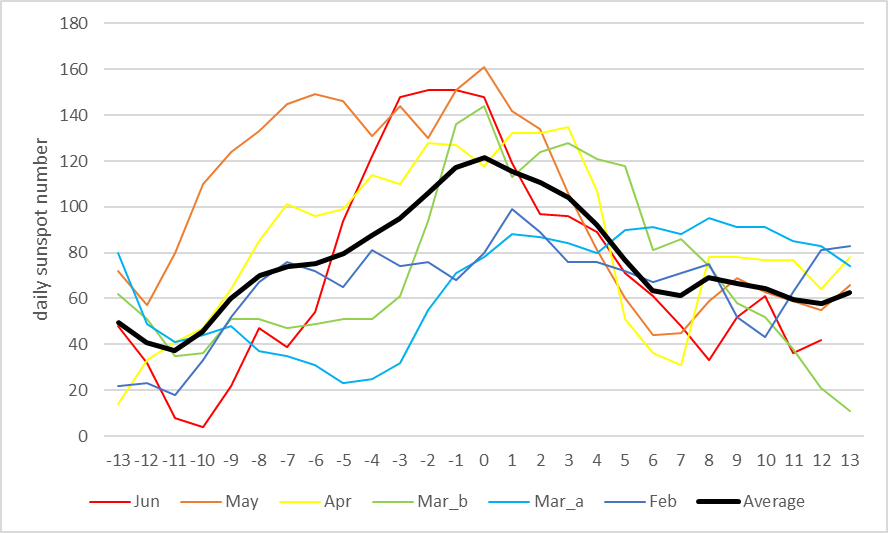
The period with high sunspot numbers is following remarkably well the 27-days solar rotation. Indeed, give or take a few days, the highest sunspot numbers for each solar rotation were around 3 February, 2 March, 29 March, 15 April, 22 May (161) and 18 June. This can be seen in the graph underneath showing the daily sunspot number from 2 weeks before to 2 weeks after the aforementioned dates (all brought back to day "0" on the horizontal axis). The curves with older sunspot numbers are in bluish, the more recent ones are in reddish. The average of the 6 rotations has been marked by a thick black line. An elevated sunspot number can be seen around day "0" for each of the rotations. The activity changes within the groups and the emergence and disappearance of sunspot groups (often short-lived) add to the variation outside the period of peak sunspot numbers.
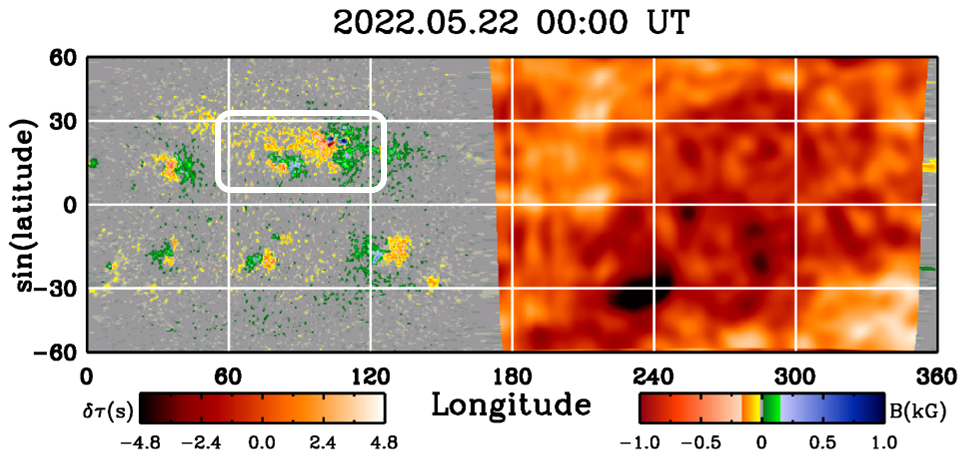
Being so closely tied to the solar rotation, the waxing and waning of the sunspot numbers has usually something to do with long-lasting active regions. As it turns out, the synoptic maps available at Stanford's TimeD webpage (http://jsoc.stanford.edu/data/timed/ ) show such an active patch on the solar disk between solar longitudes 60 and 120 degrees and latitudes 15 and 30 degrees, as shown in the annotated image below. The colored greyish portion of the map is what is observed by SDO/HMI, whereas the orangish portion of the map is a farside image based on helioseismological results (see the STCE newsitem at https://www.stce.be/news/575/welcome.html and https://www.stce.be/news/583/welcome.html ). These maps indicate the area started to emerge during the second half of January. Numerous, different sunspot regions have developed inside this 60-degrees wide patch with no less than 36 M-class and 3 X-class flares originating from it alone since late March. The online version of this newsitem (https://www.stce.be/news/598/welcome.html ) contains an animation showing the location and evolution of this active area on the Sun, clearly revealing the emergence and dissipation of different active regions within it. Eventually though, this active area on the Sun will disappear.
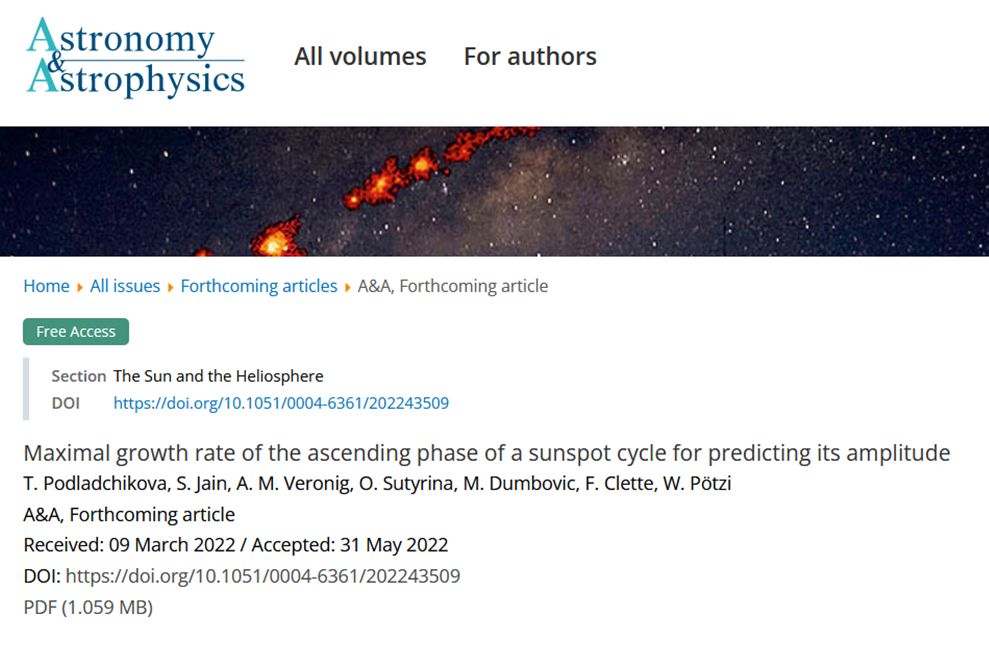
Meanwhile, a team of researchers that included Frédéric Clette (lead scientist of SILSO), have scrutinized all the available sunspot numbers and sunspot areas. They showed, amongst other results, that the maximal growth rate of sunspot activity in the ascending phase of a solar cycle can serve as a reliable prediction of the subsequent cycle amplitude. With the available 13-month smoothed sunspot data till October 2021 of the rising phase of ongoing cycle 25, they derived as a lower estimate of its amplitude a value of 110+/-26, in line with other predictions (see the STCE's Solar Cycle Tracking page at https://www.stce.be/content/sc25-tracking#sunspot ). Similar results were obtained using hemispheric sunspot numbers and areas. They further adapted their prediction technique for real-time application, so we'll certainly have updated predictions from this method in the near future, based then on the enhanced sunspot activity of the last few months. Their work has been accepted for publication in Astronomy and Astrophysics (Podladchikova et al., 2022 - https://doi.org/10.1051/0004-6361/202243509 ).
Congratulations, Dr Talpeanu!
.png)
On 20 June, 2022 Dana-Camelia Talpeanu successfully defended her PhD thesis 'Numerical and Observational Study of Stealth and Consecutive Coronal Mass Ejections'. Her work was a joint project between the Royal Observatory of Belgium and the KU Leuven.
Her study combines observational and numerical methods to investigate stealth and consecutive CMEs. She worked to determine the processes that trigger them, their geomagnetic effects and how they differ from more typical solar eruptions, in order to improve the forecasts of their geoeffectiveness. Stealth CMEs are very difficult to predict as they don�t leave clear coronal signatures that indicate the source region.
Another important research avenue was the interaction of the CMEs with different background solar winds and with other CMEs that may affect their propagation in interplanetary space and towards Earth. Dr. Talpeanu studied these aspects numerically and by analyzing the forces that contribute to the CME dynamics, which had not been done so extensively for this type of simulations before.
Save the date: Open Days
The Belgian Space Pole will open its gates on September 24th and 25th!
The Royal Observatory of Belgium, the Royal Meteorological Institute of Belgium, the Royal Belgian Institute for Space Aeronomy and the Solar-Terrestrial Centre of Excellence are rolling out the red carpet for you. Our theme this year is 'Space For Climate'.
Expect a weekend of fun and games for the little ones, scientific discoveries for the whole family and direct interaction with the scientists themselves. Whether you're coming to view the telescopes or to learn more about the weather, (space) climate, the northern lights or the planets of the solar system, we've got it all lined up for you. See you then!
Keep an eye on https://spacepole.be/en/open-days

Review of solar activity
Electromagnetic Radiation: Flares
Over the past week the solar activity was at very low to low levels. There were ten numbered active regions on the visible solar disc. All active regions (AR) were relatively simple (at most magnetic type beta) and there were only two low C-class flares throughout the entire forecasting week.
A C1.4 flare with peak time 18:43 UTC was produced by NOAA AR 3040 on June 27th and a C1.4 flare with peak time 23:13 UTC was produced by NOAA AR 3046 as it was rotating into view from the east limb on June 29th. There was no other significant flaring activity.
Solar Wind: Coronal Mass Ejections
The partial halo coronal mass ejection (CME) first observed in LASCO C2 data around 03:24 UTC on June 26th with an average plane of sky velocity of around 680 km/s was attributed to an on-disc filament eruption in the south-west quadrant. The CME was believed to have an Earth-directed component with expected arrival on June 29th.
The large on-disc filament eruption from the northern part of the central meridian lifted off around 22 UTC on June 28th, but left no clear coronagraph signature and was estimated to have no clear impact on Earth.
A partial halo CME was detected by LASCO/C2 coronagraph data around 03:24 UTC on June 30th with an average plane of sky velocity around 400 km/s. This event appeared back-sided with no expected impact on Earth.
No other Earth-directed CMEs were detected in the available coronagraph imagery throughout the week.
Solar Wind: Coronal Holes
A small negative polarity coronal hole crossed the central meridian in the UTC morning on June 30th.
A large patchy positive polarity coronal hole crossed the central meridian in the UTC afternoon on July 01st and the related high speed stream (HSS) was expected to reach Earth on July 4th.
Particle radiation: Protons and Electrons
The greater than 10 MeV proton flux was at background values throughout the entire week.
The greater than 2 MeV electron flux briefly crossed the 1000 pfu threshold on June 26th and was mostly above the 1000 pfu threshold from June 27th until the evening of July 01st. The greater than 2 MeV electron flux returned to background levels well below the 1000 flu threshold on July 2nd and remained so until the end of the week.
The electron fluence started the week at nominal levels. It reached moderate levels on June 28th and remained at moderate levels throughout July 2nd. The electron fluency returned to nominal levels at the end of the week.
Review of geomagnetic activity
The solar wind parameters at the beginning of the week registered the arrival of a high speed stream (HSS). The solar wind speed reached values of almost 700 km/s with an interplanetary magnetic field of up to 10nT. The HSS continued on June 28th and started to slowly wane on June 29th, returning to slow solar wind conditions at the end of June 30th.
A weak discontinuity at 09 UTC on July 1st marked the beginning of a gradually evolving ICME arrival. By midnight the magnetic cloud arrived with the interplanetary magnetic field magnitude increasing to 14 nT and a north-south Bz component reaching a minimum of -13nT. The density has increased to 35 ppcc and the solar wind speed remained low, around 350 km/s.
The solar wind parameters remained under the continuous influence of the ICME arrival on July 2nd and July 3rd, when the solar wind density reached 46 ppcc, while the solar wind speed was around 310 km/s and the magnetic field has decreased to below 10nT with mostly positive Bz.
The geomagnetic conditions in the beginning of the week started at active to unsettled conditions under the influence of the high speed stream arrival.
The geomagnetic conditions were mostly quiet to unsettled from June 28th throughout July 1st with an exception of several local active periods, registered in Dourbes late UTC on June 28th/early UTC on June 29th.
The increased values of the interplanetary magnetic field due to the ICME arrival and a prolonged period with negative Bz lead to a minor geomagnetic storm early on July 2nd, surrounded by several active periods.
The geomagnetic conditions then were mostly quiet to unsettled for the remaining of the week.
PROBA2 Observations
Solar Activity
Solar flare activity fluctuated from very low to low during the week.
In order to view the activity of this week in more detail, we suggest to go to the following website from which all the daily (normal and difference) movies can be accessed: https://proba2.oma.be/ssa
This page also lists the recorded flaring events.
A weekly overview movie (SWAP week 640) can be found here: https://proba2.oma.be/swap/data/mpg/movies/weekly_movies/weekly_movie_2022_06_27.mp4.
Details about some of this week's events can be found further below.
If any of the linked movies are unavailable they can be found in the P2SC movie repository here: https://proba2.oma.be/swap/data/mpg/movies/.
Tuesday Jun 28
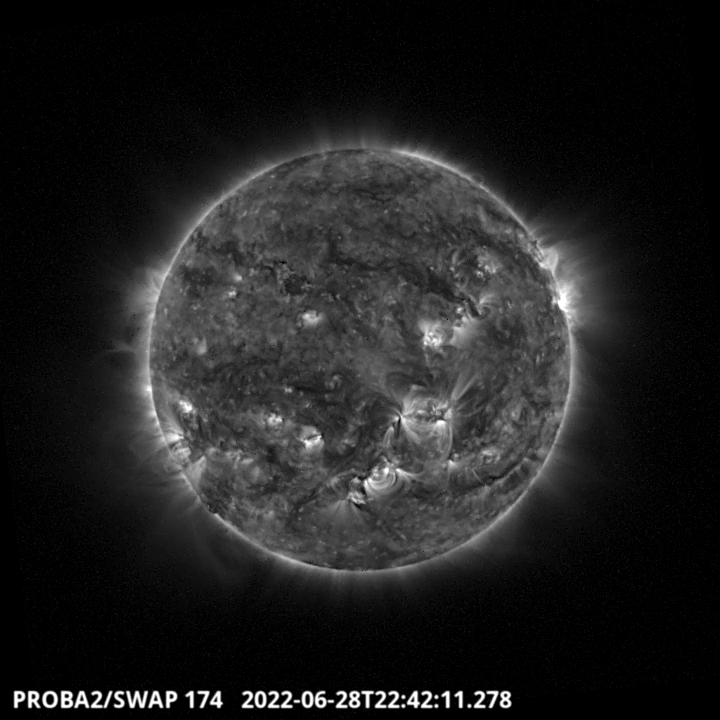
Filament Eruption on the north-east part of the solar disk around 22:42 UT - SWAP image.
Find a SWAP movie of the event here: https://proba2.oma.be/swap/data/mpg/movies/20220628_swap_movie.mp4.
Saturday Jul 2
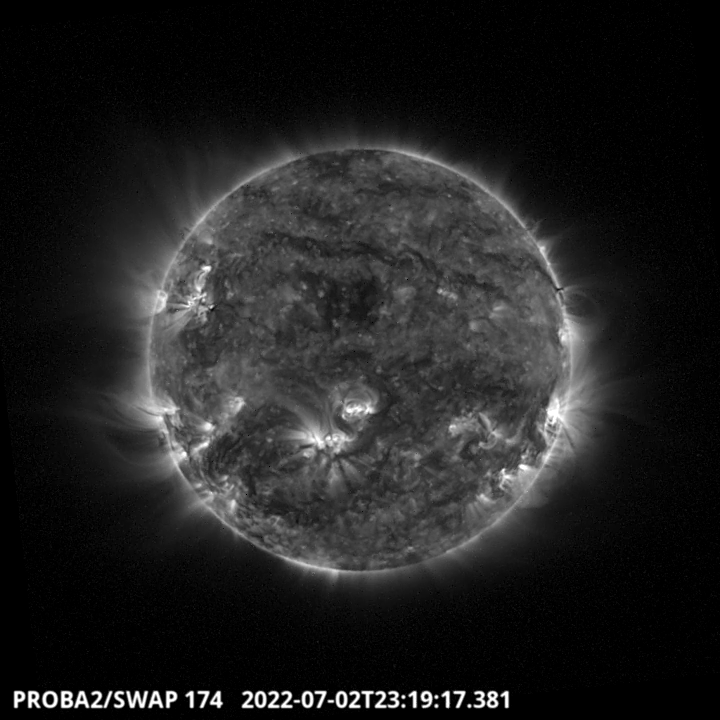
A coronal hole crossed the central meridian on the northern hemisphere of the solar disk, and can be seen in this SWAP figure taken around 23:19 UT.
Find a SWAP movie of the event here: https://proba2.oma.be/swap/data/mpg/movies/20220702_swap_movie.mp4.
International Sunspot Number by SILSO
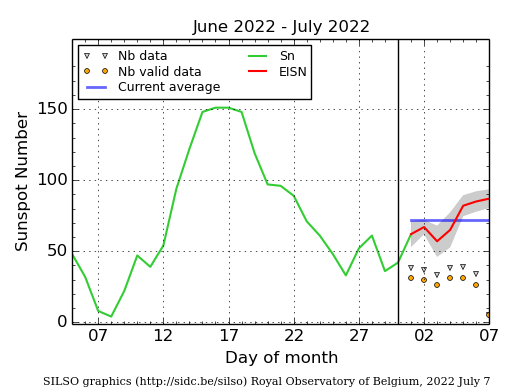
The daily Estimated International Sunspot Number (EISN, red curve with shaded error) derived by a simplified method from real-time data from the worldwide SILSO network. It extends the official Sunspot Number from the full processing of the preceding month (green line), a few days more than one solar rotation. The horizontal blue line shows the current monthly average. The yellow dots give the number of stations that provided valid data. Valid data are used to calculate the EISN. The triangle gives the number of stations providing data. When a triangle and a yellow dot coincide, it means that all the data is used to calculate the EISN of that day.
Geomagnetic Observations in Belgium
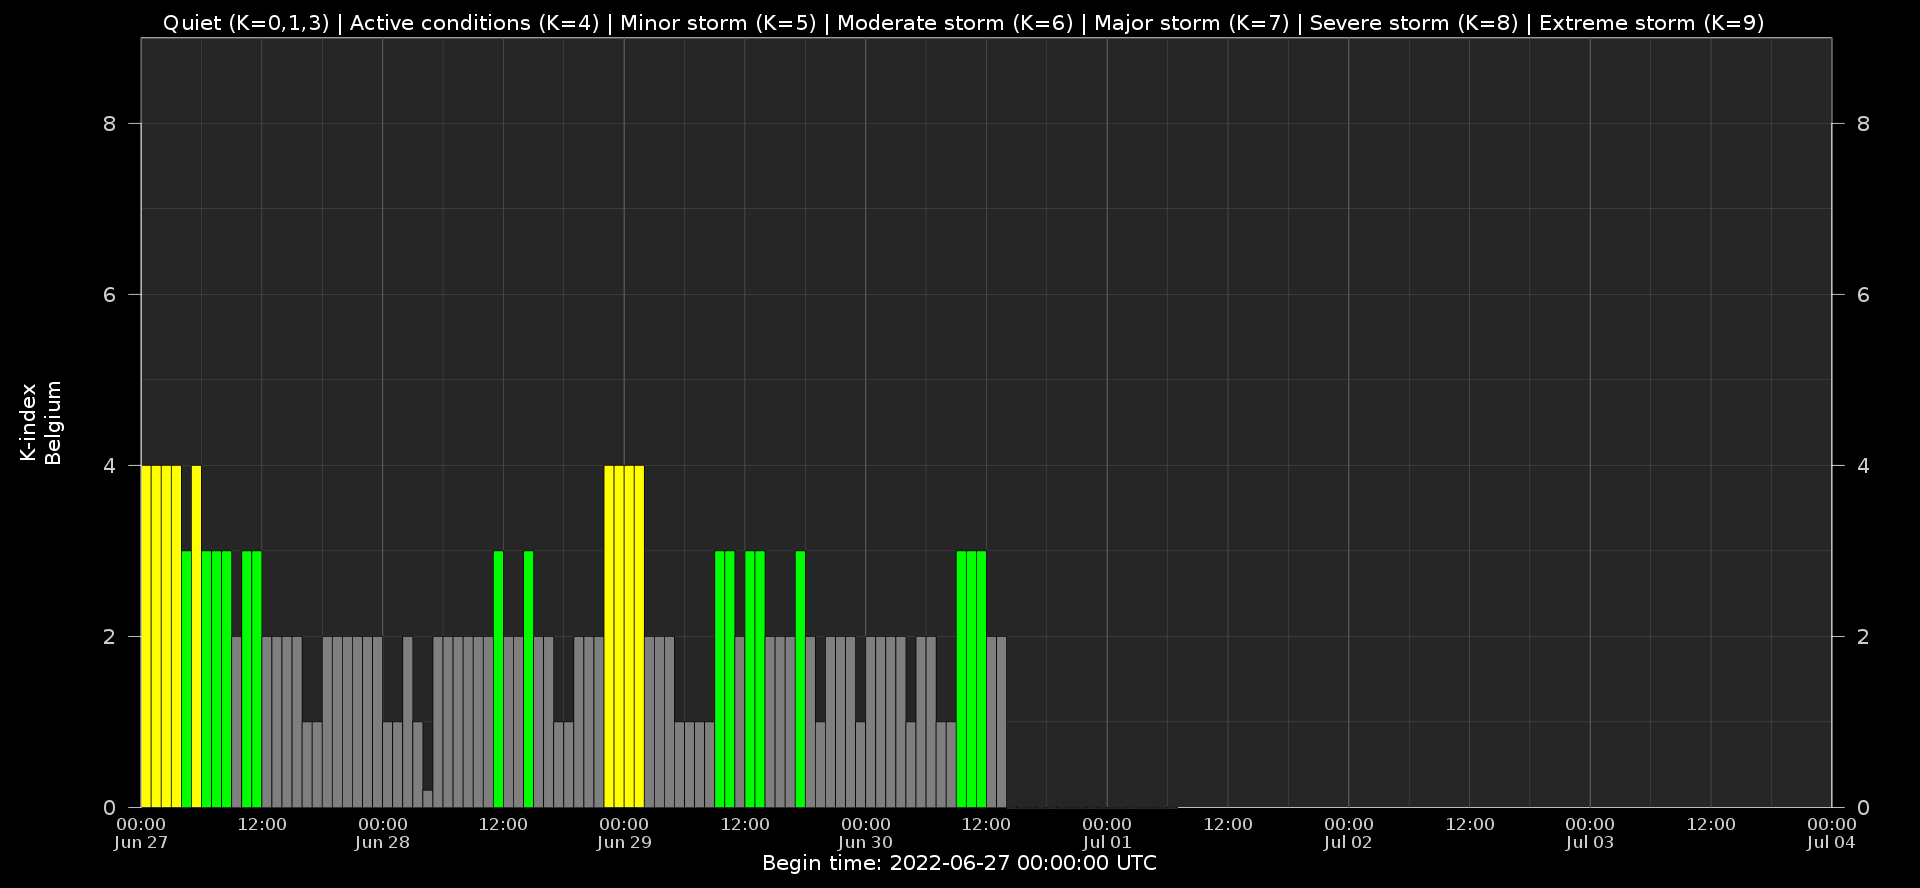
Local K-type magnetic activity index for Belgium based on data from Dourbes (DOU) and Manhay (MAB). Comparing the data from both measurement stations allows to reliably remove outliers from the magnetic data. At the same time the operational service availability is improved: whenever data from one observatory is not available, the single-station index obtained from the other can be used as a fallback system.
Both the two-station index and the single station indices are available here: http://ionosphere.meteo.be/geomagnetism/K_BEL/
The SIDC Space Weather Briefing
The Space Weather Briefing presented by the SIDC (https://www.sidc.be) forecaster on duty from June 26 to July 3. It reflects in images and graphs what is written in the Solar and Geomagnetic Activity report. The pdf and movies can be found in: https://www.stce.be/briefings/20220704/
Action!
Check out our activity calendar: activities and encounters with the Sun-Space-Earth system and Space Weather as the main theme. We provide occasions to get submerged in our world through educational, informative and instructive activities.
If you want your event in our calendar, contact us: stce_coordination at stce.be
* August 25, Public Lecture on Space Weather and Aviation, Astropolis, Oostende, Belgium
* September 24-25 Space Pole Open Days, Brussels, Belgium
* October 24-28, 18th European Space Weather Week, Zagreb, Croatia
* November 21-23, Space Weather Introductory Course - onsite, by the STCE, Brussels, Belgium
* December 5, 6, 8, 9, Space Weather Introductory Course - online, by the STCE, zoom
Check: https://www.stce.be/calendar