
Welcome to the STCE's Solar Cycle 25 tracking page! Here we monitor the ongoing solar cycle 25 (SC25) by providing graphs on the evolution of some important parameters in the space weather domain such as the sunspot number, flaring activity, coronal mass ejections and geomagnetic indices. This page is updated about once every 4 months, and allows for comparisons with previous solar cycles. Table underneath can be used to quickly navigate to your parameter of interest. Text updates are in italics, significant conclusions in bold. Enjoy!
Original: 26 October 2021 - Latest update: 6 March 2026 - Next update: June-July 2026
Sunspot number
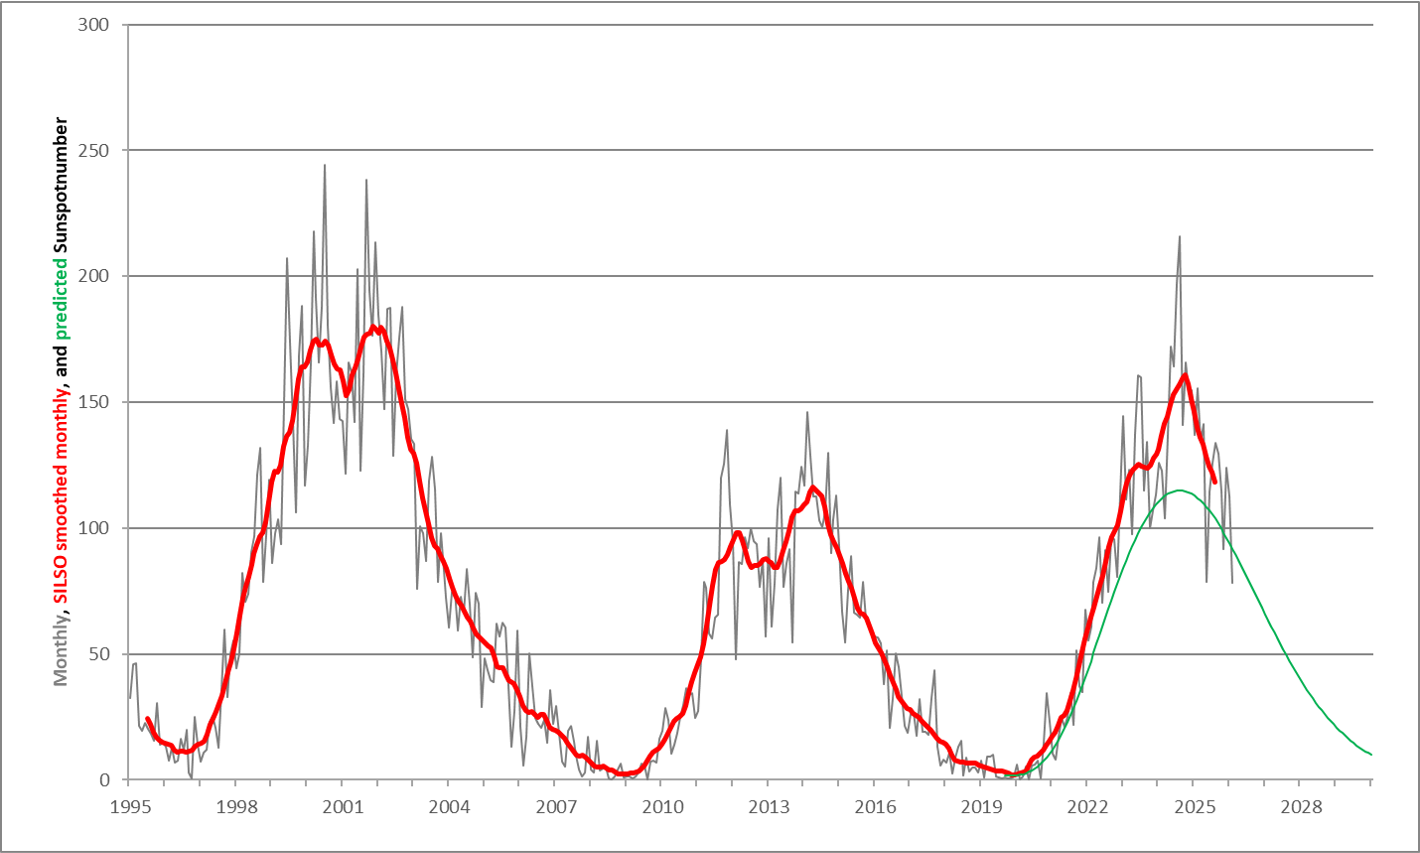
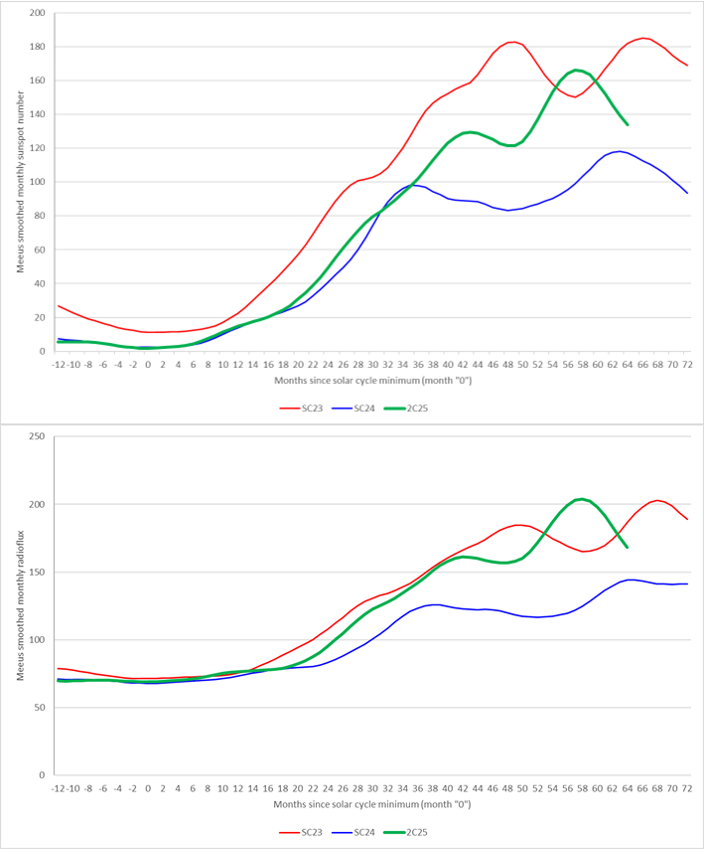
The sunspot number provides the longest record on solar activity, dating back all the way to the early 17th century. The graph above shows the monthly and SILSO smoothed monthly sunspot number (SIDC/SILSO smoothing formula) for the previous 2 solar cycles, SC23 and SC24. The prediction for the ongoing solar cycle 25 which started in December 2019, is displayed in green and derived using the parametrized equations from Hathaway et al. (1994). Amplitude (115 +/-10) and timing of the maximum (July 2025 +/- 8 months) are based on the results from the international SC25 Prediction Panel, but in the above graph the timing has been advanced to August 2024 (SC25 panel update). More infographics on the sunspot number and SC25 are at a dedicated SILSO webpage. Sunspot number data are from SILSO, World Data Center for the Sunspot Index, Royal Observatory of Belgium, Brussels, 1749-present.
Following a surge in solar activity during the first half of 2023, the smoothed monthly sunspot number reached a first maximum of 125.3 in June 2023, thus exceeding already the maximum of the previous solar cycle SC24 (116.4). After a brief and mild decrease (Meeus smoothed graph), the smoothed monthly sunspot number increased again following the high sunspot numbers recorded from April 2024 onwards. Both in April, July, August and December 2024, there were several days when the provisional daily sunspot number exceeded 250. On 18 July, the highest daily sunspot number so far has been recorded (290). The monthly sunspot number reached a maximum of 216.0 in August, which is the highest since September 2001 (238.2).
The SILSO monthly sunspot numbers indicate a smoothed maximum for SC25 of 160.9 in October 2024 (see also this STCE newsitem). Both the Solar Cycle Science website and the SILSO predictions show a continued decrease over the coming months. Thus, SC25 maximum seems to have ended well above the initial prediction by the SC25 Panel (115), but also well below the moderately strong SC23 (180.3). In view of the Sun's polar field reversal (completed in 2023-2024), and SC25 already more than 6 years in progress, it seems very likely that October 2024 is indeed the month of SC25 maximum. Nonetheless, over the next 2-3 years and despite the expected declining solar cycle trend, there may still be brief periods with very enhanced solar and geomagnetic activity. For example, the Halloween storms took place 2 years after SC23 maximum, and the famous September 2017 storms occurred 3.5 years after SC24 maximum.
Hemispheric sunspot activity

Solar activity is not equally distributed over the two solar hemispheres. Indeed, there can be significant differences over longer time scales (several years) in the hemispheric activity levels. The above graph shows the evolution of the sunspot area of the solar hemispheres based on the Greenwich sunspot areas (1874-present), with "blue" indicating a dominating northern hemisphere, and "red" a dominating southern hemisphere. These data are maintained by and available at the Solar Cycle Science group. From the maximum of SC18 till the maximum of SC20, the northern solar hemisphere was clearly dominating sunspot activity. The descending branch of the last 4 solar cycles was clearly influenced by the southern hemisphere. The northern solar hemisphere dominated the sunspot activity from the beginning of 2022 until late 2023, with the southern solar hemisphere dominating the year of cycle maximum with many large and complex sunspot groups. From early 2025, the northern hemisphere has taken over again, albeit modestly.
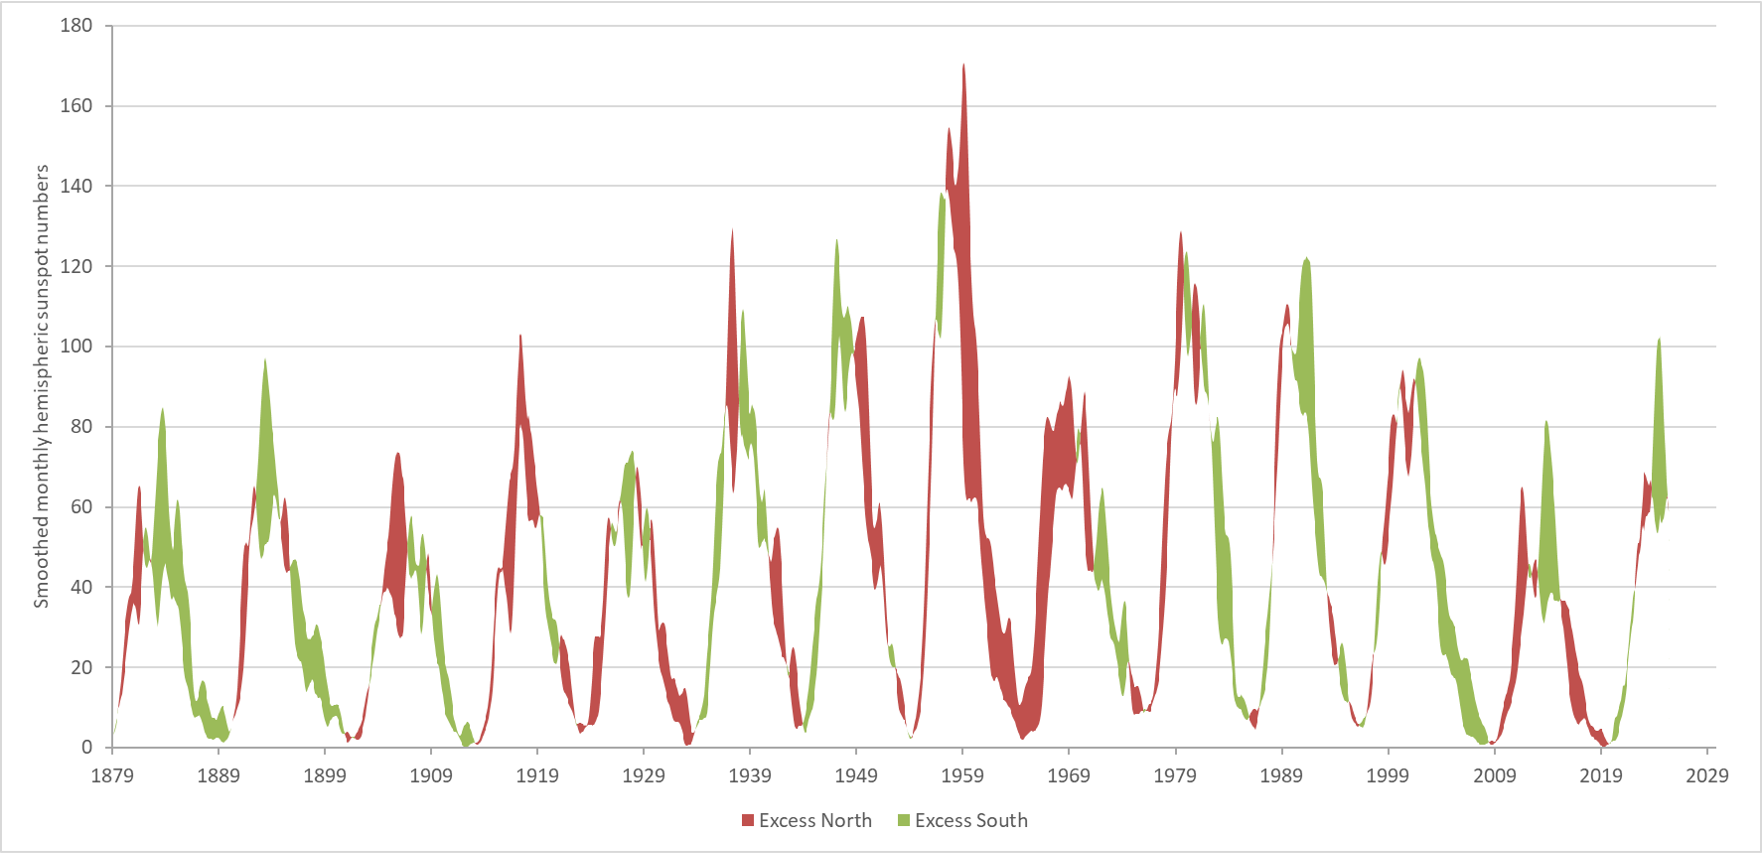
Similar to the sunspot area, a graph can be created for the evolution of the sunspot number of the solar hemispheres. These data are maintained by SILSO. Originally, these existed only for the last 3 solar cycles, starting in 1992 (See these SILSO datafiles). The newly extended hemispheric sunspot numbers series are based on the sunspot areas listed in the Greenwich photographic catalogue, and are calibrated on the existing SILSO reference hemispheric database (Veronig et al., 2021). In the graph above, "green" is indicating a dominating southern hemisphere, and "darkred" a dominating northern hemisphere. For obvious reasons, the graph is very similar to the one of the hemispheric sunspot area, albeit with subtle details. For example, the domination by the northern solar hemisphere from 2025 onwards is much less outspoken in the hemispheric sunspot numbers than in the hemispheric sunspot areas.
Butterfly-diagram & Latitude

The distribution of the sunspot groups over the solar disk can be seen in the so-called butterfly diagram, displaying for every month the latitude of every individual sunspot group (data from the Solar Cycle Science website ) that has appeared. It clearly shows that during the period of solar cycle minimum, the sunspot groups of the old solar cycle appear ever closer to the solar equator, while the sunspots of the new solar cycle manifest themselves again at high latitudes. As the pattern resembles the wings of a butterfly, it is called a butterfly diagram. The first such butterfly diagram was published by E. Walter Maunder in the Monthly Notices of the Royal Astronomical Society in 1904.
From 16 till 18 July 2021, a sunspot was visible near the southeast solar limb at the very high southern latitude of -43°. NOAA 12844 was a quiet and magnetically simple region, and the first region of the new SC25 of which the latitude exceeded 40°. See also this STCE newsitem. Other sunspot groups with a relatively high latitude were NOAA 13137 (+36°) and 13138 (-39°) in November 2022, and NOAA 13154 (-38°) in December 2022. NOAA 13365 (July 2023), NOAA 13575 and NOAA 13591 (both February 2024) reached a latitude of -36°. Of note is that more and more low-latitude groups have started to appear on both solar hemispheres, with a handful even less than 5° from the solar equator. At the same time, active regions with latitudes between 25° and 30° continue to appear in both solar hemispheres.
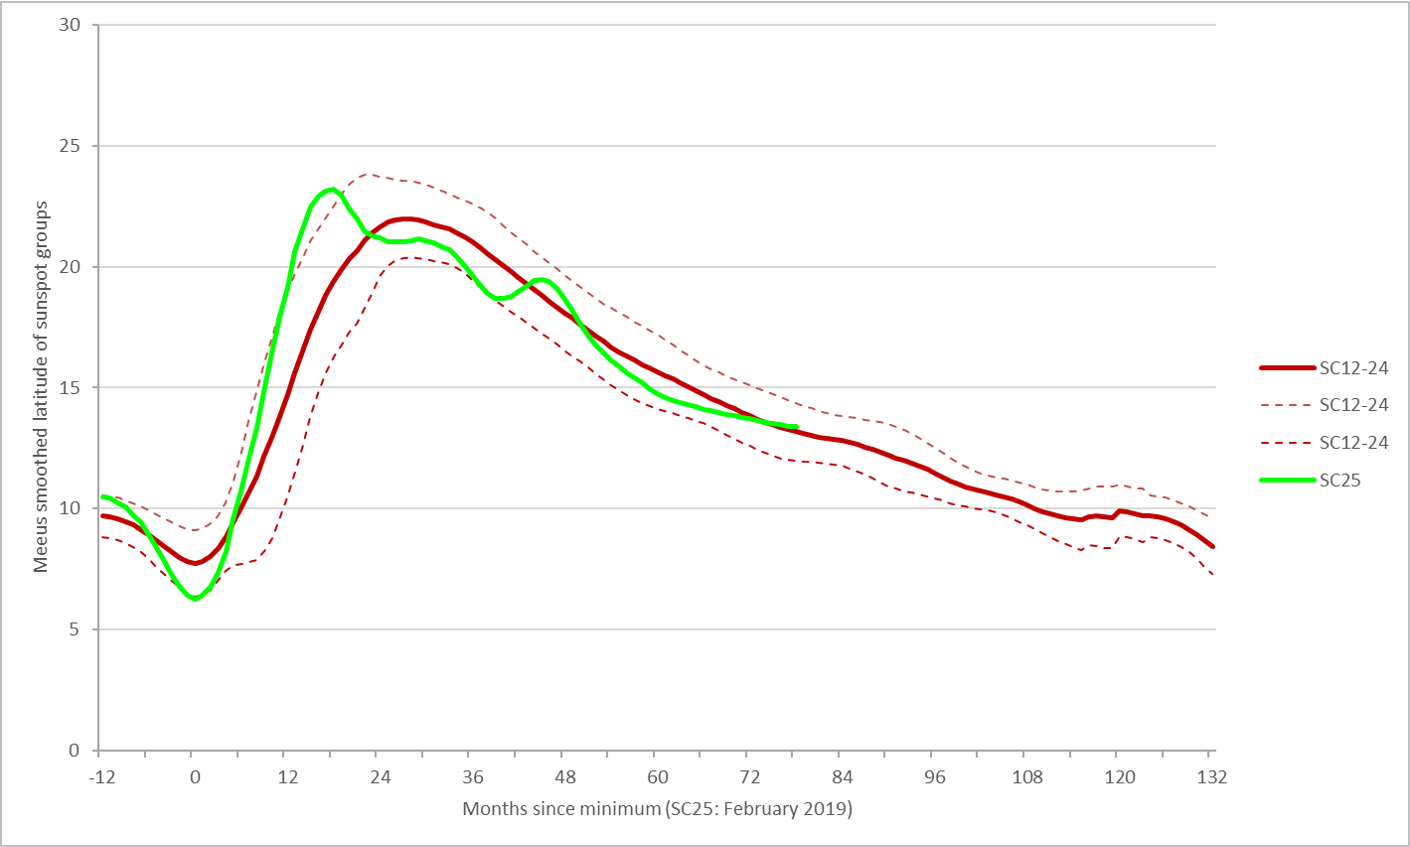
The graph above shows the smoothed (Meeus, 1958) average latitude of the sunspot regions from SC12 to 24 (brown; the thin dashed lines show the standard deviations), and for SC25 (green). The SC12-24 and SC25 latitudes are fit such that the months of lowest smoothed latitudes coincide (month "0").
SC25 latitude reached a minimum in February 2019 (6.3°, so the active regions emerged very close to the solar equator), and has peaked in August 2020 (23.2°). This peak seems to have occurred slightly earlier and to be slightly higher than the average SC12-24 values, but there's nothing out of the ordinary. More info on the average latitude of sunspot groups is in this STCE newsitem.
The timing when the smoothed average latitude reaches 16° has been used to predict the timing of the solar cycle maximum (e.g. Schatten 2002). Based on the SC12-24 values, the smoothed average latitude descends under 16° 58 months after its smoothed minimum. Also, this 16° threshold happens to be reached 3 months before the solar cycle maximum (with an uncertainty of 10 months). As for SC25 the smoothed latitude descended under 16° in September 2023, the maximum of SC25 was to be expected in December 2023, with an uncertainty of 10 months. In practice, this meant that the SC25 maximum could be expected in or before October 2024. As it turns out, the timing of SC25 maximum falls just within this prediction range.
10.7 cm radio flux

Every day, the Dominion Radio Astrophysical Observatory (DRAO) in Penticton, British Columbia, Canada, measures and publishes the values of the 10.7 cm solar radio flux. The wavelengths around 10.7 cm (frequencies around 2800 MHz) are ideal for monitoring the solar activity, as they are very sensitive to conditions in the upper chromosphere and at the base of the corona. As a result, this radio flux is widely used in solar research and space weather applications such as e.g. satellite drag. It is expressed in solar flux units (with 1 sfu = 10-22 W m-2 Hz-1), and measured three times daily: around 17UTC (18UTC in winter), 20UTC (local noon at Penticton), and 23UTC (22UTC in winter). The 20UTC value is usually taken as the radio flux for that particular day (Tapping, 2013).
In the graph above, the adjusted data (corrected for the varying Sun-Earth distance) have been used, with data till December 2017 coming from NGDC/NOAA archive, and from National Resources Canada (NRCan) afterwards. The data were smoothed using Meeus smoothing formula (Meeus, 1958) and cover the averages from SC19 to SC24. The dashed lines reflect values including the standard deviations.
In January 2022, the monthly radio flux exceeded 100 sfu for the first time this SC25. In January and February 2023, the radio flux exceeded 200 sfu on several days (see this STCE newsitem). The observed daily radio flux exceeded 250 sfu (non-flare driven!) on several days in August and during the October-December 2024 timeframe, with highs of 305.5 sfu and 311.9 sfu on respectively 9 August and 3 October.
The smoothed monthly radio flux values exceeded the maximum from the entire previous SC24 (144.2 sfu) in December 2022, with a value of 145.6. Due to the high solar activity in 2024, the smoothed monthly radio flux reached a maximum of 203.6 sfu in September 2024, slightly higher than the SC23 maximum (202.9 sfu - see these comparison charts). This inter-cycle difference in sunspot number and radio flux should not be too surprizing as aside sunspots, there are also other sources in the chromosphere and corona that are contributing to the solar radio flux (see e.g. Okoh et al. 2020 ; Tapping et al. 1990), thus significantly complicating accurate predictions of the radio flux. The highest monthly radio flux so far during SC25 was recorded in August 2024 (253.9 sfu ; 251.0 sfu if corrected for flare impacts). This is the highest monthly radio flux value since the maximum of SC19 in the late 1950s. More recent values that came close were June 1989 (247.2 sfu), February 1991 (237.2 sfu), and September 2001 (236.2 sfu).
The enhanced solar activity in 2022 and 2023 was accompanied by continuing high levels of solar EUV and x-ray emission, for which the solar radio flux is a proxy. Consequently, the thermosphere has been getting hotter, as measured by the SABER satellite (Mlynczak et al. 2018). The subsequent expansion of the thermosphere causes drag effects that alter satellite orbits and clean up space debris. A brief peak of the Thermosphere Climate Index (TCI) was observed early March 2023 (2.4 1011 Watt) which was most likely driven by the enhanced solar activity in December 2022 and January/February 2023 (see this STCE newsitem), with only a marginal uptick from he strong geomagnetic storms in March and April 2023.
Following the high solar and geomagnetic activity during May to October 2024 timeframe, the index rose sharply from 2.0 1011 Watt early May to maximum values around 3.4 1011 Watt in September and October 2024. These high values have not been observed since the maximum of SC23. Since May 2025, the TCI values were near 2.1 1011 Watt - which is still higher than the maximum of SC24! The current values and evolution of the Thermosphere Climate Index are available at Spaceweather.com. Similar conclusions can also be drawn from the evolution of the Total Solar Irradiance (TSI), as maintained by the SIDC/TSI (Dewitte et al. 2022).
Number of M- and X-class flares

Solar flares are known to cause radio black-outs at high frequencies (HF; 3-30 MHz). Some flares may be accompanied by strong radio emission affecting radar and GNSS frequencies (see the ROB/GNSS and SIDC/Humain websites), thus causing problems with air traffic operations and with GPS-based communication and navigation services. Solar flares are recorded in the wavelength band from 1 to 8 Angstrom (0.1-0.8 nm) by the GOES (NOAA/SWPC). The 3 most often used classes are: C, M, and X standing for small (or "Common"), Medium, and large (or "eXtreme") flares. The range is logarithmic, each class being 10 times stronger than the previous one, and within each category ranging from 1 to 9 (e.g. a C9 flare, an M3 flare,...). See the STCE SWx Classification page for more details.
In the graph above, the yearly number of flares are binned in 3 classes: M1 to M4, M5 to M9, and the X-class flares. The thin green line represents the yearly International Sunspot Number (ISN). The values for the current year are obviously preliminary. The data sources are NOAA/NGDC (1976-July 2017), and the NOAA/SWPC Weekly bulletins (2017-present). Rescaling of the flares' peak intensity (pre-GOES-16 era) has been performed in accordance with guidelines at NGDC/NOAA.
Following the exceptional flaring activity by NOAA 13664 in May 2024 (STCE newsitems here and here), and the very high solar activity during the second half of 2024, SC25 has now (up to 28 February 2026) produced 1690 flares in the M1_M4 range, 165 in the M5_M9 range, as well as 101 X-class flares.
- About 7% of these 1956 M- and X-class flares were produced in May 2024, and we have to go back to March 1991 to find a month with even more M- and X-class flares (resp. 179 vs 143). March 1991 also has 2 X-class flares more than May 2024 (23 vs 21).
- May 2024 was also the first month with more than 10 X-class flares in a single month since September 2005 with the famous active region NOAA 10808 (chart underneath).
- Note that also October 2024 (122 M- and X-class flares) performed well above average. As such, 2024 is only the third year with more than 900 M- and X-class flares in a single year, after 1989 and 1991 (resp. 922, 968 and 979). For comparison; SC24 produced only 1200 M- and X-class flares during its entire duration.
- Another important flare-productive group was NOAA 14366, which produced 66 M- and 6 X-class flares in February 2026. This active region ranks third in the list of flare-productive groups as observed during the GOES era (STCE newsitem).

Up to 28 February 2026, the strongest flares so far in SC25 were an X9.0 flare produced by NOAA 13842 on 3 October 2024 (see the STCE newsitems here and here), an X8.7 produced by NOAA 13664 on 14 May 2024 (see this STCE newsitem), and an X8.1 flare produced by NOAA 14366 on 1 February 2026 (STCE newsitem). A table with the Top 10 of strongest flares can be found here. It is very likely that the strongest flares of SC25 so far took place on the Sun's farside (as observed by Solar Orbiter/STIX), with a proxied X14 flare on 22 July 2024 (see the STCE newsitems here and here) and an X16 event on 20 May 2024 (Stiefel et al. 2025) as the two prime flares.
As the maximum sunspot number for SC25 was thought to be similar to that of SC24, the number of M- and X-class flares was also expected to be similar (rescaled!), with 1075 M- and 76 X-class flares forecasted for the entire duration of SC25 (see Janssens, 2021). Clearly, with such flare-productive regions, these numbers were easily exceeded.

Comparing the current number of flares to that of previous solar cycles at the same stage (74 months since SC minimum ; bar-diagram above), the number of strong (M5+) flares so far in SC25 (266) is higher than both SC23 (239) and SC24 (153), but well below the flaring numbers of SC21-22 (resp. 374 and 498). NOAA 13664 produced 17 of the 266 M5+ flares (12 X-class events!) in SC25, also NOAA 14366 (14, of which 6 X-class) contributed significantly, as well as NOAA 13663 and 13697 with 11 such flares each (resp. 5 and 6 X-class ; STCE newsitem here and here).
Number of proton events

An increased level of energetic protons may constitute a radiation threat to astronauts, in particular during their extra-vehicular activities (space walks). Proton events can increase the radiation dose of the crew and passengers on transpolar flights, and can cause communication problems over the polar areas (the so-called "Polar Cap Absorption"). These particles also give satellites a hard time. They can create malfunctions in the onboard electronic circuitry, degrade solar panel efficiency, and increase the noise in star-tracking systems. The parameter used to gauge the proton flux is the > 10 MeV proton flux, as measured by the GOES (NOAA/SWPC). The proton flux is expressed in proton flux units or pfu (1 pfu = 1 proton / cm2 s sr), with the alert threshold at 10 pfu.
The graph above shows the yearly number of proton events, binned per peak flux range in accordance with the corresponding NOAA S-scale. Since the GOES measurements started in 1976, there have been about 60 proton events per decade (see NOAA/SESC and NOAA/SWPC for the source data). Note there are large differences between solar cycles. For example, during SC24, there were only 42 proton events, and none of them had peaks larger than 10,000 pfu.
The first proton event of SC25 took place on 29 May 2021, reaching a peak flux of only 15 pfu (STCE newsitem). So far (28 February 2026), SC25 has produced 44 proton events, of which 4 strong solar radiation storms (S3 or higher on the NOAA scale, i.e. a peak > 1000 pfu). Strong proton events took place on on 8 June 2024 (peak: 1030 pfu), 9-10 October 2024 (1810 pfu), and 11-12 November 2025 (1460 pfu). The former was associated with an M9 flare produced by active region NOAA 13697 - the successor of NOAA 13664 - (STCE newsitem), the second was related to X-class flare activity by NOAA 13848 and the passage of the related interplanetary coronal mass ejection (CME ; see this STCE newsitem for more info on these Energetic Storm Particle events, also known as "ESP"). The 11-12 November is discussed in the "Ground Level Enhancements" section underneath. Note that some of the SC25 proton events are still under scrutiny, see e.g. the new NCEI/NOAA/SWPC website.
A severe proton event took place on 18-19 January 2026, reaching a peak of 37000 pfu (STCE newsitems here and here). This was the first severe solar radiation storm (S4) of SC25. Since the GOES measurements started in 1976, only 9 events of this intensity have been recorded, the last one dating back to the famous Halloween events in October 2003. The January 2026 ranks 3rd in this list after the March 1991 (43500 pfu) and October 1989 events, but before the November 2001 and October 2003 (29500 pfu) events. The peak was mainly driven by the very fast halo CME (near 2000 km/s), and not by the eruption itself (X1.9 flare in NOAA 14341), i.e. another "ESP" event. As such, the fluxes of the more energetic protons with energies in excess of 100 and 500 MeV remained at nominal levels (STCE newsitem). This means that this radiation storm never posed any radiation hazard for astronauts and passengers on polar flights, and that its impact was limited to a strong disturbance of the High Frequency radio communication (3-30 MHz) over the polar caps (PCA).
Number of Ground Level Enhancements

Occasionally, during proton events there may be a substantial increase of protons with energies of 500 MeV or more. The secondary particles resulting from the interaction of these highly energetic protons with the Earth's upper atmosphere may shower down all the way to the Earth's surface, where they are measured with neutron monitors (RMI/Dourbes, NMDB). The increase in the number of neutrons is then called a Ground Level Enhancement (GLE). Specifically, a GLE is registered when there are near-time coincident and statistically significant enhancements of the count rates of at least two differently located neutron monitors including at least one neutron monitor near sea level and a corresponding enhancement in the proton flux measured by a space-borne instrument (Poluianov et al., 2017). The list of GLEs is currently maintained by the University of Oulu. GLEs are even rarer than proton events, with a frequency of only about 10 per decade (see also these STCE newsitems here and here). During the previous SC24, only 2 GLEs were recorded (17 May 2012 and 10 September 2017).
So far this solar cycle, already 5 GLEs have already been observed. The first 4 GLEs were quite weak events, with maximum increases in neutron counts between 8% and 17%. For comparison, the GLEs associated with the Bastille Day and Halloween events in resp. 2000 and 2003 reached resp. 58% and 45%.
- The first one was associated with the X1.0 flare of 28 October 2021, but the related proton event was only a minor event (peak of 29 pfu). Curiously, it was accompanied by an increase in the flux of more energetic protons, and as such resulted in a weak GLE #73 (Oulu GLE database).
- A very similar scenario for the second GLE (GLE #74), which took place on 11 May 2024 and was associated with an X5.8 flare produced by - oh surprize- NOAA 13664. Here, the greater than 10 MeV proton flux reached a modest 116 pfu.
- The other two GLEs took place on 8 June 2024 (NOAA 13697) and 21 November 2024 (farside).
A strong GLE (GLE #77 ; Oulu) took place on 11-12 November 2025, following the X5.1 flare from active region NOAA 14247 on 11 November (STCE newsitems here and here (Note 2)). The intensity of this GLE was comparable to the September 2017 and the December 2006 events, however still much weaker than the January 2005 GLE. Also, the peak flux of protons with energies of 10 MeV reached 1460 pfu, but was in part driven by the passing CME (yet another ESP event). The GLE did not pose a radiation threat to airplane passengers and had also nothing to do with the grounding of the Airbus fleet 2 weeks later. However, it highlighted a growing concern these events can impact the onboard avionics (STCE newsitem).
Number of Prominences

Solar filaments are clouds of ionized gas above the solar surface squeezed between magnetic regions of opposite polarity. Being cooler and denser than the plasma underneath and their surroundings, they appear as dark lines when seen on the solar disk and as bright blobs when seen near the solar limb (then they are called "prominences"). Special filters are required to observe these features, and one such a filter is the Hydrogen-alpha (H-alpha) line in the red part of the solar spectrum at 656.3 nm. Prominences have been observed by members of the solar section of the British Astronomical Association (BAA) for decades (PMDF: Prominence Mean Daily Frequency).
The graph above shows the monthly and smoothed (Meeus, 1958) monthly number of prominences since 1992, and the Meeus smoothed monthly sunspot number since 1990. Note that, over time, these observations have been performed by different observers with different instruments, so this may affect in part the observed evolution. Though the most recent minimum was deeper than the previous one at the onset of SC24, the current smoothed monthly values have been rising since February 2019 -10 months prior to the sunspot number minimum-. Since October 2023, these smoothed numbers have been gradually increasing to a maximum PMDF of about 8 (7.97) in September 2024. This is about half way between the maxima of SC24 (5.4) and SC23 (10.1). Long, large filaments and prominences can erupt, with some impressive examples -just in 2025- on 14-15 July, 3-6 July, 12-14 May, 12 April, 24-25 February, and 2-5 February.
Number of Coronal Mass Ejections

Solar eruptions are often (but not always) accompanied by coronal mass ejections (CMEs). These clouds of charged particles, when directed to Earth, may eventually disturb the Earth's magnetic field and cause a strong geomagnetic storm. This in turn may result in problems with the power grids and pipelines, issues with satellites, satellite communication and GNSS based services, and radio communication problems amongst many other. The aurorae (or polar lights) are a spectacular but unharmful phenomenon.
CMEs can be observed using coronagraphs on board satellites such as SOHO and STEREO. Tools are used to automatically detect CMEs in these coronagraphic images. At the ROB, such a software tool was developed during the early years of this century (see Robbrecht and Berghmans, 2004 and Robbrecht et al., 2009 ). CACTus is short for Computer Aided CME Tracking, and its data are available at a dedicated ROB website. Note that different instruments and different methodologies may give different values for the number of CMEs (for a discussion see Lamy et al., 2019).
The graph above shows the daily and smoothed (Meeus, 1958) daily CME rate, averaged per month and corrected for the duty cycle (i.e. the time for which images are available). The interesting part in this graph is that though SC24 was a weaker solar cycle compared to SC23, the maximum CME rate was comparable to and even a bit higher than its predecessor. This was explained by Gopalswamy and collaborators in 2014 as being due to a significant reduction in the total pressure (magnetic + plasma) in the heliosphere, leading to an anomalous expansion of CMEs (more halo CMEs) and a relatively higher number of CMEs altogether. The excess CME expansion contributed to the diminished effectiveness of CMEs in producing geomagnetic storms during cycle 24, with no (zero) extremely severe geomagnetic storms observed during SC24. Note that there are many articles (e.g. Lamy et al. 2019 , Michalek et al. 2019) discussing the reliability and consistency of the various CME catalogs.
The smoothed daily CME rate reached a (first) maximum of 6.1 CMEs per day in May 2023, i.e. 41 months since the smoothed minimum of the CME rate. This value exceeds the maxima recorded during the previous solar cycles 23 and 24 (resp. 5.0 vs 5.9 CMEs per day). The absolute monthly value reached a maximum in February 2023 (7.8 CMEs per day), the highest observed so far since SOHO's launch over 25 years ago. The current CME rate seems to be gradually declining.
Ap-index

The Ap-index is a parameter expressing the level of disturbance of the geomagnetic field. More details on this and other geomagnetic indices can be found at the STCE's SWx Classification Page. Geomagnetic data are maintained by the Kyoto World Data Center for Geomagnetism (1932-present) and at GFZ Potsdam.
The Ap-index reached its smoothed (Meeus, 1958) minimum in April 2020, only 4 months after sunspot minimum. Since SC17, this minimum typically occurs between 4 to 15 months after sunspot minimum. The smoothed monthly Ap has continued to increase and is now of about the same value as the longtime Ap-average of SC17-24, as demonstrated by the graph above. The most recent smoothed value (August 2025) is 15.64 nT, the highest so far this solar cycle The values of the smoothed monthly Ap-index are expected to increase even further during the coming months, in view of the enhanced geomagnetic activity in November 2025 and January 2026.
The table underneath summarizes the highest monthly Ap-value per solar cycle (since 1932). Note how the highest values almost always happen in spring or autumn, an effect that is at least in part explained by Russell and McPherron (1973). Also, the highest Ap values usually occur 2 to 4 years after solar cycle maximum. This is most likely due to a combination of the number of equatorial coronal holes which maximizes during the declining phase of the solar cycle, and the occurrence of isolated but very active sunspot regions that still may occur during that time. Of note too is that there was not a single extremely severe geomagnetic storm (Kp = 9o, Ap = 400 nT) in SC24. The extremely severe geomagnetic storm of 10-11 May 2024 drove the May 2024 monthly Ap value to 23.56 nT, the highest since January 2005 (23.74 nT). Other months during SC25 with a high monthly Ap were June 2025 (21.43 nT), November 2025 (21.01 nT) and January 2026 (22.47 nT), which explains the currently observed rise of the smoothed monthly Ap-index.
| SC | Timing | Ap (nT) |
| 17 | March 1940 | 36.5 |
| 18 | September 1951 | 39.9 |
| 19 | September 1957 | 49.3 |
| 20 | April 1973 | 29.8 |
| 21 | September 1982 | 35.9 |
| 22 | June 1991 | 44.4 |
| 23 | October 2003 | 34.7 |
| 24 | September 2017 | 18.1 |
| 25 | May 2024 | 23.6 |
So far this solar cycle, high monthly Ap-values were reached in February and March 2023 (resp. 14.43 and 14.42 nT), as well as in September 2023 (14.20 nT).
- Minor geomagnetic storms on 3 and 4 February 2022 resulted in the loss of 38 Starlink satellites due to enhanced drag at the stand-by orbit at 210 km altitude (STCE newsitem ; Kataoka et al. 2022).
- A strong geomagnetic storm on 26-27 February 2023 affected drilling operations in Manitoba, Canada.
- During this and other strong storms such as on 23-24 March 2023 (Kp=8o), 23-24 April 2023 (Kp=8+), and 5 November 2023 (Kp=7+), problems with satellite-based navigation systems were reported by pilots (civil aviation).
The strongest storm so far during SC25 occurred on 10-11 May 2024 when Kp reached 9o ("extremely severe") during several intervals. This event and the related SWx impacts were discussed in depth in the STCE newsflash and newsitem. The Mother's Day storm -naming as proposed by E-SWAN- was the first extremely severe storm (Kp = 9o ; Ap = 400 nT) since the Halloween storms from 29-30 October 2003. Space weather impacts were as follows:
- Spaceweather.com reported that aurora were observed at low latitudes (around 20°) such as from Mexico, Hawaii and Puerto Rico (faint).
- Disturbances in HF Com for aviation were observed (Tamitha Skov).
- GNSS problems were recorded in various applications (agriculure / precise farming , some aviation applications , erratic behaviour of drones).
- Power grid networks had taken their precautions and were all in all doing well (Power ; this STCE newsitem).
- Satellite systems were holding on (atmospheric drag), but at their limits (Starlink).
- The geomagnetic storm also affected subsea compasses (Space.com).
The second strongest storm of SC25 took place on 10-11 October 2024 reaching severe storming levels (Kp = 9-, Ap = 300 nT ; see this STCE newsitem). This storm was less severe than the one from May 2024, but still had some important impacts (STCE newsitem).
- Aurora were observed and/or photographed as far south as California and Texas in the United States, and from Italy and Greece in Europe, as well as South-Africa and Australia (Spaceweather.com).
- GNSS was again not available over North-America (WAAS), for no less than 16 hours! Complete black-out of this GNSS application has only occurred once before since its start-up in 2007, the first time being 10-11 May 2024...
- HF Com, already affected during the preceding X-class flares (Tamitha Skov), was again impacted, in particular during the days after the storm when the upper portion of the high frequencies (HF; 3-30 MHz) was depressed at some locations and for certain intervals.
- Belgian radio meteor observers from the BRAMS network (Belgian RAdio Meteor Stations ; see this STCE newsitem for more info on BRAMS) recorded considerable noise in their radio displays hampering a good detection of any radio signature from a passing meteor.
- Geostationary satellites such as GOES were exposed to the turbulent solar wind for about 10 hours, complicating spacecraft operations and research.
- The increased atmospheric drag seems to have advanced the re-entry from a Starlink satellite at very low earth orbit by 10 days (Oliveira et al. 2025). ESA moved some satellites up in their orbits, to avoid premature re-entry (SWARM ; ESA-communication).

To put things in perspective, the graph above shows for every year since 1932 the number of days during which the Kp-index reached severe or extremely severe geomagnetic storming levels during at least one 3-hour interval. These are represented respectively by the orange and darkbrown bars (Data source: GFZ Potsdam). Most prominent is the absolute lack of any extreme geomagnetic storm from 2004 until 2023. Strong geomagnetic storms were recorded on 1 January, 16 April and 1 June and 12 November 2025 , and 19-20 January 2026 (see the links to the STCE newsitems and newsletter). The November 2025 and January 2026 geomagnetic storms both reached a Kp = 9-, so almost extremely severe. The November 2025 storm had numerous space weather impacts (STCE newsitem), but also the January 2026 storm got considerable attention for its very fast CME (25 hours transit time), the extreme solar wind conditions that were reached, and the "dancing" green proton aurora that were observed (STCE newsitem).
Dst-index
The Disturbance storm-time index Dst (Sugiura, 1964) is designed to measure the magnetic signature of magnetospheric currents, in particular -but not restricted to- the ring current. Dst is computed using 1-hour values of the horizontal H-component by four low latitude observatories (list at ISGI) sufficiently distant from the auroral and equatorial electrojets to inhibit noise from these two sources. The values are expressed in nT and mostly negative in case of a strong geomagnetic disturbance, as the enhanced ring current tends to counteract (weaken) the Earth's magnetic field. The Dst index is derived and maintained by the World Data Center for Geomagnetism at Kyoto, Japan (WDC Kyoto; 1957-present).
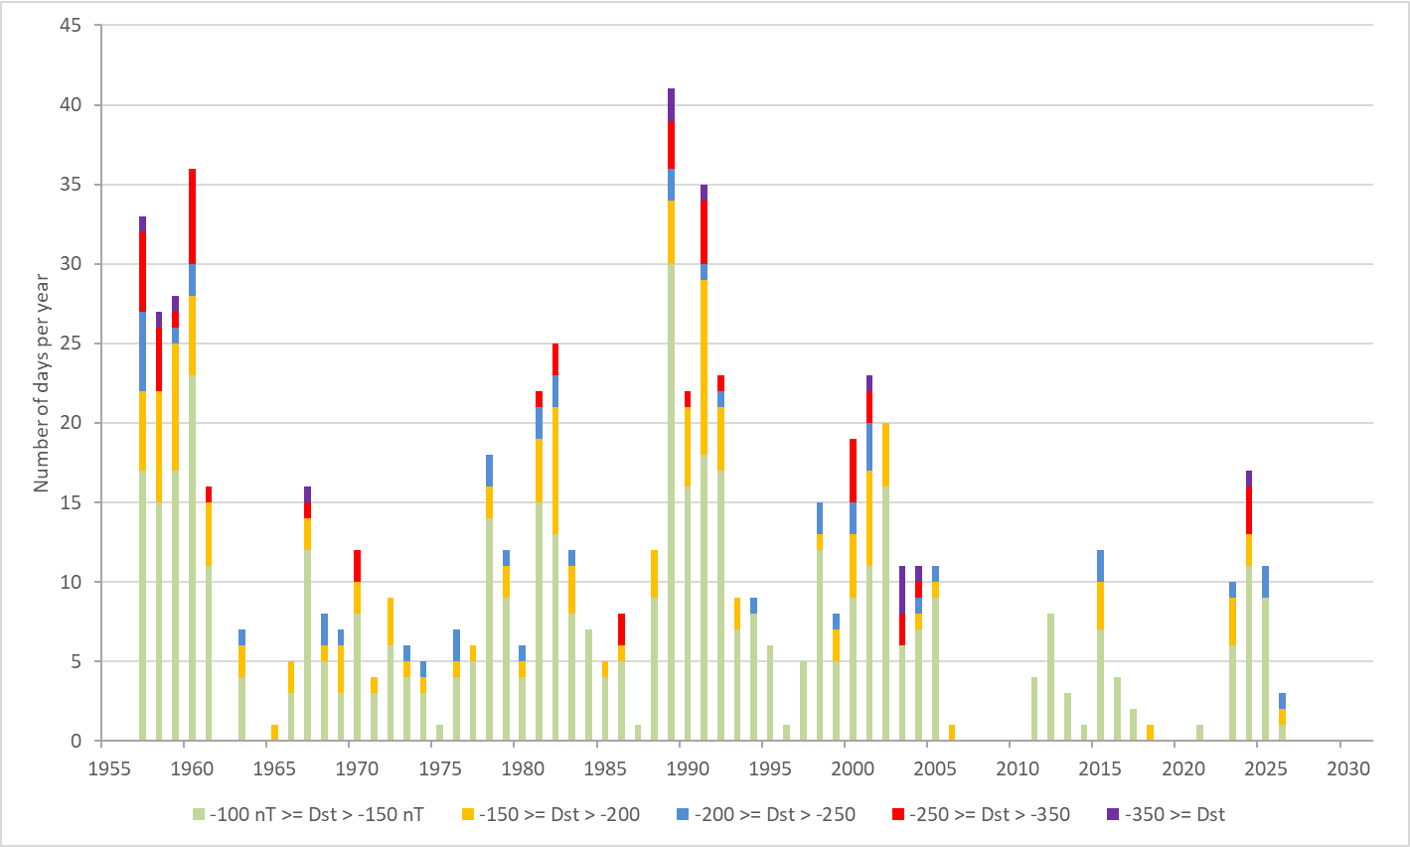
Since its inception in 1957, there have been around 700 days with at least one 1-hour interval during which the Dst index reached -100 nT or lower (more negative, i.e. stronger). These numbers have been grouped in 5 bins, as displayed in the graph above. There are only 13 days when a Dst < -350 nT was reached. Note the very weak SC24. So far, SC25 has 42 entries in this graph. Strong events took place on 23-24 April 2023 (Dst = -213 nT), 12 August 2024 (-188 nT), 10-11 October 2024 (-333 nT), 1 January 2025 (-212 nT) , 12 November 2025 (-217 nT) , and 20 January 2026 (-236 nT).
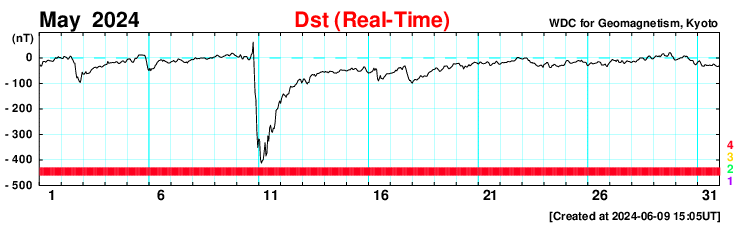
The strongest event was of course the 10-11 May 2024 geomagnetic storm, when the Disturbance storm-time index (Dst) reached a preliminary value of -406 nT on 11 May (graph), ranking itself as the 7th day with the most negative Dst value since the measurements started in 1957 (WDC Kyoto). It dwarfs the strongest storm of the previous solar cycle, the St-Patrick's Day storm of 17 March 2015 (-234 nT). See this table with the 20 strongest storms since the start of the Dst measurements in 1957.

The graph above shows days with strong/severe and great storms in terms of Dst since the start of the measurements in 1957, represented by respectively the pink and purple bars (see also Dst terminology). Again, the drought in strong geomagnetic activity from 2005 till 2023 is eye-catching.
The > 2 MeV Electron fluence
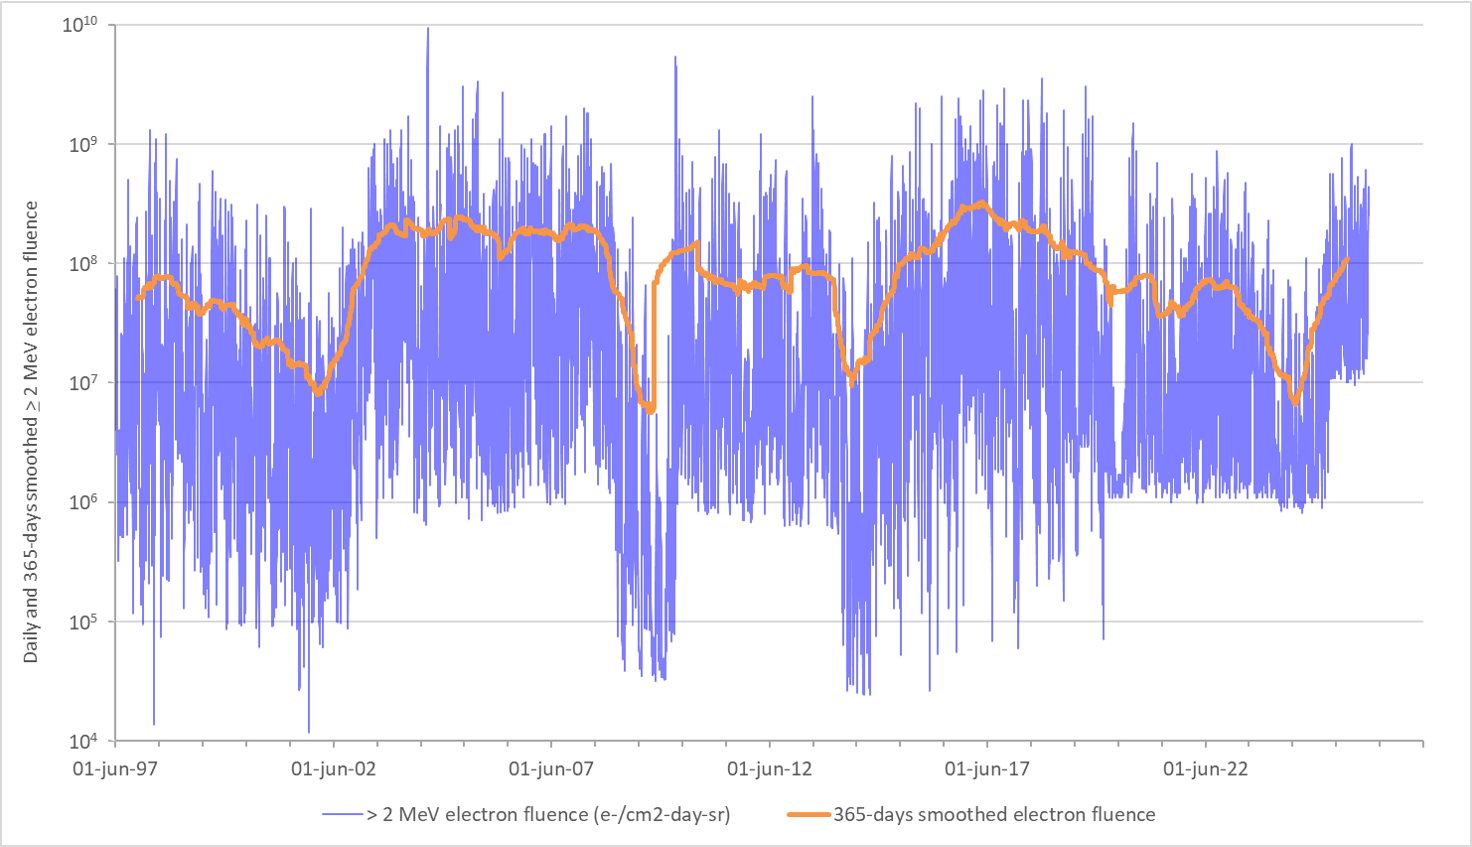
The > 2 MeV electron flux in the outer radiation belt can be significantly influenced by strong interplanetary CMEs and high speed solar wind streams (HSS) impacting the Earth’s magnetosphere (Kavanagh and Denton, 2007 ). It is measured by the GOES satellites (NOAA/SWPC) in their geostationary orbit, which is located in the Earth’s outer radiation belt. High fluxes of energetic electrons are associated with a type of spacecraft charging referred to as deep-dielectric charging, which may eventually result in anomalous behaviour of the spacecraft systems and in their temporary or permanent loss of functionality. See the SWx Classification page for more info and terminology.
Because the > 2 MeV electron flux at geostationary orbit has diurnal variations, a daily value of the electron fluence which is an accumulation over 24h of the electron flux, in units of electrons / (cm2 sr day) is in use. Fluence values greater than 5 . 107 electrons / (cm2 sr day) are indicative of adverse space weather conditions hazardous to geosynchronous satellites. Fluence values in excess of 5 . 109 electrons / (cm2 sr day) are considered to be very high (see NRCan).
The graph above shows the daily electron fluence (blue) and the 365-days smoothed electron flunce (orange - see also Poblet et al, 2020) since mid-1997. The data were obtained from NOAA/SWPC's The Weekly, which is online and archived. The highest electron fluence since 1997 was recorded on 29 July 2004, when it reached a value of 9.3 . 109 electrons / (cm2 sr day).
From 2003 to 2008, and again from 2015-2019, elevated fluence levels were recorded because of the declining phase of the solar cycle when (equatorial) coronal holes and the extensions of polar coronal holes are most numerous. The two dips early 2002 and mid 2014 mark solar cycle maximum when the polar magnetic fields were reversing their polarity and coronal holes were pretty much absent and in the process of being recreated. In 2009, the electron fluence was relatively low compared to previous years because of the deep minimum during the SC23-SC24 transition when both the solar wind speed and the sunspot number were at very low levels. During the most recent minimum, there was also a dip in the electron fluence, but values remained an order of magnitude greater than in 2009. Note that the values for the electron fluence have been obtained by different GOES.
A period of enhanced (moderate to high) levels of electron fluence was recorded from 5 till 14 September 2022. Operators reported numerous satellite glitches at the end of the period, in particular a few days after maximum fluence on 8 September. This shows again the importance of the electron accumulation effect on the satellite's instruments. The 365-days smoothed electron fluence has reached a minimum during the June 2024 timeframe. This heralds the return of large coronal holes in the coming years renewing the deep-dielectric charging threat to satellites. Some large coronal holes with associated high-speed solar wind streams have been observed during the last few months, e.g. late September 2025 (STCE newsitem ), May-June 2025 (STCE newsitem), and the first half of 2025 (STCE newsitem), as well as during the December 2025-February 2026 timeframe.
Cosmic rays
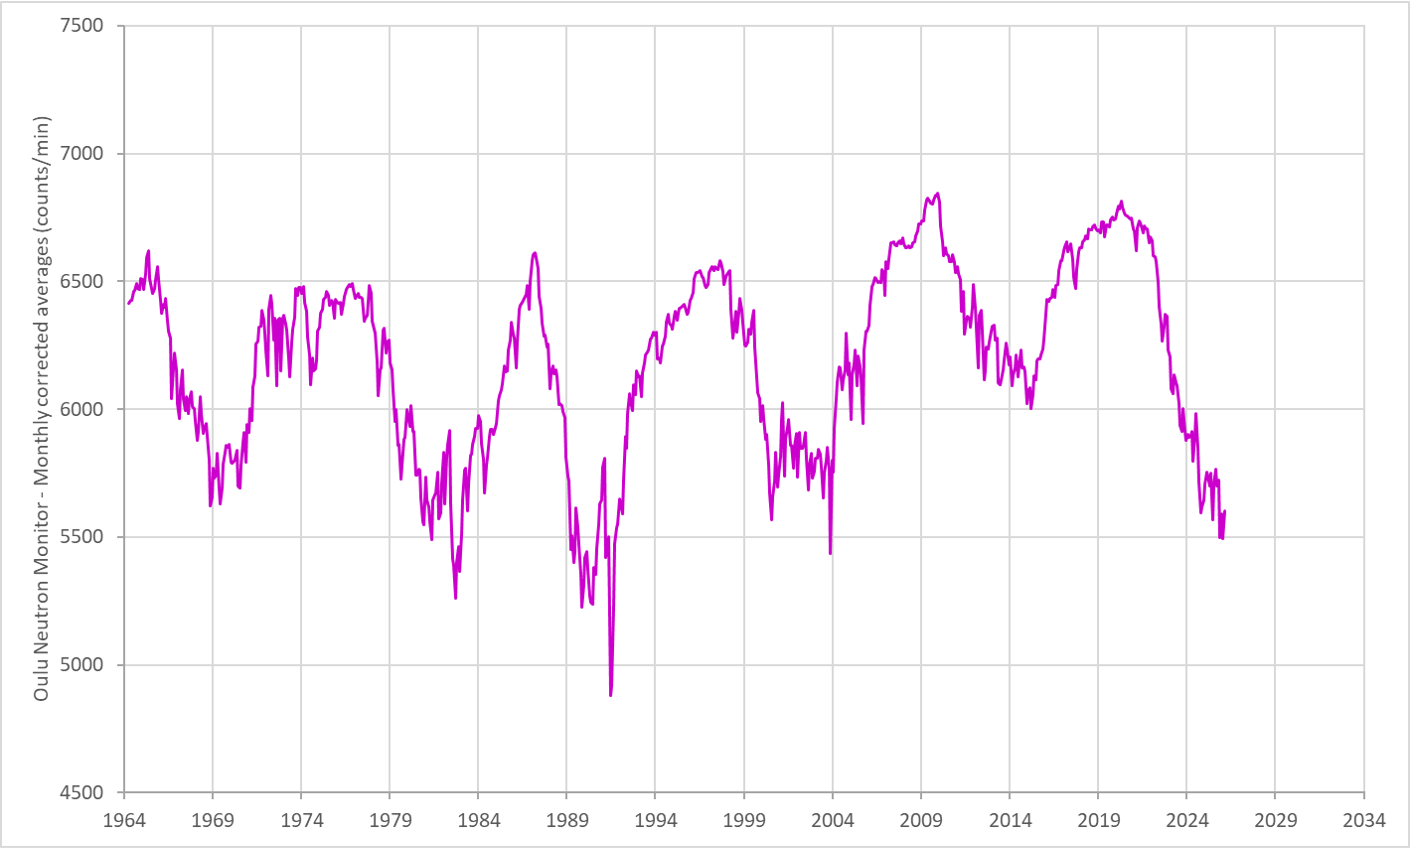
When galactic cosmic rays (GCR) or high-energetic (> 500 MeV) solar protons interact with particles in the Earth's upper atmosphere, the created secondary particles can reach all the way down to the Earth's surface where they can be measured by e.g. neutron monitors such as in Dourbes, Belgium (see also the NMDB as well as GLEs on the Oulu webpage). Different neutron monitors give different neutron counts, which is due to different instrumentation, different sensitivities and cut-off rigidity (i.e. a quantitative measure of the shielding provided by the Earth's magnetic field against CR particles).
The evolution of the neutron counts anti-correlate with the solar cycle activity. During a solar cycle maximum, the turbulent solar wind and the continued series of CMEs provide sort of a magnetic shield against the GCR, and neutron counts are at their lowest. During solar cycle minimum, this magnetic shield is much less prominent allowing the GCR an easier access to the earth environment and thus resulting in elevated neutron counts. See this STCE newsitem for more information.
The graph above shows the evolution of the (unsmoothed) monthly neutron count (counts/minute ; corrected for air pressure and efficiency) as monitored by the Cosmic Rays station of the University of Oulu, Finland. This station has one of the longest running databases for this parameter, starting in 1964. Current evolution of the neutron counts (decreasing) shows the effect of the increased solar activity of the last few years, thus keeping more of the cosmic rays away from the Earth.
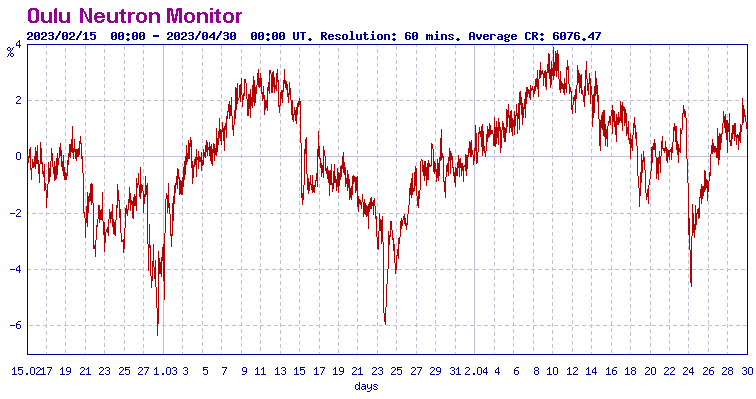
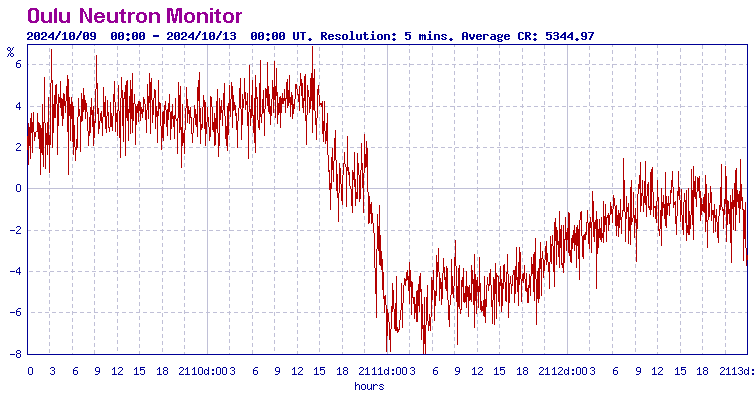
Since the enhanced solar activity that started in December 2022, average monthly neutron count rates have dropped by more than 700 units (from around 6200 to less than 5500 counts/min) as measured at Oulu (see the above graph). This dip is more pronounced than the minimum observed during the previous solar cycle, reflecting higher solar activity. In fact, the dip is very similar to the one from the more active solar cycle 23. The 3 strong geomagnetic storms in February, March and April 2023 were all associated with important Forbush decreases of about 4 to 6% (Oulu chart). The strongest Forbush decrease took place on 19 January 2026, with a drop of just over 20%. The second strongest (but brief) Forbush decrease happened on 23-24 March 2024 and reached 15% (chart). An event of similar strength but lasting for several days took place on 1-2 June 2025 (chart) following a severe geomagnetic storm. The Forbush decreases associated with the 10-11 May and the 10-11 October 2024 geomagnetic storms were weaker and similar in strength (about 11%), but the latter was shorter-lived.
