- Table of Content
- 1.Broccoli, anyo...
- 2.Review of sola...
- 3.Review of geom...
- 4.PROBA2 Observa...
- 5.The Internatio...
- 6.Noticeable Sol...
- 7.Geomagnetic Ob...
- 8.The SIDC space...
- 9.Action!
2. Review of solar activity
3. Review of geomagnetic activity (29 Aug 2022 - 4 Sep 2022)
4. PROBA2 Observations (29 Aug 2022 - 4 Sep 2022)
5. The International Sunspot Number by SILSO
6. Noticeable Solar Events (29 Aug 2022 - 4 Sep 2022)
7. Geomagnetic Observations at Dourbes (29 Aug 2022 - 4 Sep 2022)
8. The SIDC space weather briefing
9. Action!
Broccoli, anyone?...
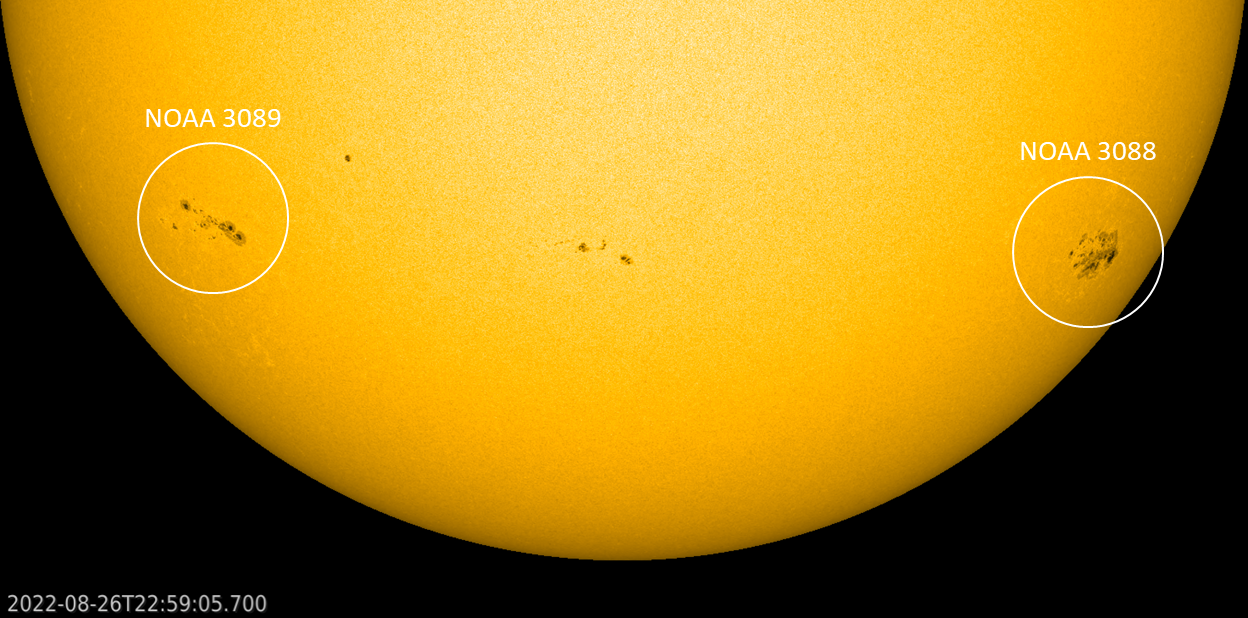
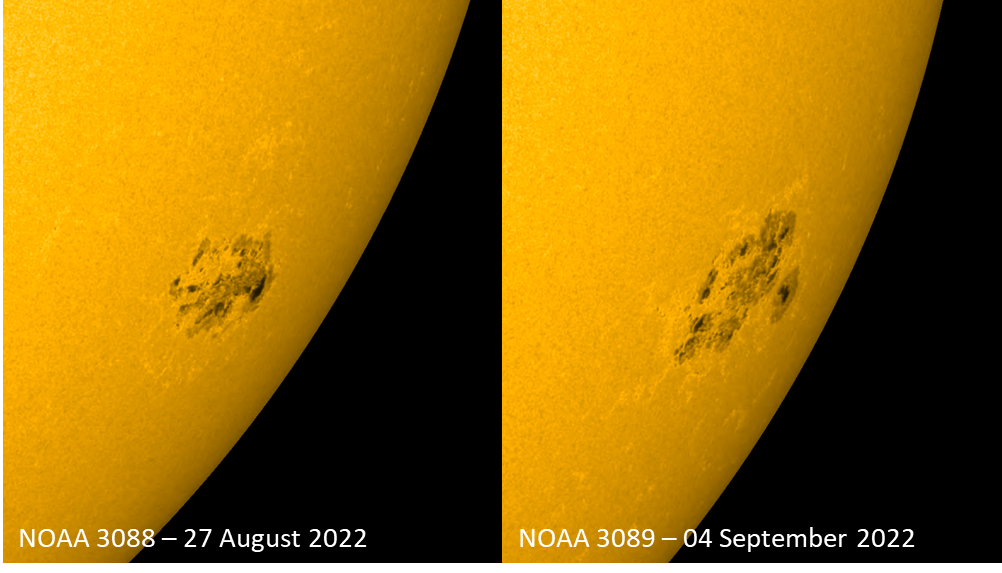
Two relatively large sunspot groups developed on the solar disk this week. NOAA 3088 started its development on 24 August in the southwest quadrant. NOAA 3089 had a different evolution. After an initial growth spurt on 24-26 August near the southeast solar limb, it grew only slowly until 2 September when it restarted to gain substantial sunspot area. For both active regions, maximum sizes were estimated (because close to the limb and fast developing) to be respectively around 3 and 4 times the total surface area of the Earth. The SDO/HMI (https://sdo.gsfc.nasa.gov/data/aiahmi/ ) imagery underneath show the location of the regions on 26 August and around their maximum size just before they were about to round the southwest limb. Movie clips can be found in the online version of this newsitem at https://www.stce.be/news/602/welcome.html
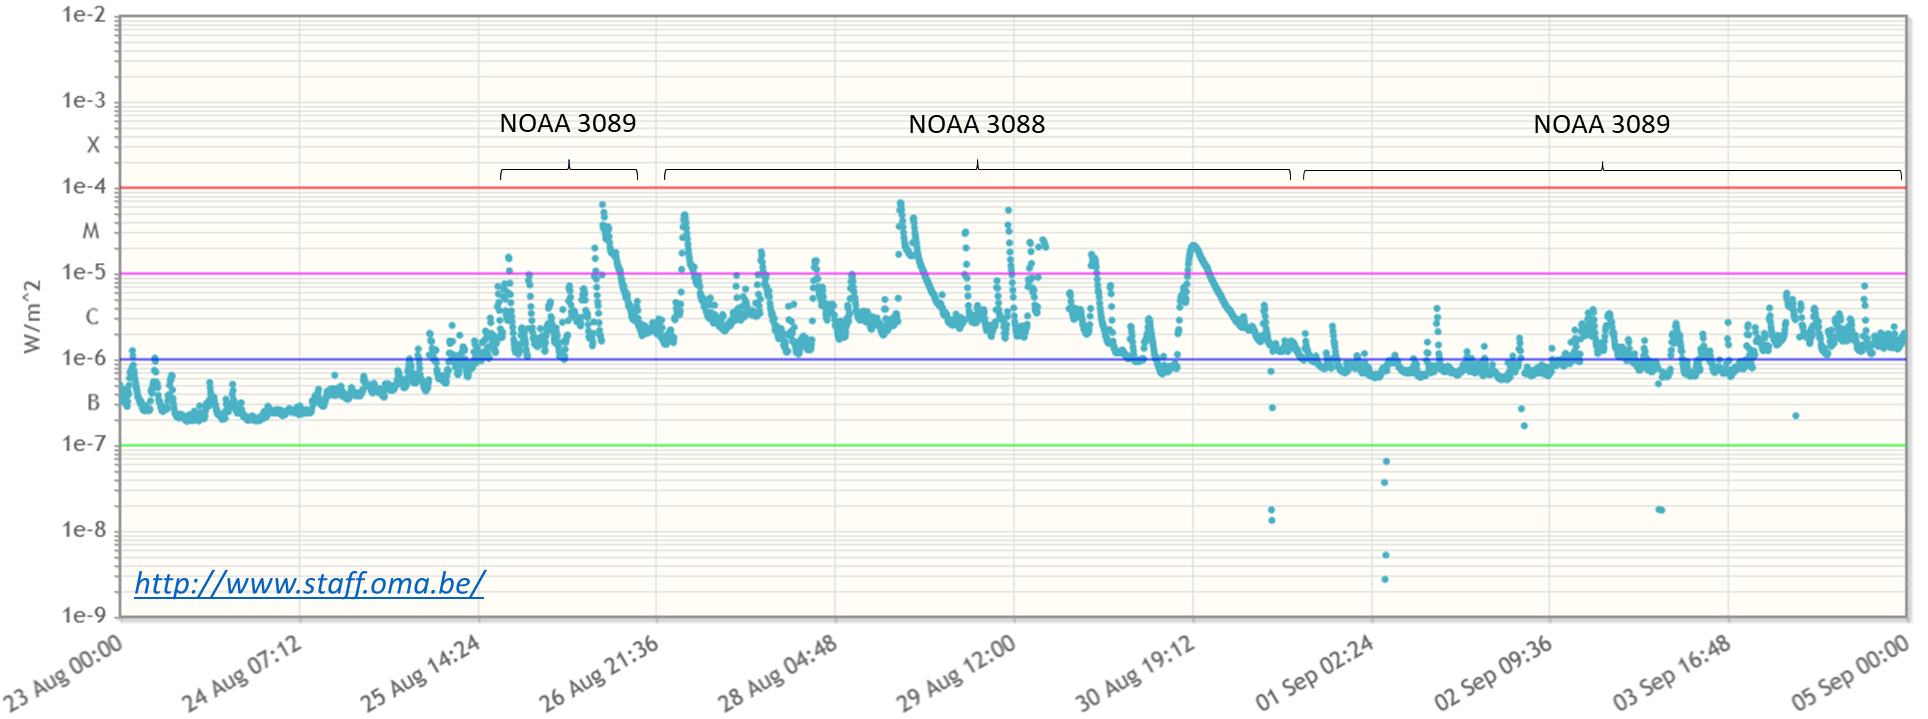
Despite their large size and magnetic complexity, it was only NOAA 3088 that produced a significant number of M-class ("medium-sized") flares, whereas NOAA 3089 -except for its initial development stage- got pretty much stuck in the C-class ("common") flaring range. The graph underneath was created with STAFF (http://www.staff.oma.be/ ) and shows the 5-minutes averaged GOES x-ray flux evolution from 23 August until 4 September included. The flare production by NOAA 3088 was clearly of a higher level than that by NOAA 3089, with 13 M-class flares between 27-30 August. Note that this sunspot region had already rounded the solar limb early on 29 August...
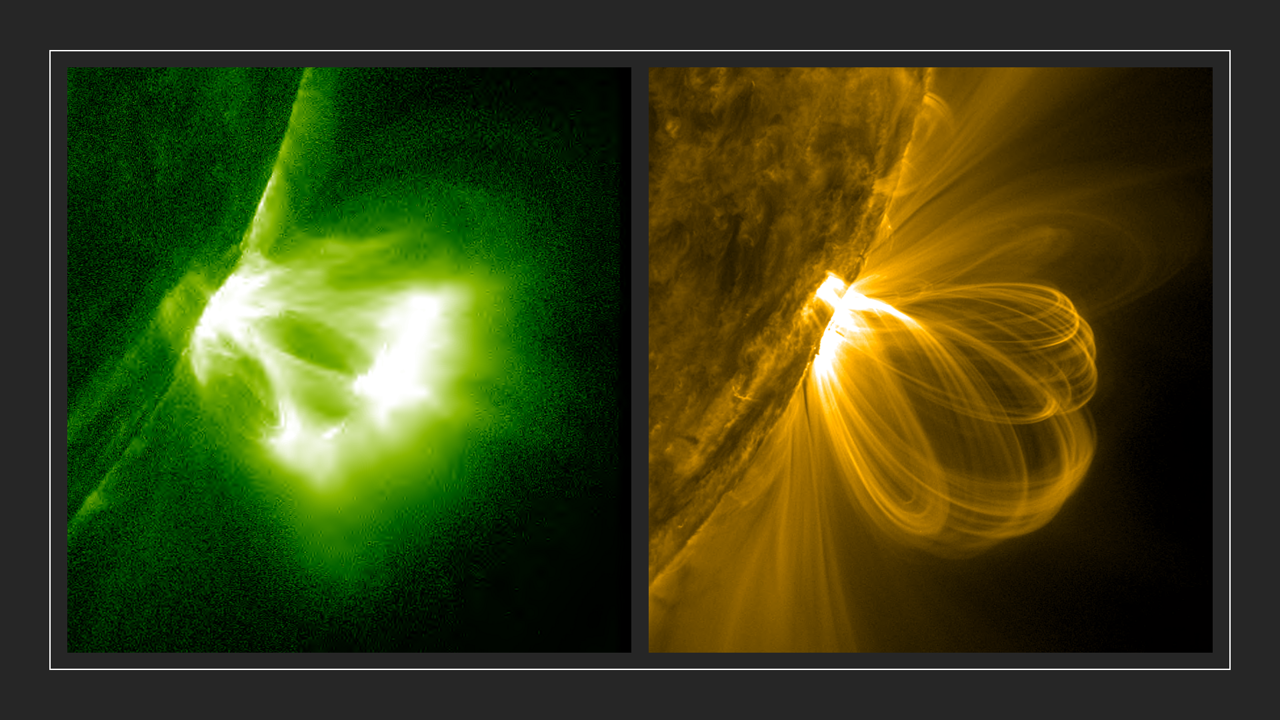
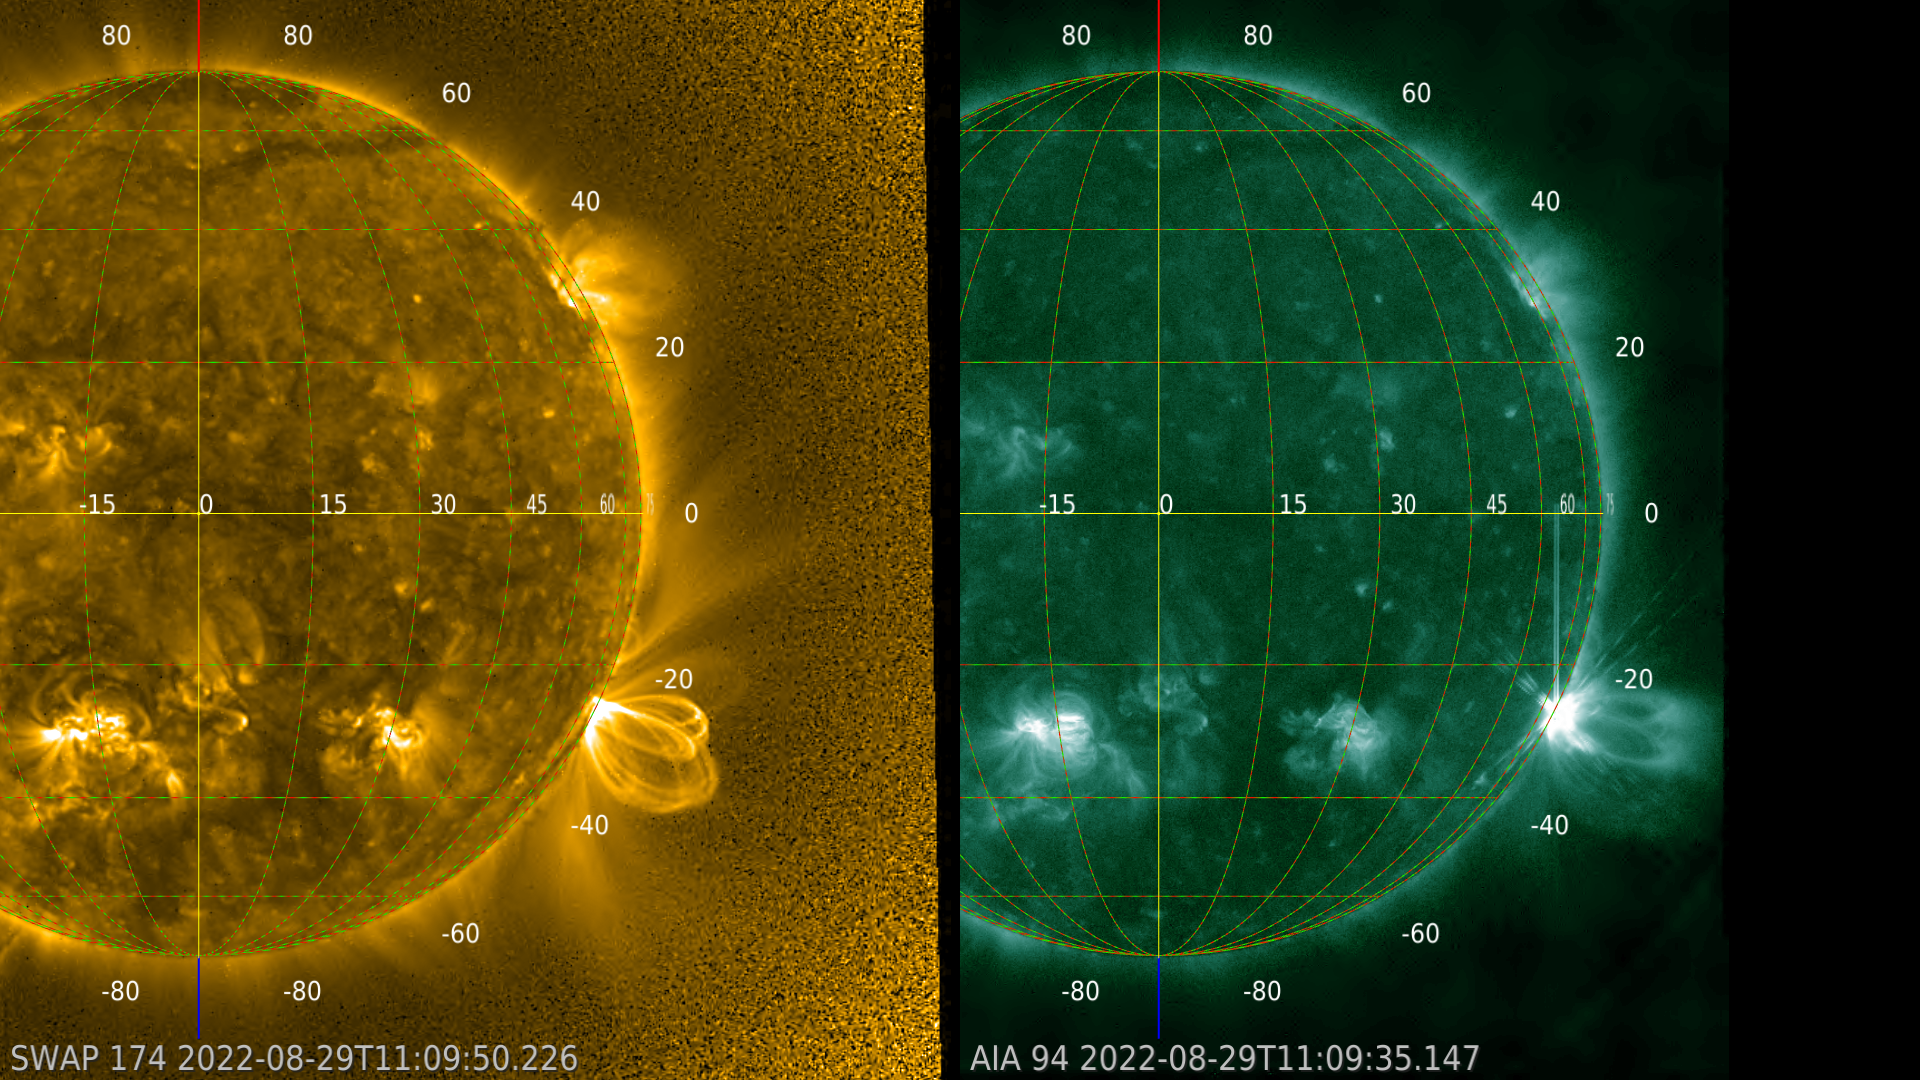
Flares were also the most spectacular with NOAA 3088. The SDO/AIA extreme ultraviolet (EUV) images underneath show coronal loops in AIA 094 (multi-million degrees) on the left and in AIA 171 (temperatures around 700.000 degrees) on the right following the strong M6.7 flare on 28 August (peak time at 16:19 UTC). Note that the green and yellow colors are artificial and meant to distinguish between the different filters and temperatures. The images were taken on 29 August at resp. 00:09 and 07:57 UTC. The loops reached a height around 180.000 km, which is about half the average Earth-Moon distance. The event is so complex that the eyes may start associating the eruption with more familiar items, such as a stalk of broccoli (left) or a ball of spaghetti or yarn (right). This is a well-known psychological phenomenon called Pareidolia, and is the same as e.g. seeing familiar features such as "Mickey Mouse" in the clouds.
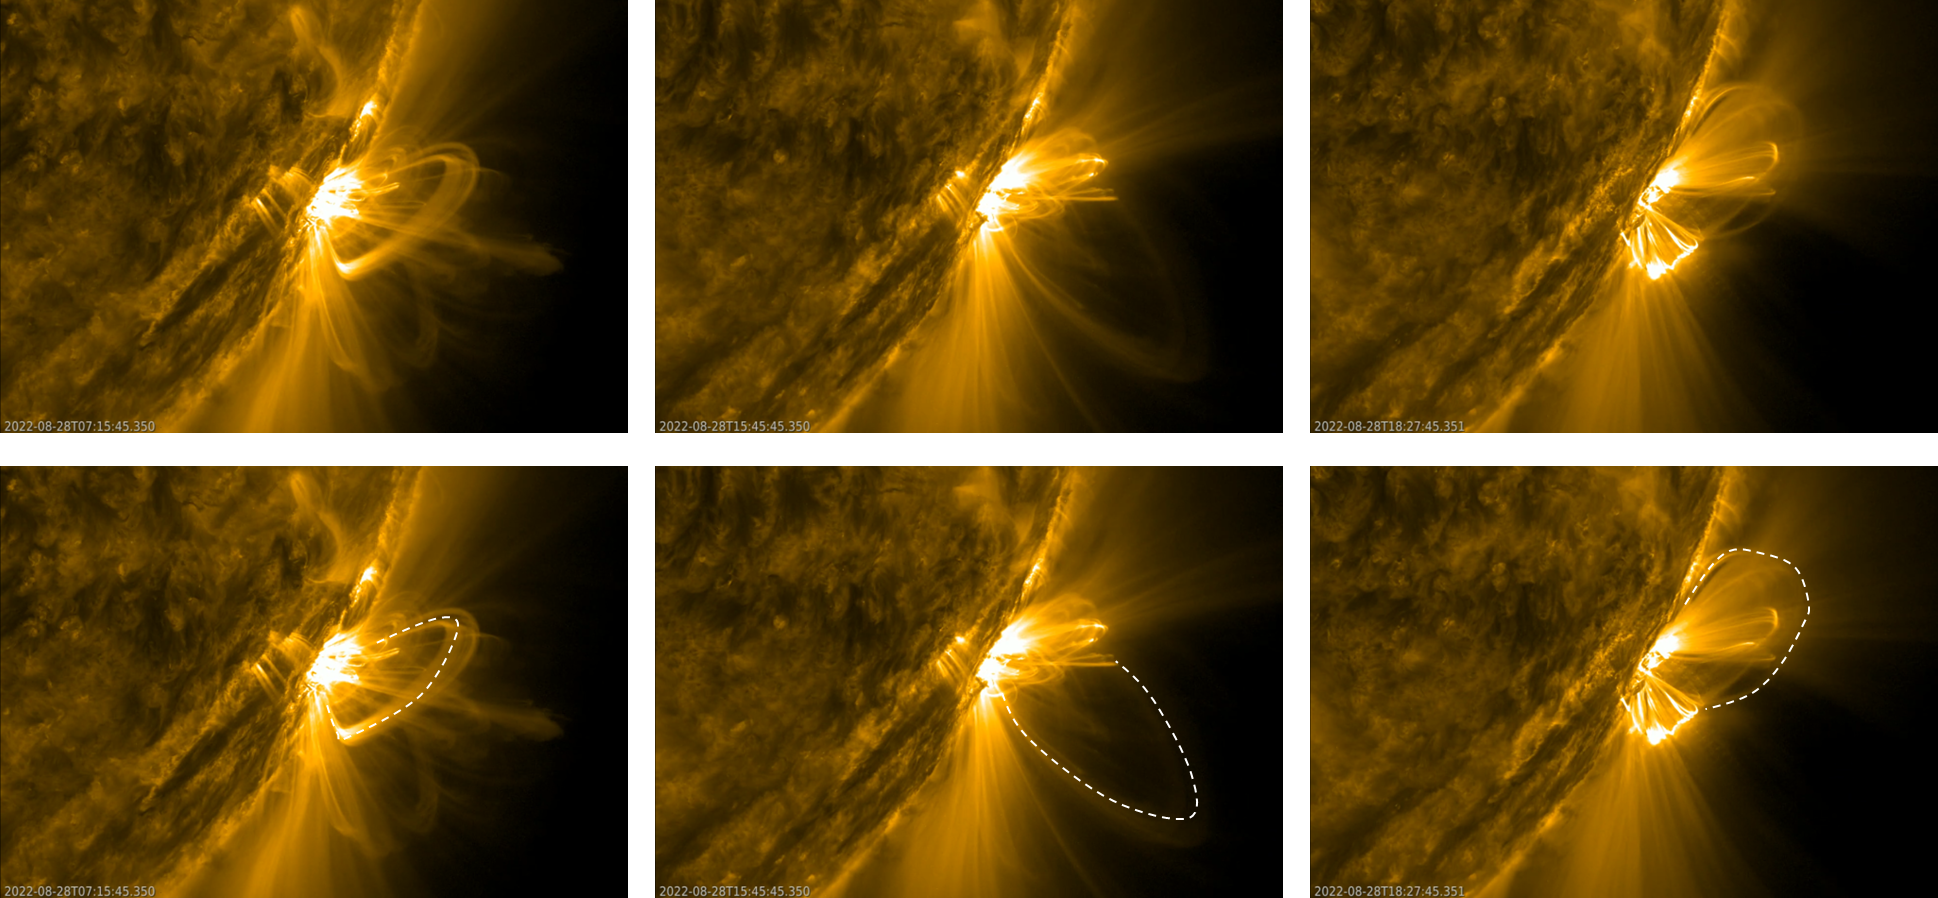
The AIA 171 images also revealed large overarching loop structures which broke up around the beginning of the eruption allowing material being ejected into space (see the online clip). The images underneath show these structures for some of the flaring events on 28 August: the C9.9 flare (peak at 07:48 UTC), the M6.7 flare (16:19 UTC) and the M4.6 flare (18:32 UTC). The annotated images have timings just prior to the break-up.
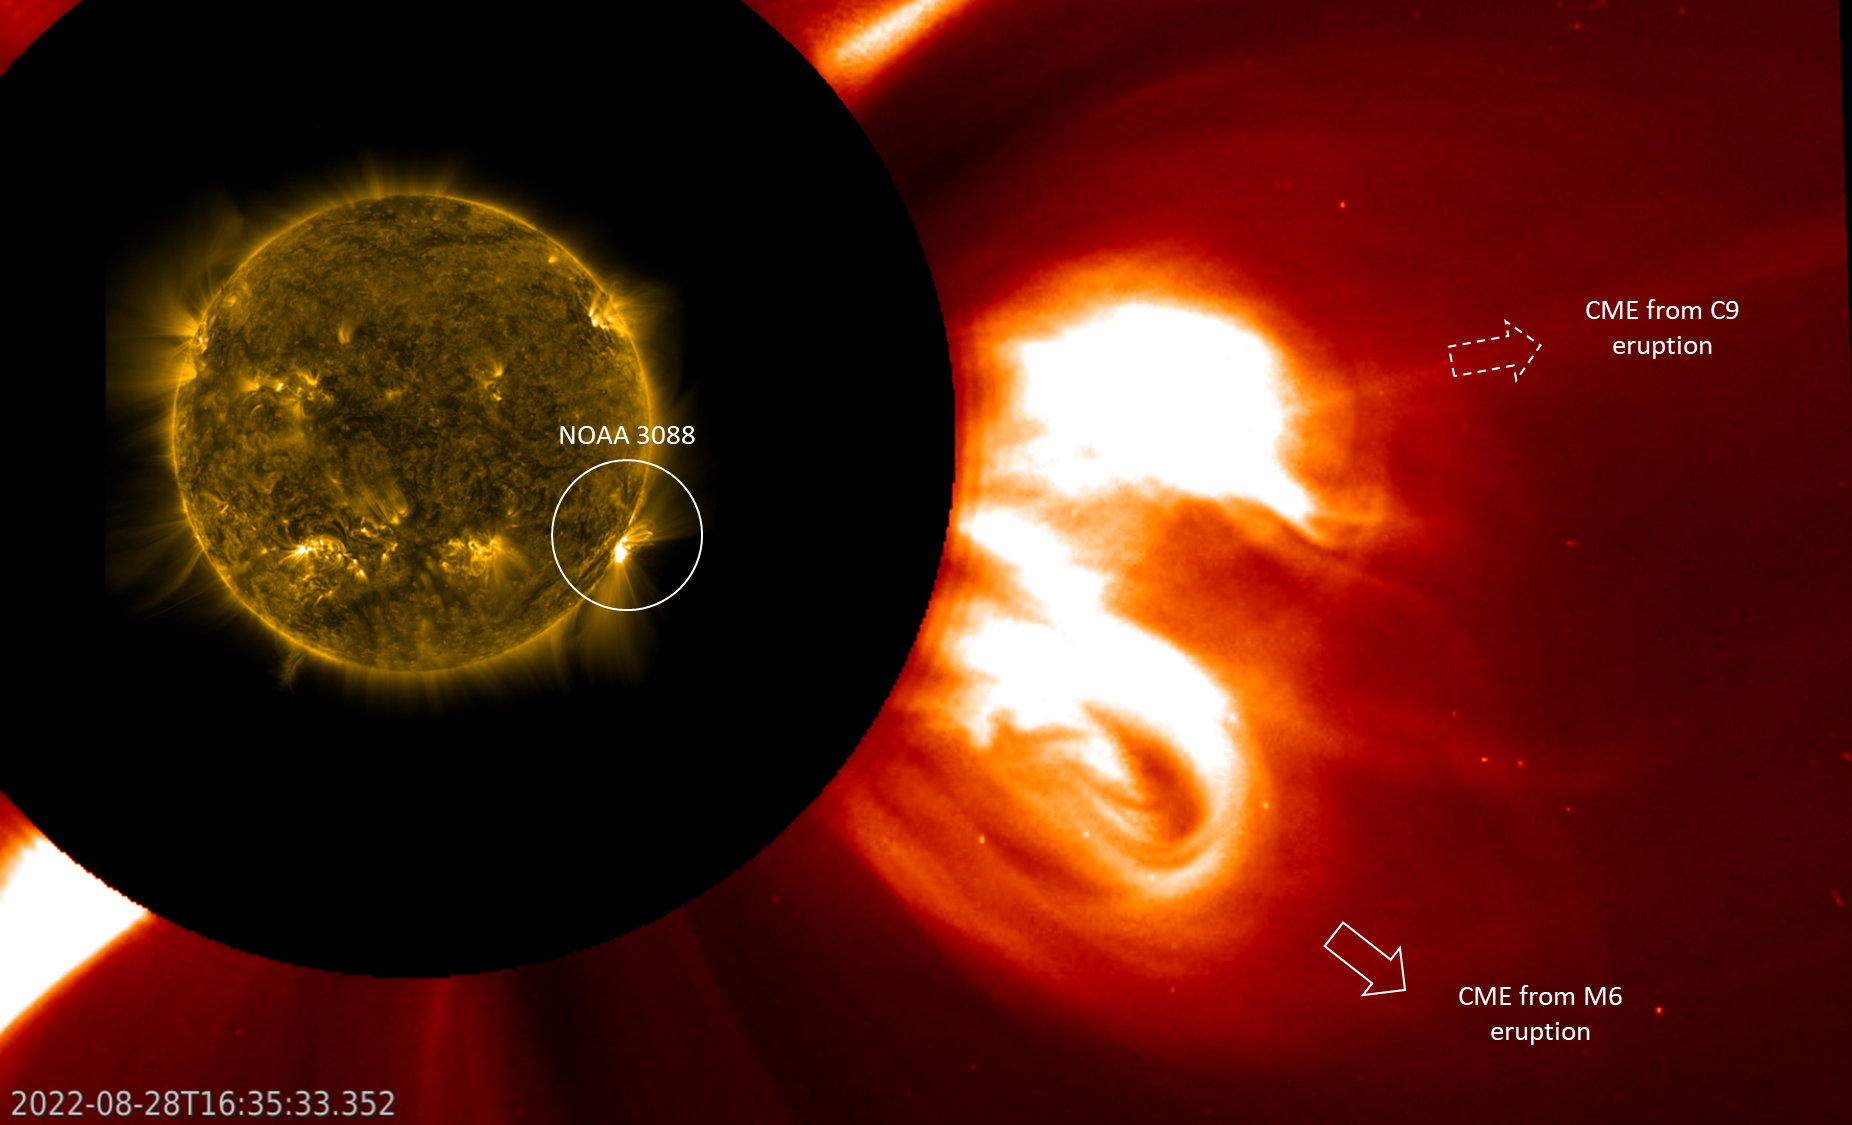
So it's no surprize that these eruptions were associated with coronal mass ejections (CMEs), as can be seen in the coronagraphic images underneath (SOHO/LASCO C2: https://soho.nascom.nasa.gov/ ) overlaid on the SDO/AIA 171 imagery. The C9 flare was associated with a slow moving CME that got kicked aside (a little bit) by the much more potent CME that was associated with the M6 flare. There was no obvious CME signature from the M4 eruption, which is thought to be embedded in the trailing portion of its predecessor.
Review of solar activity
Flares
Several active regions were observed through out the week: NOAA Active Regions (AR) 3085, 3086, 3087, 3088, 3089, 3090, 3091, 3092, 3093, 3094. They produced 49 C-class flares (the X-ray background was at the C level) and 8 M-class flares. At the beginning of the week, the activity was marked by NOAA AR 3088 (beta-gamma magnetic field configuration) that produced all the M-class flares. This AR rotated over the west limb on 30 August (but still produced M-class flares from behind the limb). During the second half of the week, the flaring activity was dominated by NOAA AR 3089 (beta-gamma-delta magnetic field configuration), but up to the C-class level only.
Coronal Mass Ejections (CME)
A CME erupted from NOAA AR 3088 (related to an M6.7 flare, close to the limb), on 28 August at 16:12 UT (as first seen by LASCO/C2). A full halo backsided CME was observed starting at 18:12 UT on 30 August (LASCO/C2), originating from NOAA AR 3088 already behind the west limb, associated with an M2.1 flare. A CME of about 70 degrees angular width and speed around 670 km/s was detected at 19:24 UT on 2 September. The CME originated from a filament eruption in the southeastern quadrant of the Sun, close to AR 3093.
Particles
The greater than 10 MeV proton flux was below the 10 pfu mark the full week. The greater than 2MeV electron flux was below the 1000 pfu threshold the full week, until 4 September when it increased due to the high speed stream arrival. The electron fluence was at nominal levels over the full week.
Review of geomagnetic activity (29 Aug 2022 - 4 Sep 2022)
Solar Wind disturbances at L1: CME Shocks
A weak shock was seen in the solar wind at 02:56 UT on 29 August, the magnetic field intensity jumped from 5 to 10 nT and the solar wind speed from 440 to 480 km/s. The shock was most likely driven by the CME from 26 August.
A jump in solar wind speed from 500 to 600 km/s was observed around 23:40 UT on 29 August, together with a spike in low energy electrons and protons at ACE. This could mark yet a second brief ICME glancing blow, expected from the CME of 27 August.
Another weak shock arrived on 31 August, related to the 28 August CME.
Solar Wind disturbances at L1: Coronal Holes
Also starting on 29 August, a high speed stream from the low latitudinal extension of the southern polar coronal hole arrived to the Earth (with speeds up to 600 km/s). The Earth was then under the combined influence of the previously described transients from 29 until 31 August.
On 3 September the solar wind speed started to increase, marking the early arrival of a high speed stream from a positive polarity equatorial coronal hole.
Geomagnetic response
The speed increased to reach 690 km/s on 4 September, with interplanetary magnetic field magnitude up to 12 nT, and with a Bz component between -5 and -10 nT.
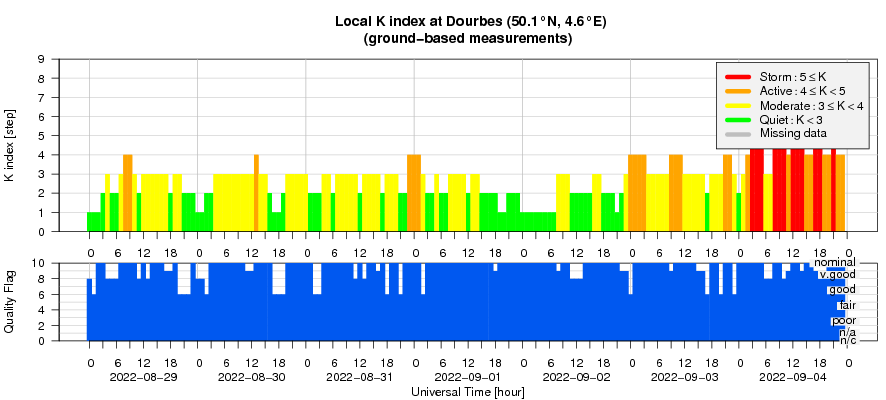
Geomagnetic conditions were up to active levels at the beginning of the week (29-31 August) due to the combined influence of the high speed stream and ICME arrivals (shocks and glancing blows). As a consequence of the high speed solar wind arrival on 3-4 September, moderate storm conditions were observed at planetary levels (Kp up to 6) and K_Dourbes reached 5.
PROBA2 Observations (29 Aug 2022 - 4 Sep 2022)
Solar Activity
Solar flare activity fluctuated from low to moderate during the week.
In order to view the activity of this week in more detail, we suggest to go to the following website from which all the daily (normal and difference) movies can be accessed: https://proba2.oma.be/ssa
This page also lists the recorded flaring events.
A weekly overview movie (SWAP week 649) can be found here: https://proba2.oma.be/swap/data/mpg/movies/weekly_movies/weekly_movie_2022_08_29.mp4.
Details about some of this week's events can be found further below.
If any of the linked movies are unavailable they can be found in the P2SC movie repository here: https://proba2.oma.be/swap/data/mpg/movies/.
Monday Aug 29

The largest flare of the week, an M8.6 flare, was observed by SWAP and LYRA. The flare was associated with NOAA AR3088, which was the only one producing M-class flares this week, even as it was rotating over the south-western limb on 2022-Aug-29. The bottom panels show SWAP (left) and AIA 94 (right) observations of the flare around its peak, which was at 11:08 UT. The flare was not associated with any major plasma outflows or CMEs, therefore it can be considered confined, leading only to the expansion of the overlying arcades.
Find a SWAP movie of the event here: https://proba2.sidc.be/swap/movies/20220829_swap_movie.mp4.
The International Sunspot Number by SILSO
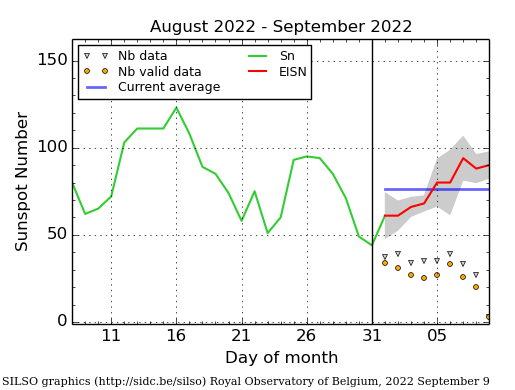
The daily Estimated International Sunspot Number (EISN, red curve with shaded error) derived by a simplified method from real-time data from the worldwide SILSO network. It extends the official Sunspot Number from the full processing of the preceding month (green line), a few days more than one solar rotation. The horizontal blue line shows the current monthly average. The yellow dots give the number of stations that provided valid data. Valid data are used to calculate the EISN. The triangle gives the number of stations providing data. When a triangle and a yellow dot coincide, it means that all the data is used to calculate the EISN of that day.
Noticeable Solar Events (29 Aug 2022 - 4 Sep 2022)
| DAY | BEGIN | MAX | END | LOC | XRAY | OP | 10CM | TYPE | Cat | NOAA |
| 29 | 0324 | 0338 | 0347 | S23W80 | M3.3 | SF | 3088 | |||
| 29 | 1048 | 1108 | 1112 | M8.6 | 3088 | |||||
| 29 | 1446 | 1456 | 1508 | M2.5 | III/1 | 3088 | ||||
| 29 | 1845 | 1857 | 1908 | M4.7 | 3088 | |||||
| 30 | 0158 | 0213 | 0224 | M1.5 | 3088 | |||||
| 30 | 1804 | 1929 | 2123 | M2.1 | 3088 |
| LOC: approximate heliographic location | TYPE: radio burst type |
| XRAY: X-ray flare class | Cat: Catania sunspot group number |
| OP: optical flare class | NOAA: NOAA active region number |
| 10CM: peak 10 cm radio flux |
Geomagnetic Observations at Dourbes (29 Aug 2022 - 4 Sep 2022)
The SIDC space weather briefing
The Space Weather Briefing presented by the forecaster on duty from Aug 28 to Sept 4. It reflects in images and graphs what is written in the Solar and Geomagnetic Activity report: https://www.stce.be/briefings/20220905_SWbriefing.pdf
If you need to access the movies, contact us: stce_coordination at stce.be
Action!
Check out our activity calendar: activities and encounters with the Sun-Space-Earth system and Space Weather as the main theme. We provide occasions to get submerged in our world through educational, informative and instructive activities.
If you want your event in our calendar, contact us: stce_coordination at stce.be
* September 24-25 Space Pole Open Days, Brussels, Belgium
* September 24: STCE lecture (Dutch) at Space Pole Open Days: Noorderlicht: hemelse wetenschap
* September 25: STCE lecture (Dutch) at Space Pole Open Days: Alarm, een zonnestorm op komst!
* October 11, Webinar: Putting the FAIR principles into practice: the journey of a GNSS data repository, GNSS@Royal Observatory of Belgium
* October 24-28, 18th European Space Weather Week, Zagreb, Croatia
* November 21-23, Space Weather Introductory Course - onsite, by the STCE, Brussels, Belgium - fully booked
* December 5, 6, 8, 9, Space Weather Introductory Course - online, by the STCE, zoom - fully booked
Check: https://www.stce.be/calendar