
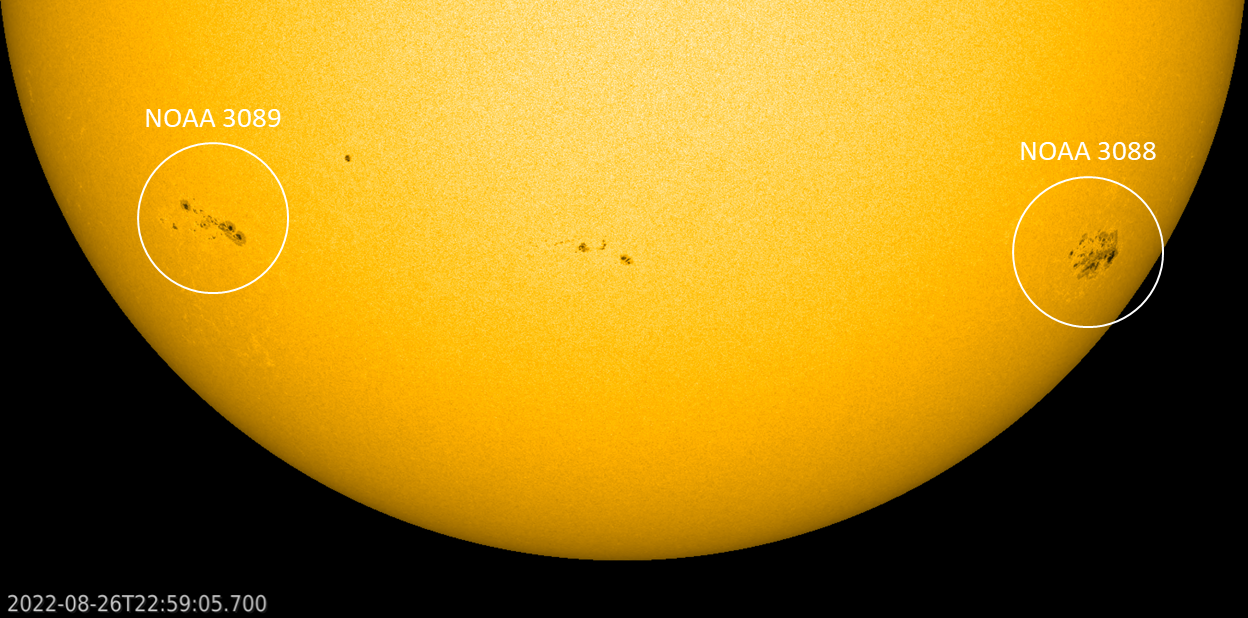
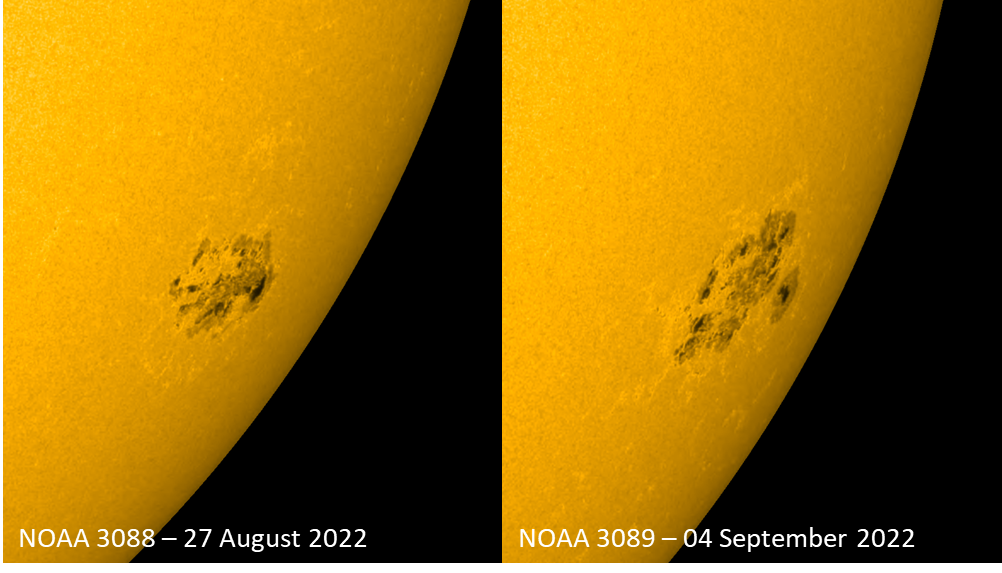
Two relatively large sunspot groups developed on the solar disk this week. NOAA 3088 started its development on 24 August in the southwest quadrant. NOAA 3089 had a different evolution. After an initial growth spurt on 24-26 August near the southeast solar limb, it grew only slowly until 2 September when it restarted to gain substantial sunspot area. For both active regions, maximum sizes were estimated (because close to the limb and fast developing) to be respectively around 3 and 4 times the total surface area of the Earth. The SDO/HMI imagery underneath show the location of the regions on 26 August and around their maximum size just before they were about to round the southwest limb. MOVIE clips: NOAA 3088, NOAA 3089.

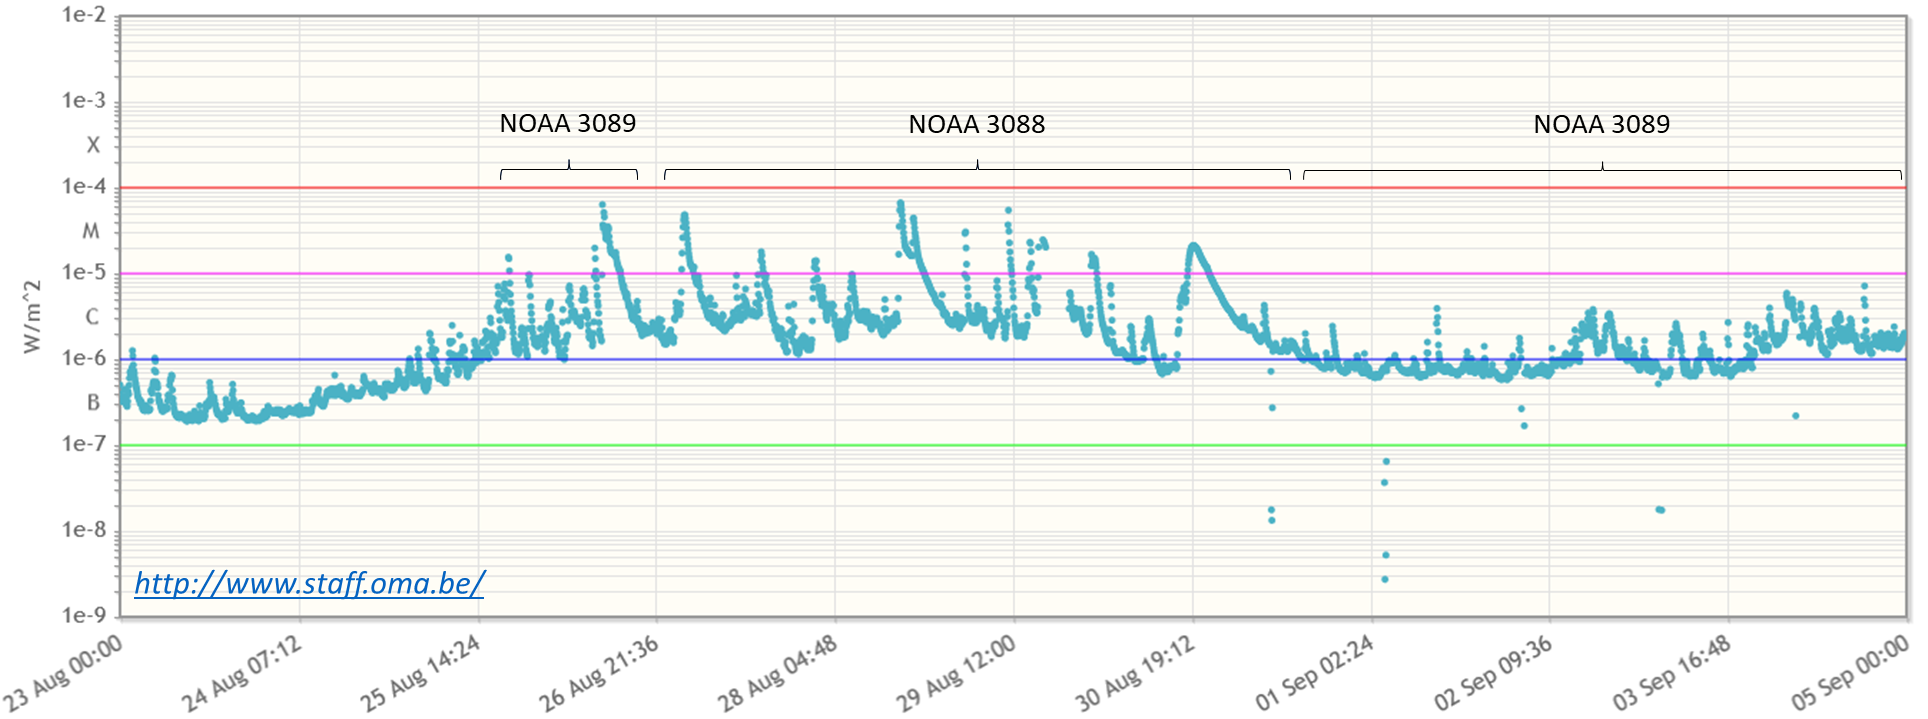
Despite their large size and magnetic complexity, it was only NOAA 3088 that produced a significant number of M-class ("medium-sized") flares, whereas NOAA 3089 -except for its initial development stage- got pretty much stuck in the C-class ("common") flaring range. The graph underneath was created with STAFF and shows the 5-minutes averaged GOES x-ray flux evolution from 23 August until 4 September included. The flare production by NOAA 3088 was clearly of a higher level than that by NOAA 3089, with 13 M-class flares between 27-30 August. Note that this sunspot region had already rounded the solar limb early on 29 August...
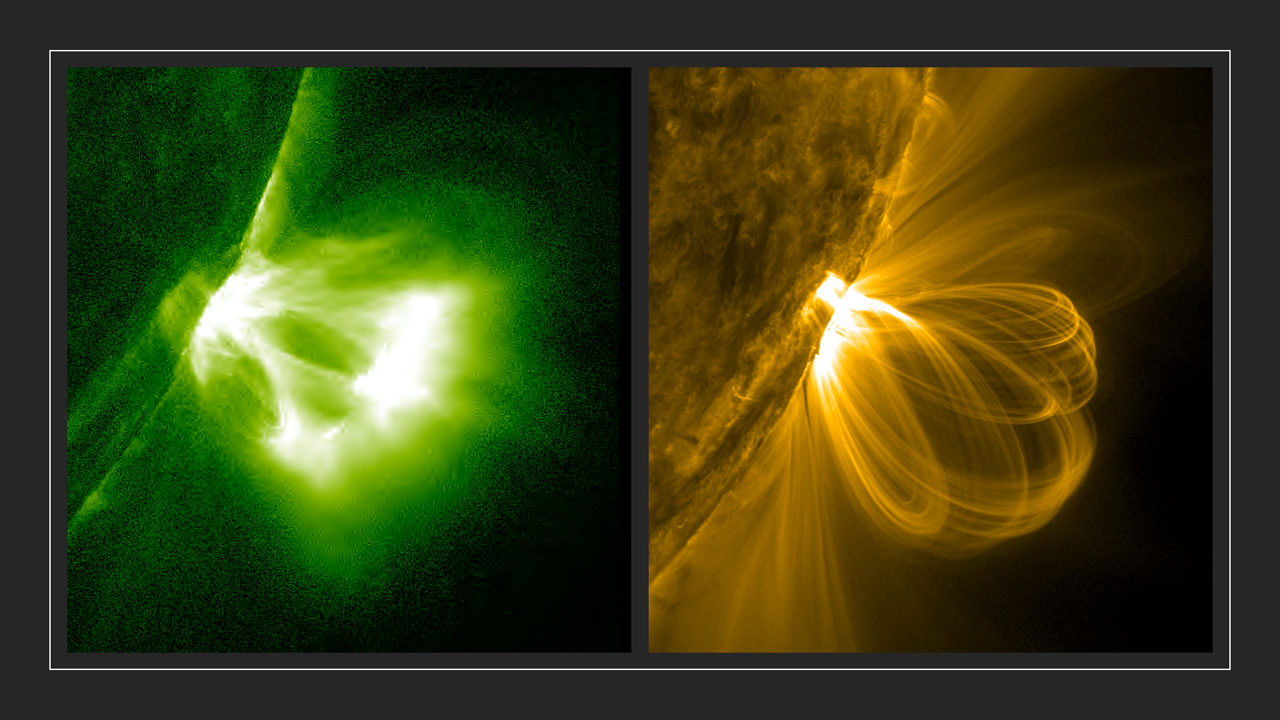
Flares were also the most spectacular with NOAA 3088. The SDO/AIA extreme ultraviolet (EUV) images underneath show coronal loops in AIA 094 (multi-million degrees) on the left and in AIA 171 (temperatures around 700.000 degrees) on the right following the strong M6.7 flare on 28 August (peak time at 16:19 UTC). Note that the green and yellow colors are artificial and meant to distinguish between the different filters and temperatures. The images were taken on 29 August at resp. 00:09 and 07:57 UTC. The loops reached a height around 180.000 km, which is about half the average Earth-Moon distance. The event is so complex that the eyes may start associating the eruption with more familiar items, such as a stalk of broccoli (left) or a ball of spaghetti or yarn (right). This is a well-known psychological phenomenon called Pareidolia, and is the same as e.g. seeing familiar features such as "Mickey Mouse" in the clouds.


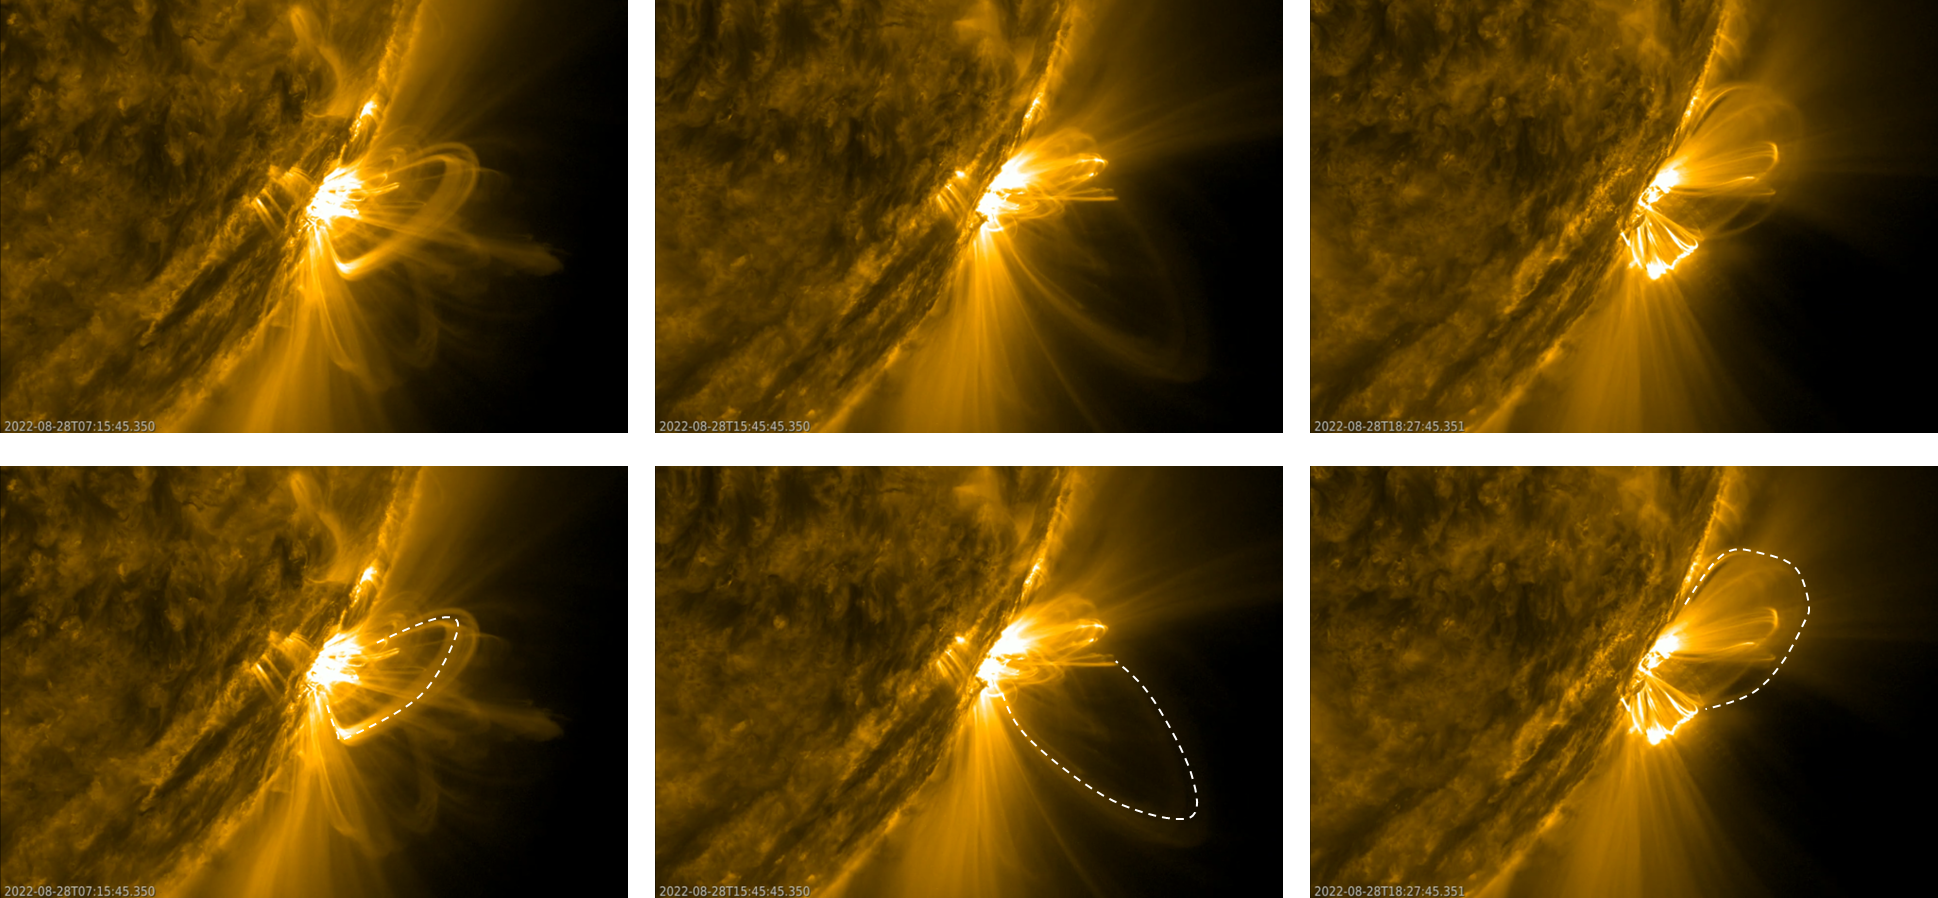
The AIA 171 images also revealed large overarching loop structures which broke up around the beginning of the eruption allowing material being ejected into space. The images underneath show these structures for some of the flaring events on 28 August: the C9.9 flare (peak at 07:48 UTC), the M6.7 flare (16:19 UTC) and the M4.6 flare (18:32 UTC). The annotated images have timings just prior to the break-up. The above movie clip by SDO/AIA 171 covers the three eruptions, the overarching loops, and the post-eruption coronal loops, while the SDO/AIA 094 clip only covers the 2 M-class eruptions.
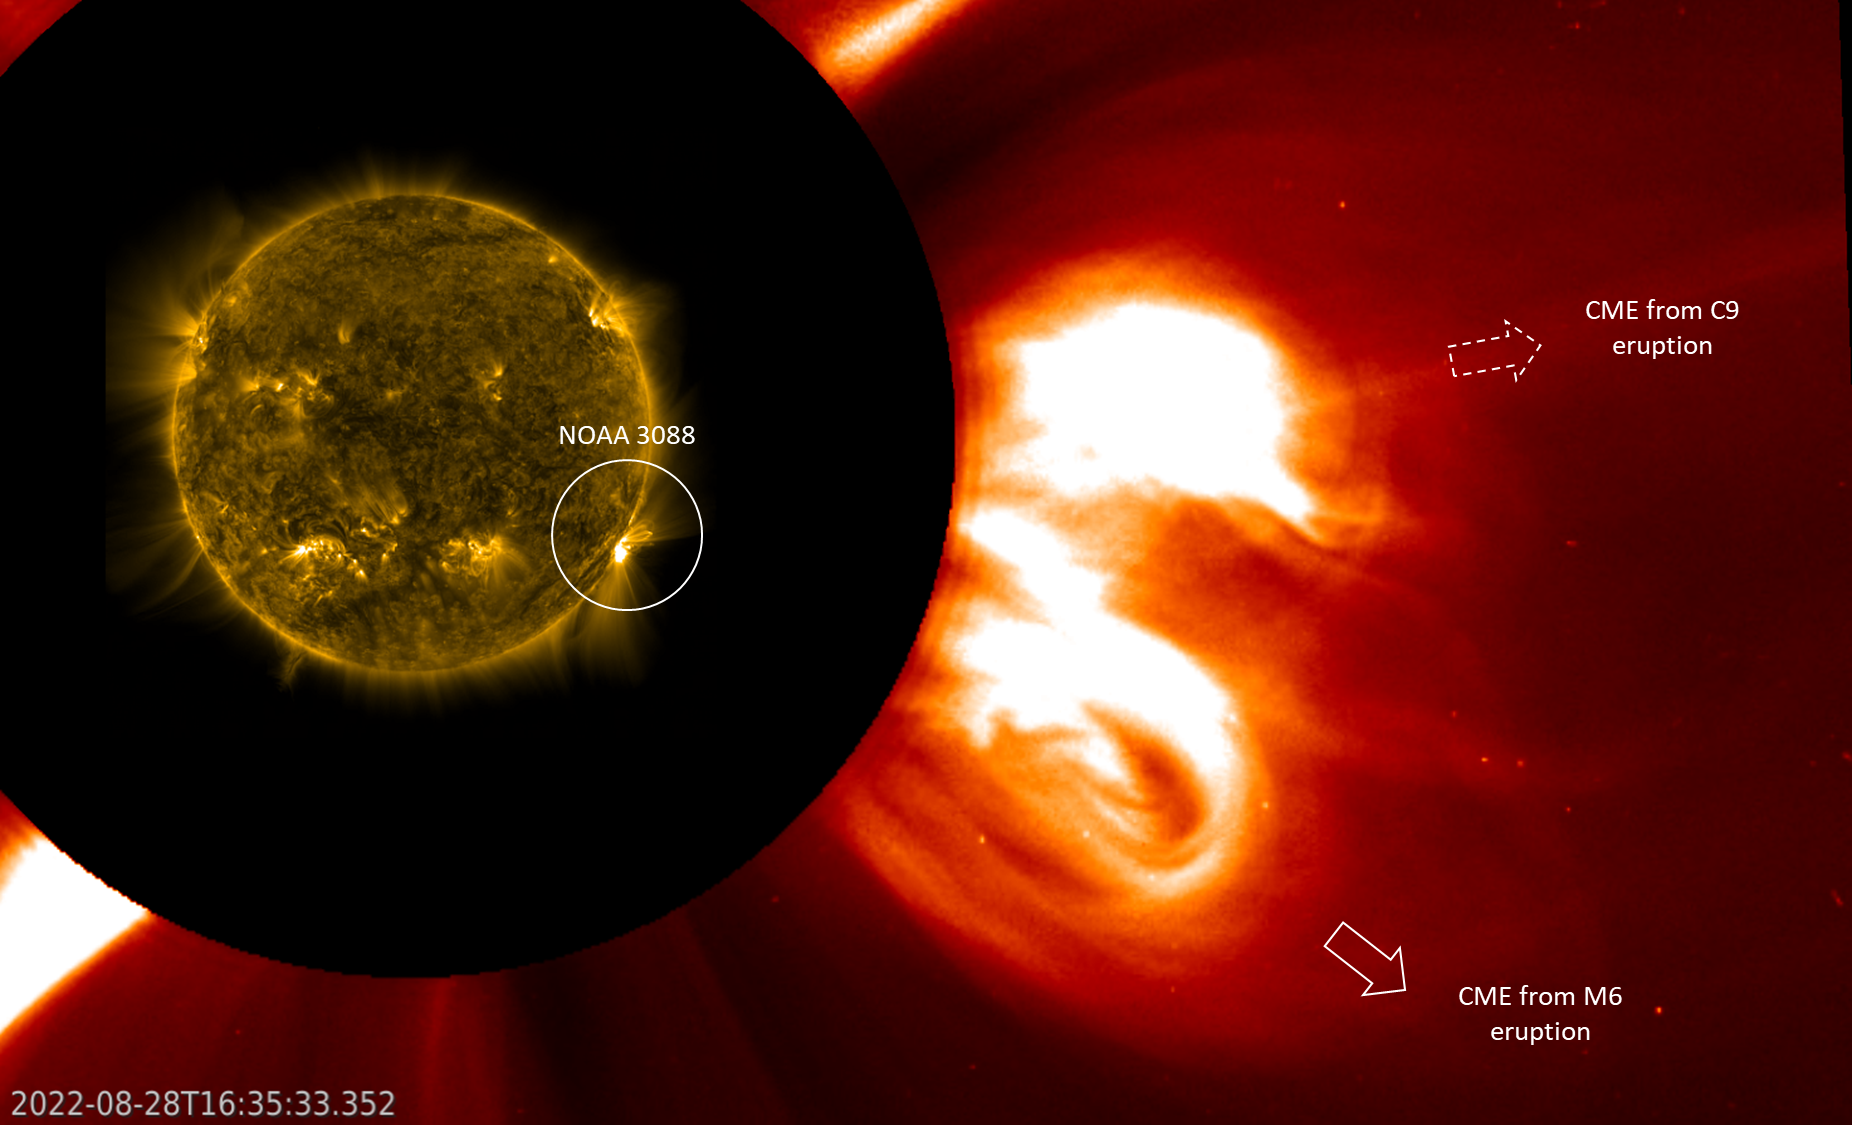
So it's no surprize that these eruptions were associated with coronal mass ejections (CMEs), as can be seen in the coronagraphic images underneath (SOHO/LASCO C2) overlaid on the SDO/AIA 171 imagery. The C9 flare was associated with a slow moving CME that got kicked aside (a little bit) by the much more potent CME that was associated with the M6 flare. There was no obvious CME signature from the M4 eruption, which is thought to be embedded in the trailing portion of its predecessor.
