- Table of Content
- 1.Happy New Year...
- 2.Monthly sunspo...
- 3.The Internatio...
- 4.Review of sola...
- 5.Noticeable Sol...
- 6.PROBA2 Observa...
- 7.Review of geom...
- 8.Geomagnetic Ob...
- 9.The SIDC space...
- 10.Review of sola...
- 11.Noticeable Sol...
- 12.PROBA2 Observa...
- 13.Review of geom...
- 14.Geomagnetic Ob...
- 15.The SIDC space...
- 16.STCE activitie...
2. Monthly sunspot number exceeds 100!
3. The International Sunspot Number by SILSO
4. Review of solar activity (19 Dec 2022 - 25 Dec 2022)
5. Noticeable Solar Events (19 Dec 2022 - 25 Dec 2022)
6. PROBA2 Observations (19 Dec 2022 - 25 Dec 2022)
7. Review of geomagnetic activity (19 Dec 2022 - 25 Dec 2022)
8. Geomagnetic Observations at Dourbes (19 Dec 2022 - 25 Dec 2022)
9. The SIDC space weather briefing (19 Dec 2022 - 25 Dec 2022)
10. Review of solar activity (26 Dec 2022 - 1 Jan 2023)
11. Noticeable Solar Events (26 Dec 2022 - 1 Jan 2023)
12. PROBA2 Observations (26 Dec 2022 - 1 Jan 2023)
13. Review of geomagnetic activity (26 Dec 2022 - 1 Jan 2023)
14. Geomagnetic Observations at Dourbes (26 Dec 2022 - 1 Jan 2023)
15. The SIDC space weather briefing (26 Dec 2022 - 1 Jan 2023)
16. STCE activities
Happy New Year!

Monthly sunspot number exceeds 100!
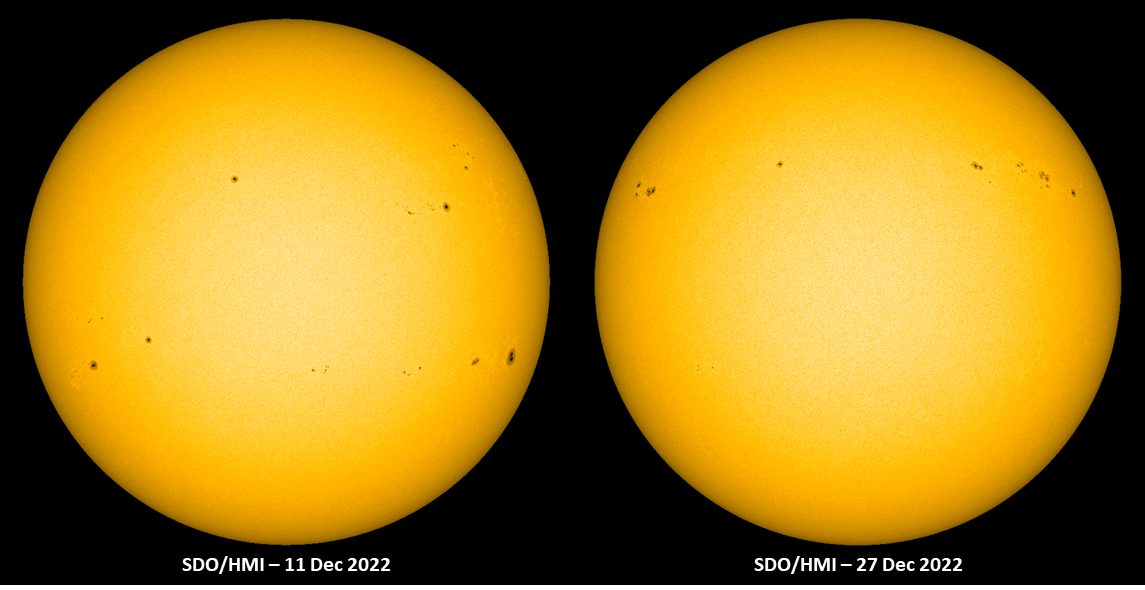
The provisional monthly International Sunspot Number for December 2022 reached a value of 113.1 (SILSO - https://www.sidc.be/silso/ ). For the ongoing solar cycle (SC25), this is the first time that a monthly sunspot number has exceeded the threshold of 100. The daily low was recorded on 1 December when the sunspot number was at 52 only, and the daily maximum sunspot number was recorded on 13 December when 158 was reached. Sunspot activity was dominated by the northern solar hemisphere for most of the month, except for the period from 11 till 21 December when most sunspots were observed on the southern hemisphere. This can be seen in the comparison imagery (SDO/HMI - http://sdo.gsfc.nasa.gov/data/aiahmi/ ) underneath showing the Sun on 11 and 27 December.
The graph underneath shows that the previous solar cycle (SC24) had already reached higher monthly sunspot numbers than SC25 over the same 3-years period, i.e. 36 months counting from the smoothed solar cycle minimum. For SC24 and 25, that minimum took place respectively in December 2008 and December 2019 (month "0" in the graph). In fact, SC24 had just passed its first solar cycle maximum and was about to start a long stable period of nearly 18 months before resuming activity and reaching a second, higher maximum early 2014. Of note is that the most recent smoothed monthly sunspot numbers are slightly higher in SC25 than in SC24, i.e. respectively 81.0 in June 2022 vs. 77.2 in June 2011. This is most likely due to the enhanced solar activity during the first half of 2022, before a more or less stable period of about 5 months ensued with monthly sunspot numbers between 70 and 95.
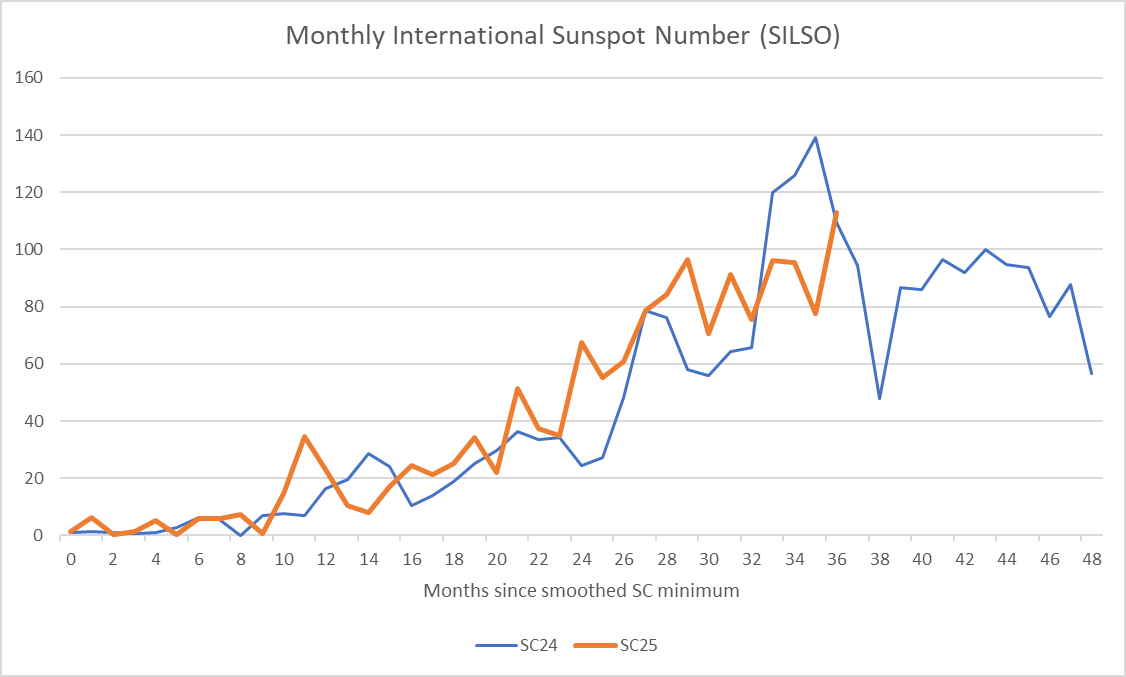
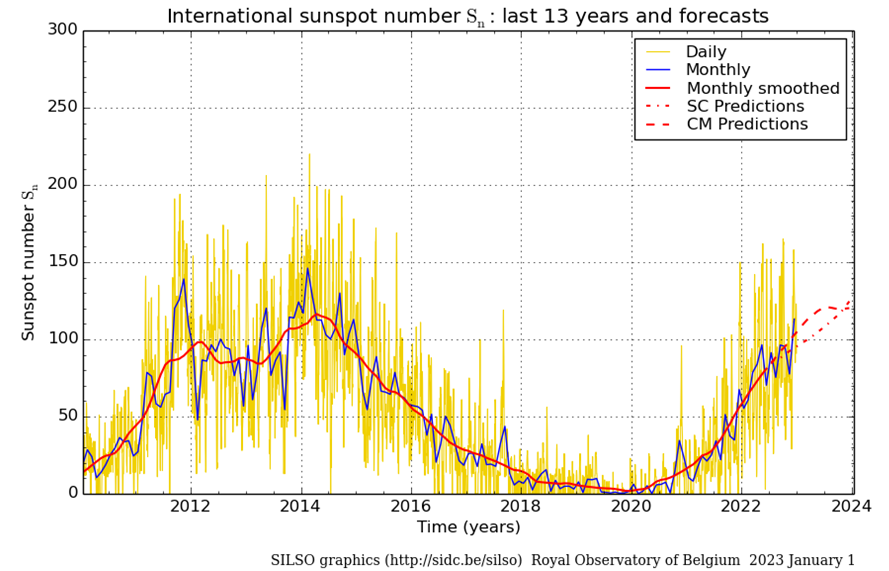
The maximum of solar cycle 25 is still expected for 2024, and may possibly be higher than originally predicted (see the STCE's SC25 Tracking page at https://www.stce.be/content/sc25-tracking ). However, it remains to be seen if this will be a single maximum such as e.g. SC19, a clear double maximum such as e.g. in SC23 and SC24, or a broad cycle maximum with multiple maxima of nearly the same values such as during SC14 and SC16. The SILSO page at https://www.sidc.be/silso/ssngraphics has graphs with the latest sunspot numbers as well as with some predictions of the smoothed monthly sunspot number for the next 12 months. These predictions get monthly updated as a new data point (monthly sunspot number) becomes available.
The International Sunspot Number by SILSO
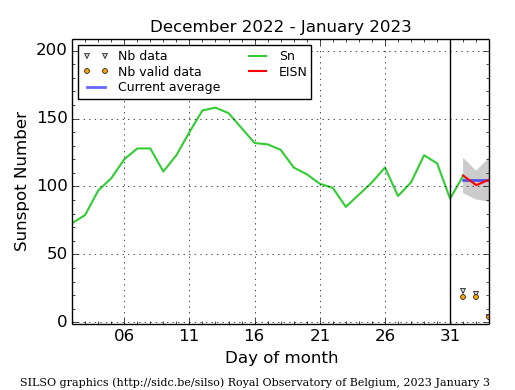
The daily Estimated International Sunspot Number (EISN, red curve with shaded error) derived by a simplified method from real-time data from the worldwide SILSO network. It extends the official Sunspot Number from the full processing of the preceding month (green line), a few days more than one solar rotation. The horizontal blue line shows the current monthly average. The yellow dots give the number of stations that provided valid data. Valid data are used to calculate the EISN. The triangle gives the number of stations providing data. When a triangle and a yellow dot coincide, it means that all the data are used to calculate the EISN of that day.
Review of solar activity (19 Dec 2022 - 25 Dec 2022)
Flaring activity
Over the past week, the solar flaring activity was at low levels with several C-class flares and one M-class flare. Several active regions were visible on the solar surface facing Earth, the most complex region was the sunspot region NOAA 3169 (with a beta-gamma magnetic complexity). This region produced several C-class flares, and the M1.1 flare peaking at 14:06 UTC on December 20. From the same region, a C6.9 flare peaking at 05:18 UTC on December 21 and a C7.8 flare peaking at 07:01 UTC on December 25 were associated with a Type II radio emission observed, which usually occurs in association with eruptions on the Sun and typically indicate a coronal mass ejection (CME) is associated with a flare event. At the end of the week, sunspot region NOAA 3172 and NOAA 3173 declined to Alpha magnetic complexity, NOAA 3170 and NOAA 3174 decayed into solar plages, and sunspot region NOAA 3169 evolved to a simple bipolar region (beta class).
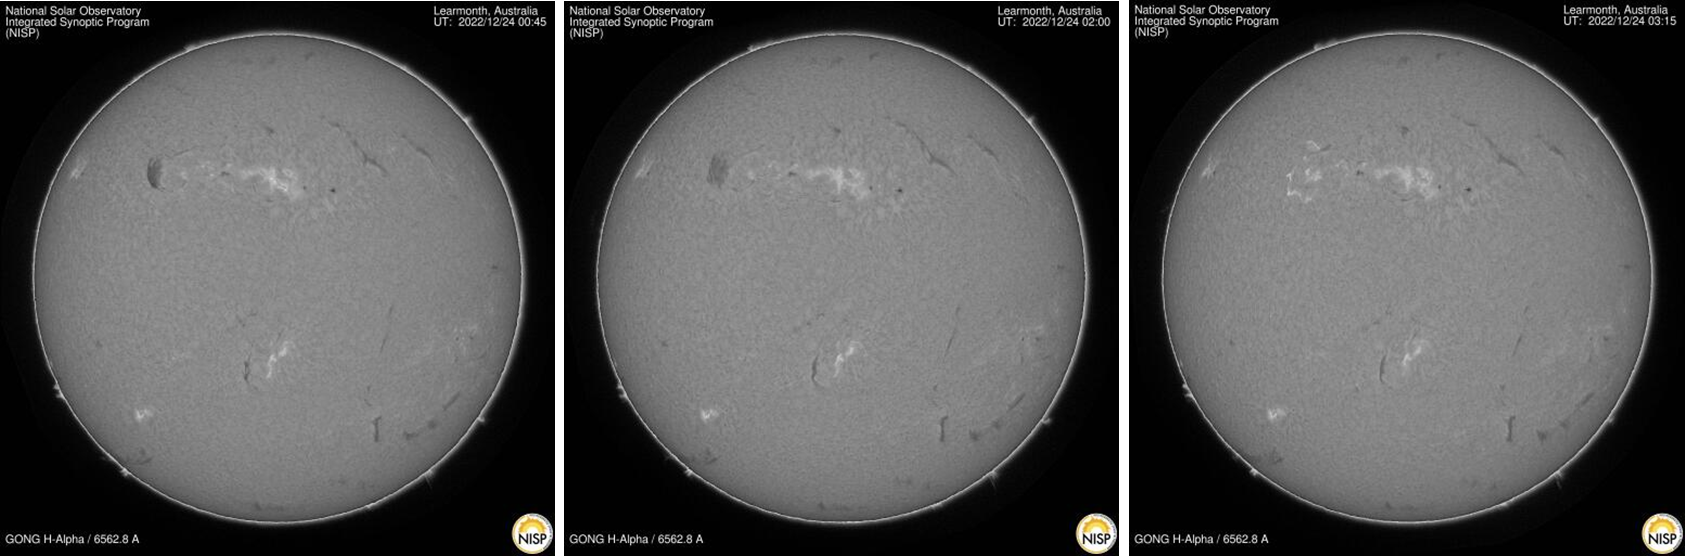
Filament eruptions and CMEs
Several narrow CMEs and flows were observed in the available SOHO/LASCO coronagraph imagery and automatically detected by the CACTus tool over the past week. Two slow speed coronal mass ejections observed on December 24 around 02:30 UTC and on December 24 around 08:30 UTC were associated to filaments eruptions located in the north-east quadrant and north-west quadrant respectively. The former eruption can be seen in the GONG H-alpha imagery underneath (https://gong.nso.edu/ ). However, no clear earth-directed CMEs were identified, so at most glancing blows may reach the earth environment with little impact expected.
Energetic particles
The greater than 10 MeV proton flux was at nominal levels throughout the week. The greater than 2 MeV electron flux increased in response of the solar wind enhancement, and was fluctuating around the 1000 pfu threshold starting on December 24 around 12:00 UTC. The 24h electron fluence also increased around the same time and was at moderate levels by the end of the week.
Noticeable Solar Events (19 Dec 2022 - 25 Dec 2022)
| DAY | BEGIN | MAX | END | LOC | XRAY | OP | 10CM | TYPE | Cat | NOAA |
| 20 | 1359 | 1406 | 1414 | N20E45 | M1.1 | SF | III/1 | 23 | 3169 |
| LOC: approximate heliographic location | TYPE: radio burst type |
| XRAY: X-ray flare class | Cat: Catania sunspot group number |
| OP: optical flare class | NOAA: NOAA active region number |
| 10CM: peak 10 cm radio flux |
PROBA2 Observations (19 Dec 2022 - 25 Dec 2022)
Solar Activity
Solar flare activity fluctuated from low to moderate during the week.
In order to view the activity of this week in more detail, we suggest to go to the following website from which all the daily (normal and difference) movies can be accessed: https://proba2.oma.be/ssa
This page also lists the recorded flaring events.
A weekly overview movie can be found here (SWAP week 665). https://proba2.sidc.be/swap/data/mpg/movies/weekly_movies/weekly_movie_2022_12_19.mp4
Details about some of this week’s events can be found further below.
If any of the linked movies are unavailable they can be found in the P2SC movie repository here https://proba2.sidc.be/swap/data/mpg/movies/
Tuesday Dec 20
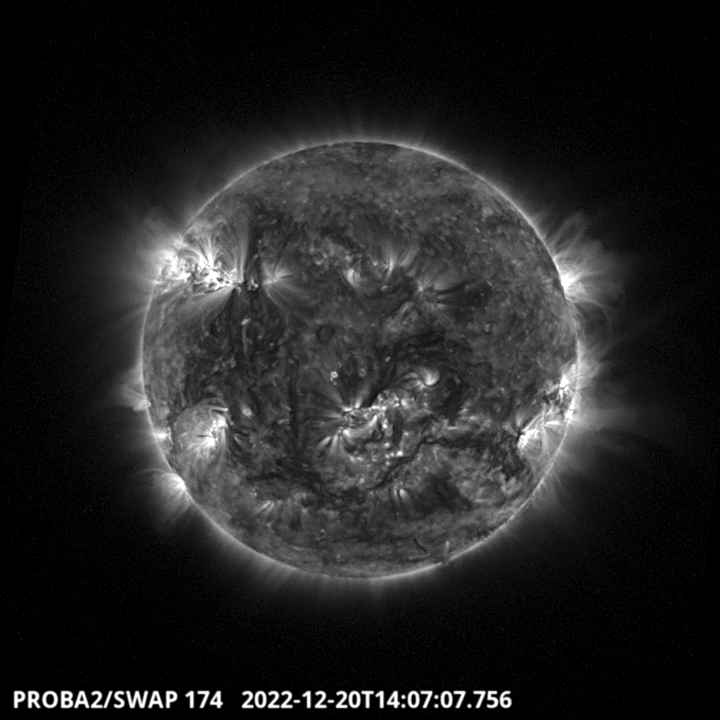
An M1.1 occurred in the North-East part of the solar disk, it has been produced by the active region NOAA 3169 around 14:07 UT - SWAP image. Find a movie of the events here (SWAP movie) https://proba2.sidc.be/swap/data/mpg/movies/20221220_swap_movie.mp4
Saturday Dec 24
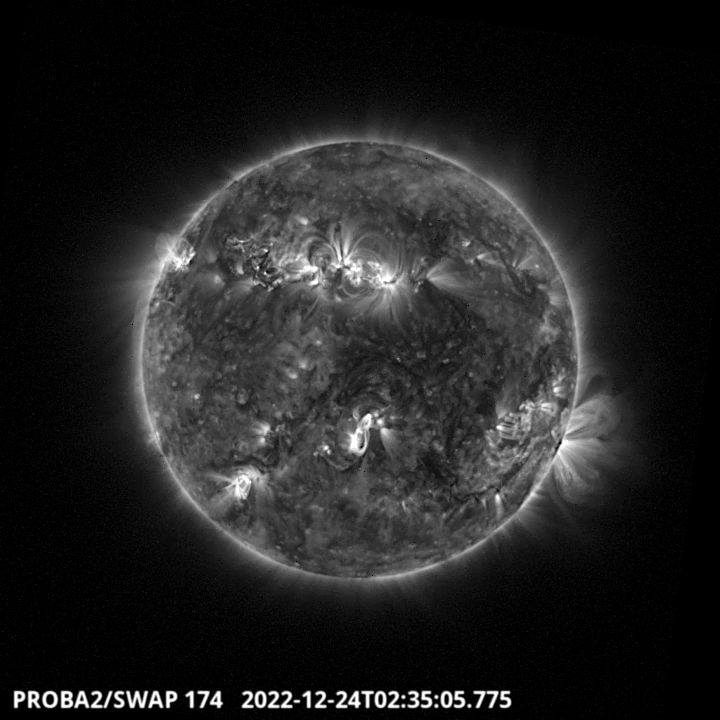
A filament erupted around 02:35 on the North-East part of the solar disk - SWAP image.
Find a movie of the events here (SWAP movie) https://proba2.sidc.be/swap/data/mpg/movies/20221224_swap_movie.mp4
Review of geomagnetic activity (19 Dec 2022 - 25 Dec 2022)
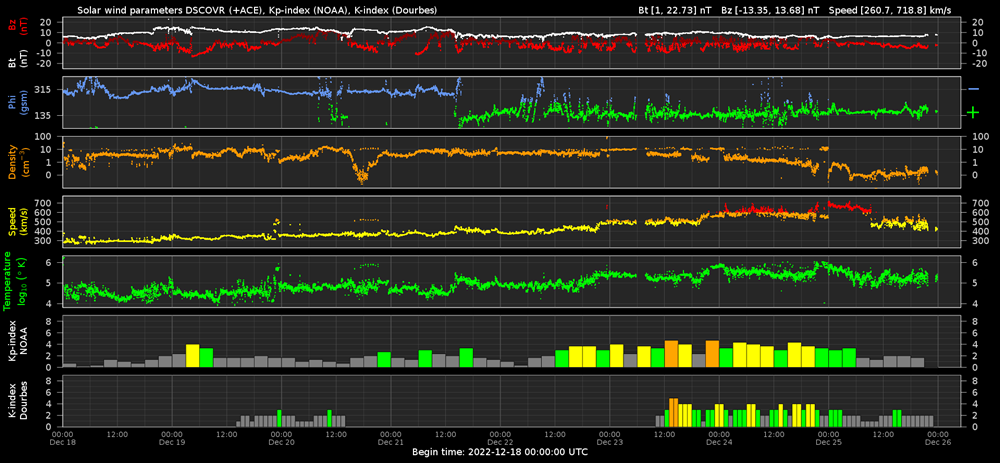
Solar wind at L1
From December 23 onwards, the Earth was under the influence of fast solar wind streams. The solar wind became enhanced due to the arrival of the high-speed stream (HSS) associated with the equatorial coronal holes (positive polarity). The solar wind speed reached maximum values between 600 and 700 km/s, the total interplanetary magnetic field was slightly enhanced and reached values up to 10 nT with the southward interplanetary magnetic component, Bz, ranging between -10 nT and 10 nT.
Geomagnetic conditions
Geomagnetic conditions were mostly at quiet to unsettled levels, except from late 22 until 24 December following the arrival of the HSS. Geomagnetic conditions were mostly active for that period, with isolated intervals of minor storming (NOAA-Kp=5, and K-BEL=5) recorded on 23 December.
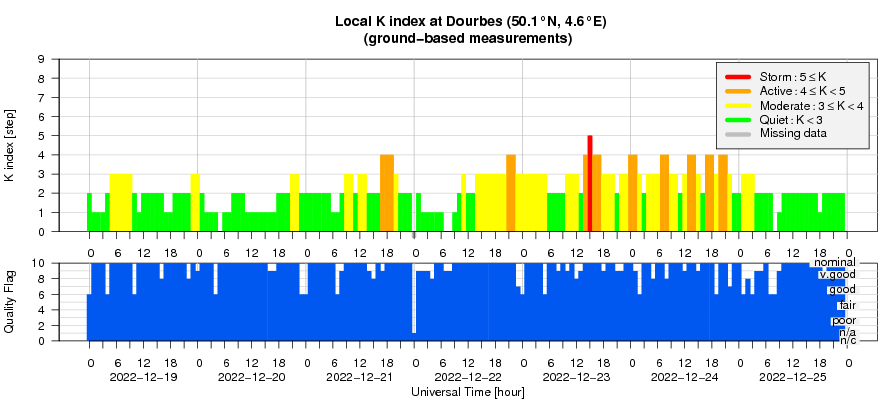
Geomagnetic Observations at Dourbes (19 Dec 2022 - 25 Dec 2022)
The SIDC space weather briefing (19 Dec 2022 - 25 Dec 2022)
The SIDC Space Weather Briefing prepared by the SWx forecaster team for the period from December 18 to 25. It reflects in images and graphs what is written in the Solar and Geomagnetic Activity reports: https://www.stce.be/briefings/20221226_SWbriefing.pdf
If you need to access the movies, contact us: stce_coordination at stce.be
Review of solar activity (26 Dec 2022 - 1 Jan 2023)
Flaring activity
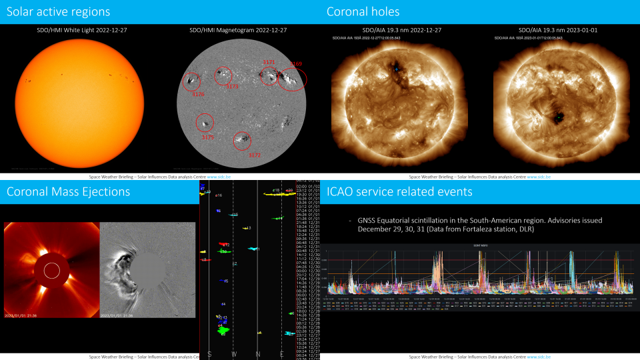
Ten active regions featured on the Sun this week. The most prominent were NOAA active region 3169 which rotated off the disc during the week, and NOAA active regions 3176 and 3180 which both rotated onto the disc in the northeast over the course of the week. These three regions were responsible for a total of 8 M-class flares. The strongest was an M3.7 flare from NOAA active region 3176 on December 30, following new flux emergence ahead of the leading spot. The M-class flaring from NOAA active region 3180 on December 29 occurred even when the region was still at or beyond the eastern limb.
Filament eruptions and CMEs
No clear earth-directed coronal mass ejections (CMEs) were recorded during the week. Only a dimming near the centre of the disc (in association with the M1 flare from NOAA active region 3176 on December 30) for which only STEREO-A coronagraph data are available, indicated potential earth-directed ejecta. From the STEREO-A coronagraph data, the direction is off the Sun-Earth line and a speed of the order of the ambient solar wind was recorded, hence indicating that an arrival of this to Earth is unlikely.
Energetic particles
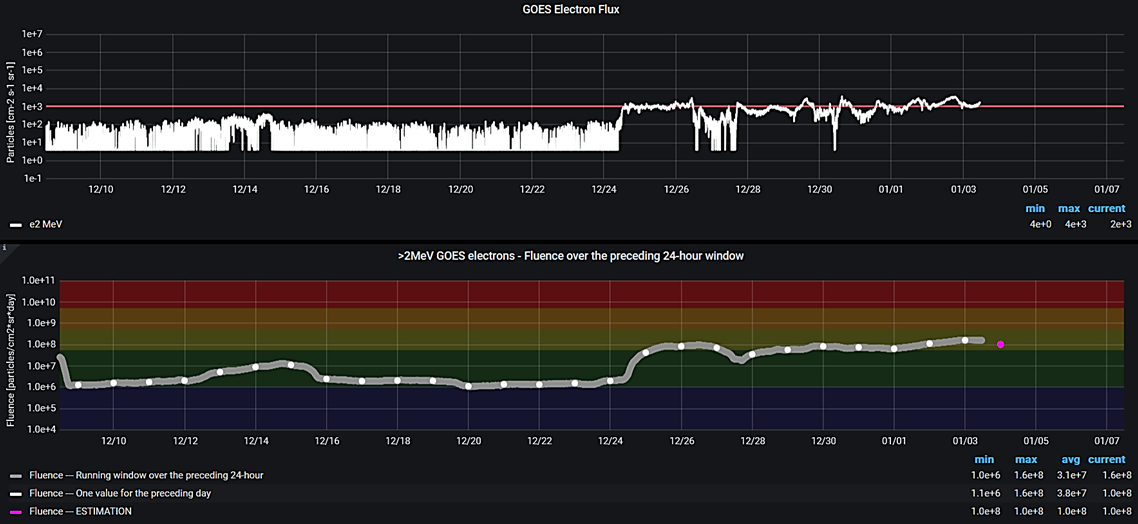
The greater than 10 MeV proton flux was at nominal levels throughout the week. The greater than 2 MeV electron flux briefly exceeded the 1000 pfu threshold every day, and was close to this threshold for most of the week except for a period on 26-27 December. The 24h electron fluence was at moderate levels for most of the week and at normal levels on December 27. The graphs underneath show the evolution of the greater than 2 MeV electron flux and the 24h electron fluence over the last 3 weeks.
Noticeable Solar Events (26 Dec 2022 - 1 Jan 2023)
| DAY | BEGIN | MAX | END | LOC | XRAY | OP | 10CM | TYPE | Cat | NOAA |
| 27 | 0046 | 0054 | 0100 | M2.0 | 31 | 3176 | ||||
| 27 | 0802 | 0815 | 0835 | N19E60 | M1.0 | 2N | 31 | 3176 | ||
| 27 | 1615 | 1626 | 1634 | N20W49 | M1.2 | 1B | 23 | 3169 | ||
| 29 | 0632 | 0727 | 0808 | M1.2 | ||||||
| 29 | 1811 | 1820 | 1826 | M2.1 | CTM/1 | |||||
| 29 | 1826 | 1833 | 1843 | M2.4 | CTM/1 | |||||
| 30 | 1524 | 1528 | 1532 | N20E9 | M1.4 | 1B | III/2 | 31 | 3176 | |
| 30 | 1926 | 1938 | 1947 | N20E9 | M3.7 | 2N | III/1 | 31 | 3176 |
| LOC: approximate heliographic location | TYPE: radio burst type |
| XRAY: X-ray flare class | Cat: Catania sunspot group number |
| OP: optical flare class | NOAA: NOAA active region number |
| 10CM: peak 10 cm radio flux |
PROBA2 Observations (26 Dec 2022 - 1 Jan 2023)
Solar Activity
Solar flare activity fluctuated from low to moderate during the week.
In order to view the activity of this week in more detail, we suggest to go to the following website from which all the daily (normal and difference) movies can be accessed: https://proba2.oma.be/ssa
This page also lists the recorded flaring events.
A weekly overview movie can be found here (SWAP week 666). https://proba2.sidc.be/swap/data/mpg/movies/weekly_movies/weekly_movie_2022_12_26.mp4
Details about some of this week's events can be found further below.
If any of the linked movies are unavailable they can be found in the P2SC movie repository here https://proba2.sidc.be/swap/data/mpg/movies/
Friday Dec 30
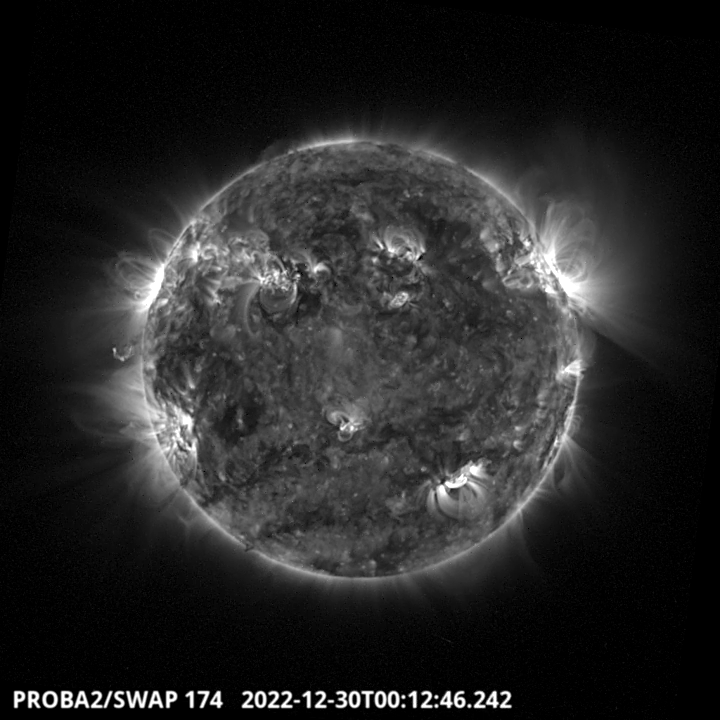
Prominence in the North-East limb of the solar disk around 00:13 UT - SWAP image
Find a movie of the event here (SWAP movie) https://proba2.sidc.be/swap/data/mpg/movies/20221230_swap_movie.mp4
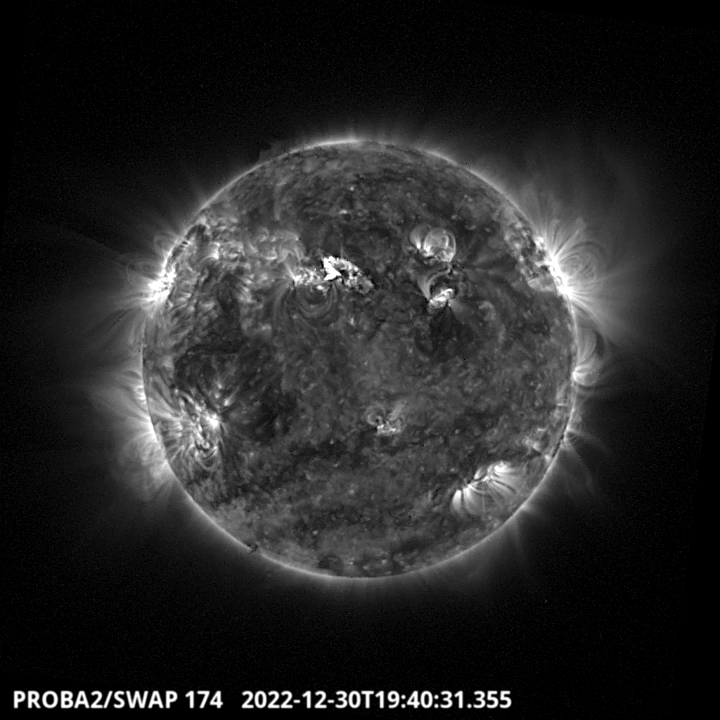
The largest flare of the week was a M3.7 flare. It was produced by the active region 3176 located in the North-East part of the solar disk around 19:40 UT - SWAP image. Find a movie of the events here (SWAP movie) https://proba2.sidc.be/swap/data/mpg/movies/20221230_swap_movie.mp4
Review of geomagnetic activity (26 Dec 2022 - 1 Jan 2023)
Solar wind at L1
The week started under the waning influence of a high speed stream (HSS). On December 26-27 the passing of a transient was associated with sustained periods of pronounced negative Bz (down to -12nT). By December 29 the solar wind speed had gradually decreased to around 400 km/s before starting a new increase on December 30 under the influence of a HSS related to a positive polarity coronal hole in the northern hemisphere that transited the central meridian at the start of the week. Solar wind speed reached 600km/s by the change of the UTC year. The magnetic field orientation showed connection to a positive sector (field away from the Sun) throughout the week.
Geomagnetic conditions
Geomagnetic conditions reached active levels and minor geomagnetic storm levels both with the passage of the transient on December 26-27 and with the onset of the high speed stream on December 30. The graphs underneath show the solar wind parameters as recorded by DSCOVR and ACE as well as the NOAA Kp and K Dourbes geomagnetic indices from 25 December 2022 until 1 January 2023.

Geomagnetic Observations at Dourbes (26 Dec 2022 - 1 Jan 2023)

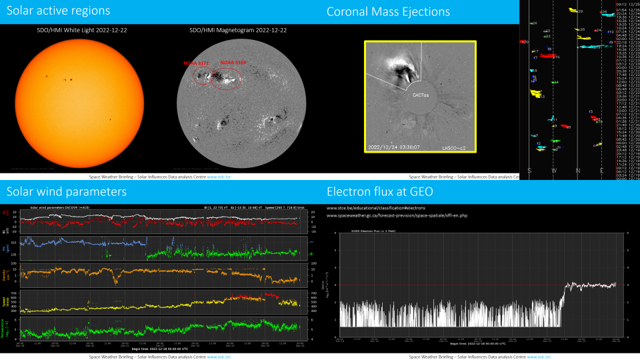
The SIDC space weather briefing (26 Dec 2022 - 1 Jan 2023)
The SIDC Space Weather Briefing presented by the forecaster on duty from December 25 till January 1. It reflects in images and graphs what is written in the Solar and Geomagnetic Activity reports: https://www.stce.be/briefings/20230102_SWbriefing.pdf
If you need to access the movies, contact us: stce_coordination at stce.be
STCE activities
Check out our activity calendar: activities and encounters with the Sun-Space-Earth system and Space Weather as the main theme. We provide occasions to get submerged in our world through educational, informative and instructive activities.
If you want your event in our calendar, contact us: stce_coordination at stce.be
* January 16, STCE Seminar: Realistic Ionosphere (RION), data fusion project of GIRO and GNSS, STCE, onsite and zoom
* January 27, POSTPONED Seminar: Opportunities of Wikipedia and related applications for science, BIRA-IASB
* January 30, 31, February 2, 3, Space Weather Introductory Course - online, by the STCE, zoom
* March 27-29, Space Weather Introductory Course - onsite, by the STCE, Brussels, Belgium
* May 22-24, Space Weather Introductory Course - onsite, by the STCE, Brussels, Belgium
Check: https://www.stce.be/calendar