- Table of Content
- 1.New milestones...
- 2.Review of sola...
- 3.Review of geom...
- 4.Noticeable Sol...
- 5.International ...
- 6.PROBA2 Observa...
- 7.Geomagnetic Ob...
- 8.The SIDC Space...
- 9.Action!
2. Review of solar activity
3. Review of geomagnetic activity
4. Noticeable Solar Events (9 Jan 2023 - 15 Jan 2023)
5. International Sunspot Number by SILSO
6. PROBA2 Observations
7. Geomagnetic Observations in Belgium
8. The SIDC Space Weather Briefing
9. Action!
New milestones for SC25
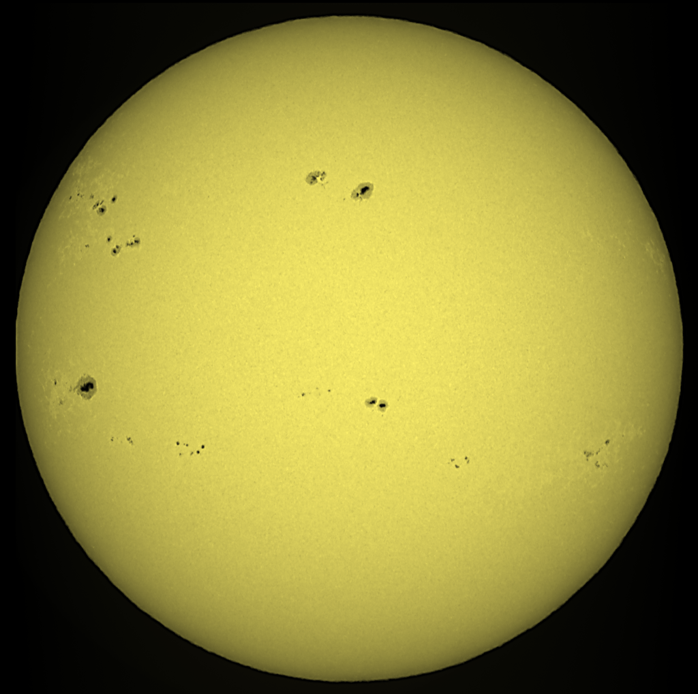
January continued the high levels of solar activity. So far this month, already a few dozen of M-class flares have been recorded as well as 3 X-class flares, the most recent one an X1.0 event that took place on 10 January (see the STCE Newsitem at https://www.stce.be/news/623/welcome.html ). The solar disk was peppered with big and small sunspots, as can be seen in the white-light image underneath taken on 15 January by the solar telescopes of the Royal Observatory in Belgium (USET - https://www.sidc.be/uset/). The image has been colourized and contrast enhanced. Using eclipse glasses, the big spot in the lower left has become visible to the naked eye. This will remain so for the next few days as the sunspot remains close to the Sun's central meridian ("north-south" line).
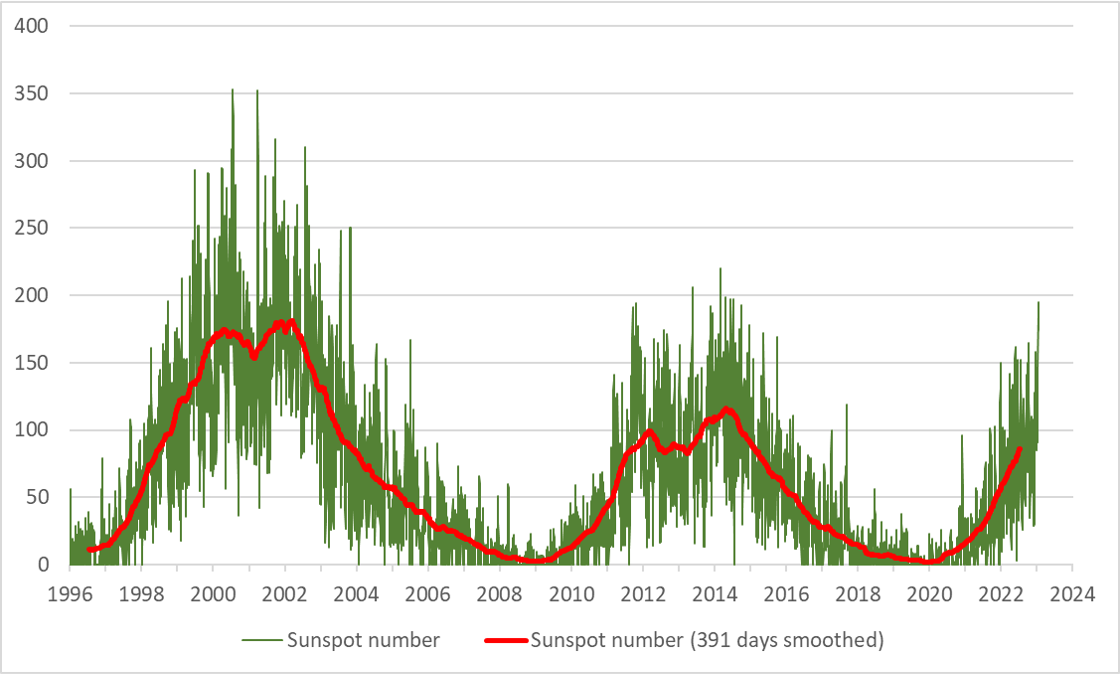
The sunspot number, as determined by SILSO (https://www.sidc.be/silso/ ), was the highest so far this solar cycle (SC25) and reached values not seen since the previous solar cycle maximum. The estimated daily sunspot number, i.e. the sunspot number calculated from a limited number of observations received for that day, was near 195 (+/- 20) on both 15 and 16 January. Note the estimated sunspot numbers may differ somewhat from the provisional values that are issued in the beginning of the subsequent month, when many more observations are available. These provisional numbers differ very little from the final values that are usually published 3 to 6 months later. The graph underneath displays these 3 types of daily sunspot numbers, with the final values running from January 1996 till June 2022, the provisional ones from July till December 2022, and the estimated sunspot numbers from 1 till 17 January 2023. The red line is a smoothing average over 391 days, a duration corresponding loosely to the 13-months smoothing formula that is used for monthly sunspot numbers (https://www.sidc.be/silso/faq6 ).
The currently recorded sunspot numbers (just below 200) are similar to the ones recorded during the double maxima of the previous solar cycle in 2011 and 2014. It is however quite sobering to compare these values with the sunspot numbers of the "moderate" solar cycle 23, during which there were over 340 days when the daily sunspot number was at or exceeded 200. There were even 15 days when the sunspot number was higher than 300! Clearly still a gear or two higher than what we are currently observing in the ongoing solar cycle...
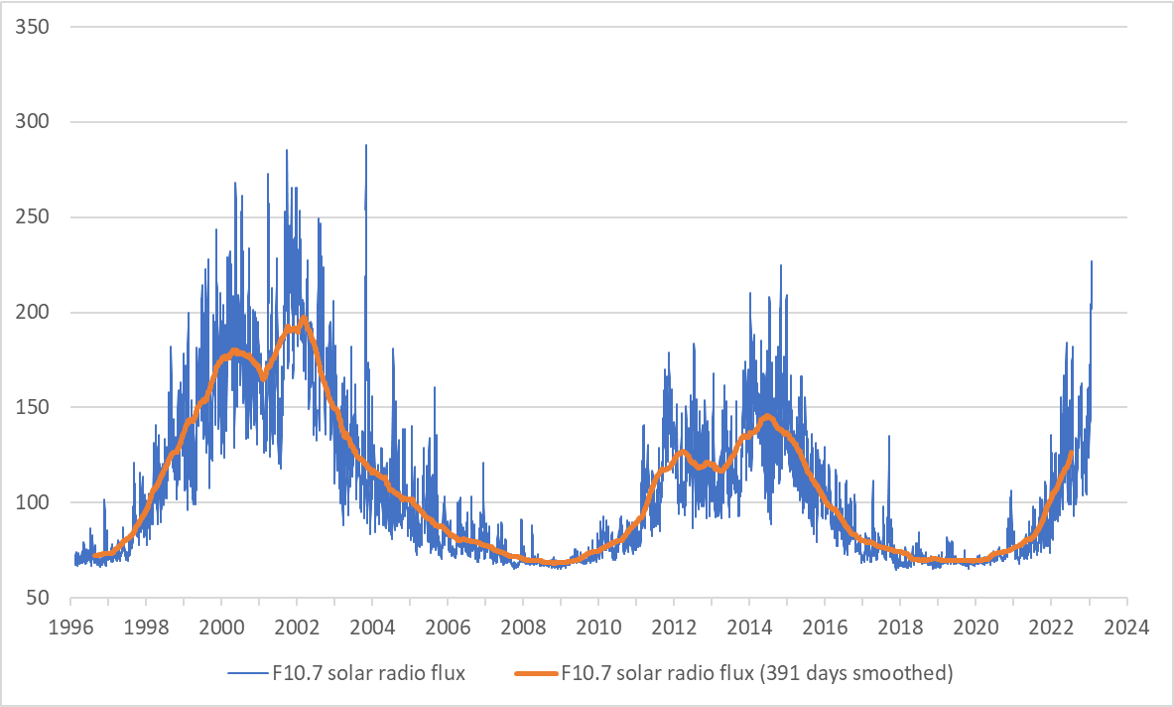
The high solar activity was also reflected in the 10.7 cm solar radio flux (F10.7), data which can be found on the website of the Natural Resources Canada/Solar radio flux Penticton (https://www.spaceweather.gc.ca/forecast-prevision/solar-solaire/solarflux/sx-en.php ). In the graph underneath, "adjusted" radio fluxes have been used to scale the observed values all to the same Sun-Earth distance of 1 Astronomical Unit (about 149.6 million km). Indeed, due to the varying Sun-Earth distance throughout the year, the observed radio fluxes would be about 3% lower during June-July when the Earth is furthest away from the Sun, and about 3% higher during the December-January timeframe when our planet is closest to the Sun. This correction allows for a comparison of the radio fluxes on an equal footing over the various solar cycles. The orange curve reflects the smoothing average again over 391 days. The data were also corrected for the most obvious effects of solar flaring, by eliminating about two dozen of affected daily values.
The conclusions are very similar as for the sunspot number. The values recorded during the first half of January 2023 are the highest so far this solar cycle, with 226.7 solar flux units (observed: 234.3 sfu) measured on 15 January. These values are comparable to the maximum of the previous solar cycle in 2014, but -for the moment- well below what was recorded during solar cycle 23. During that solar cycle, the solar flux exceeded the threshold of 250 solar flux units (sfu) on about 38 days. With the radio flux considered a proxy for the enhanced solar extreme ultraviolet radiation, the value of 250 sfu is thought to be a threshold above which the first drag effects from the expanding Earth's upper atmosphere manifest themselves on satellites in a Low Earth Orbit (LEO), thus lowering their altitude. On the positive side, these drag effects also help cleaning up the space junk from e.g. satellite launches (nuts, bolts, fairings, nose cones,...) and other space debris. See the STCE newsitems at https://www.stce.be/news/452/welcome.html and https://www.stce.be/news/201/welcome.html The current evolution in solar activity leaves little doubt that the daily sunspot number will exceed 200 and the solar radio flux 250 sfu at some point this solar cycle.
Review of solar activity
Flares
The solar flaring activity was at moderate to high levels over the past week with background C-class flaring, frequent M-class flares and two low X-class flares: an X1.9 flare, peak time 18:50 UTC on Jan 9th, and an X1.0 flare, peak time 22:47 UTC on Jan 10th.
There were in total sixteen active regions on the visible solar disk, the most notable ones, NOAA AR 3184 and NOAA AR 3186, developed to a beta-gamma-delta magnetic type configuration and produced the high levels of activity at the beginning of the week, as well as multiple M-class flaring. NOAA AR 3181 and NOAA AR 3182 have developed into complex configurations throughout the week and have contributed to the moderate levels of activity, together with NOAA AR 3191 and NOAA AR 3192. The
remaining active regions were either small and simple, or predominantly stable and inactive.
Coronal Mass Ejections
The solar surface was streaked by filaments and multiple eruptions were observed throughout the week. None of these events resulted in an Earth-directed coronal mass ejection (CME). A wide south-east CME was detected by LASCO C2 around 17UTC On Jan 11th. A glancing blow from this ejection was estimated to arrive to Earth on Jan 16th. A back-sided partial halo was observed at 23:48 UTC on Jan 12th following a C8.1-class flaring from behind the south-west limb with no Earth impact expected. A slow partial halo south-west CME was detected in LASCO C2 imagery around 21:26 UTC on Jan 14th, following M4.6-class flaring from NOAA AR 3182 (beta-gamma-delta). A flank of this eruption is expected to arrive to Earth on Jan 19th.
Energetic Particles near Earth
The greater than 10 MeV proton flux was elevated on Jan 10th and Jan 13th following significant flaring and related CME activity, but remained under radiation storm levels throughout the entire week. The greater than 2 MeV electron flux was below the 1000 pfu threshold throughout the entire the week. The corresponding electron fluence was at nominal levels.
Review of geomagnetic activity
The Solar Wind near Earth
The solar wind parameters were slightly enhanced throughout most of the week due mild high speed stream (HSS) arrivals mixed with a potential mild transient feature towards the end of the week. The solar wind velocity reached 556 km/s.
The interplanetary magnetic field went up to 14 nT with a minimum value of the Bz component of -11 nT. The interplanetary magnetic field was predominantly in the negative sector (directed towards the Sun) throughout the entire week, reflecting the polarity of the geo-effective coronal holes.
The Geomagnetic Field
The geomagnetic conditions over Belgium throughout the week were mostly quiet to unsettled. Active conditions were measured locally in Belgium late on Jan 13th to early Jan 14th and on Jan 15th.
Globally the geomagnetic conditions as measured by NOAA Kp index reached minor storm levels in the early UTC morning of Jan 15th in response to a HSS arrival, possibly mixed with a solar wind transient.
Noticeable Solar Events (9 Jan 2023 - 15 Jan 2023)
| DAY | BEGIN | MAX | END | LOC | XRAY | OP | 10CM | TYPE | Cat | NOAA |
| 09 | 0051 | 0102 | 0119 | M1.1 | 3184 | |||||
| 09 | 0845 | 0901 | 0916 | S16W26 | M2.1 | 1N | VI/2 | 36 | 3181 | |
| 09 | 1315 | 1322 | 1331 | M1.0 | 36 | 3181 | ||||
| 09 | 1837 | 1850 | 1857 | S14E72 | X1.9 | 3B | 230 | III/1 | 3184 | |
| 10 | 0009 | 0016 | 0022 | N25E80 | M5.1 | SF | III/2VI/2 | 3186 | ||
| 10 | 0208 | 0216 | 0224 | S16E75 | M1.0 | SF | III/1 | 3184 | ||
| 10 | 0233 | 0241 | 0254 | S16W26 | M2.6 | 2N | 36 | 3181 | ||
| 10 | 1059 | 1108 | 1112 | M1.0 | 3184 | |||||
| 10 | 1717 | 1728 | 1734 | M1.3 | III/1 | 3186 | ||||
| 10 | 1744 | 1748 | 1752 | M1.2 | 3184 | |||||
| 10 | 2239 | 2247 | 2252 | N25E66 | X1.0 | 2B | 320 | VI/2III/2 | 3186 | |
| 11 | 0039 | 0059 | 0110 | N25E66 | M2.4 | 1F | 100 | VI/2IV/2III/2 | 43 | 3186 |
| 11 | 0149 | 0156 | 0201 | S16E21 | M5.6 | SF | 290 | II/1 | 42 | 3184 |
| 11 | 0531 | 0609 | 0629 | N24W11 | M1.3 | SF | VI/2 | 36 | 3181 | |
| 11 | 0825 | 0833 | 0837 | S25E66 | M3.1 | 1N | 43 | 3186 | ||
| 12 | 0553 | 0618 | 0633 | M1.1 | 43 | 3186 | ||||
| 12 | 0633 | 0646 | 0702 | M1.5 | 43 | 3186 | ||||
| 12 | 1108 | 1128 | 1146 | S14W69 | M1.2 | SF | 36 | 3181 | ||
| 12 | 1439 | 1457 | 1510 | M1.0 | III/1 | 38 | 3182 | |||
| 12 | 1903 | 1913 | 1924 | M1.0 | 38 | 3182 | ||||
| 13 | 0253 | 0259 | 0303 | N27E41 | M1.4 | 1N | III/1 | 43 | 3186 | |
| 13 | 1005 | 1015 | 1019 | S19W84 | M3.9 | SN | III/2II/2 | 36 | 3181 | |
| 14 | 0129 | 0209 | 0230 | N18E75 | M1.3 | SF | 47 | 3191 | ||
| 14 | 2006 | 2021 | 2028 | M3.5 | 100 | 38 | 3182 | |||
| 14 | 2037 | 2100 | 2119 | M4.6 | 38 | 3182 | ||||
| 15 | 0308 | 0342 | 0408 | M6.0 | F | I/1 2 | 47 | 3191 | ||
| 15 | 1416 | 1431 | 1451 | M4.8 | B | 48 | 3190 |
| LOC: approximate heliographic location | TYPE: radio burst type |
| XRAY: X-ray flare class | Cat: Catania sunspot group number |
| OP: optical flare class | NOAA: NOAA active region number |
| 10CM: peak 10 cm radio flux |
International Sunspot Number by SILSO
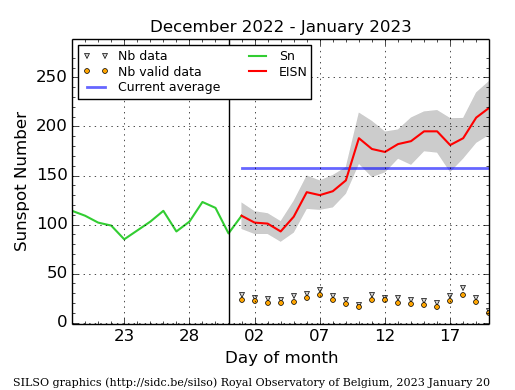
The daily Estimated International Sunspot Number (EISN, red curve with shaded error) derived by a simplified method from real-time data from the worldwide SILSO network. It extends the official Sunspot Number from the full processing of the preceding month (green line), a few days more than one solar rotation. The horizontal blue line shows the current monthly average. The yellow dots give the number of stations that provided valid data. Valid data are used to calculate the EISN. The triangle gives the number of stations providing data. When a triangle and a yellow dot coincide, it means that all the data is used to calculate the EISN of that day.
PROBA2 Observations
Solar Activity
Solar flare activity fluctuated from moderate to high during the week.
In order to view the activity of this week in more detail, we suggest to go to the following website from which all the daily (normal and difference) movies can be accessed: https://proba2.oma.be/ssa
This page also lists the recorded flaring events.
A weekly overview movie (SWAP week 668) can be found here: https://proba2.sidc.be/swap/data/mpg/movies/weekly_movies/weekly_movie_2023_01_09.mp4.
Details about some of this week's events can be found further below.
If any of the linked movies are unavailable they can be found in the P2SC movie repository here: https://proba2.oma.be/swap/data/mpg/movies/.
Monday January 09
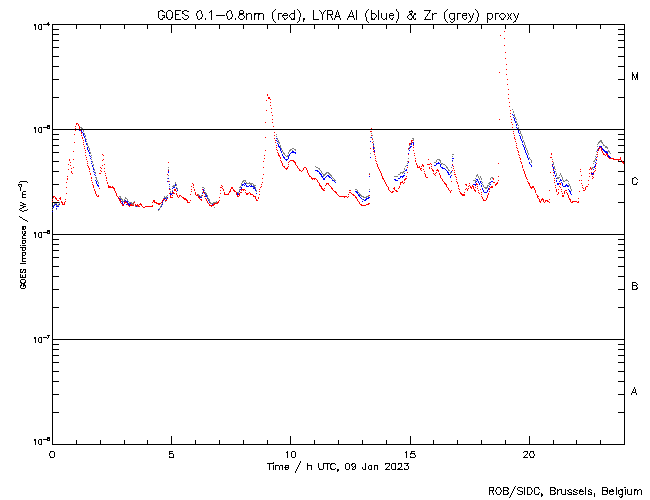
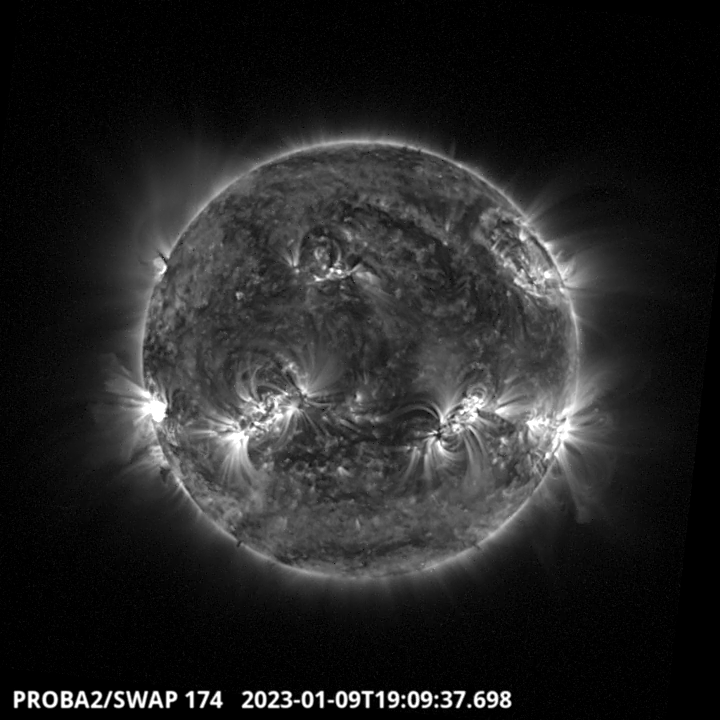
The largest flare of the week, an X1.9 flare, was observed by LYRA (top panel) and SWAP (bottom panel). The flare occurred on 2023-Jan-09 (peak at 18:50 UT) on the eastern limb, and it was associated with NOAA AR3184. The peak of the flare occurred during a PROBA2 occultation, so the available observations show the beginning and end of the event.
Find a SWAP movie of the event here: https://proba2.sidc.be/swap/movies/20230109_swap_movie.mp4.
Geomagnetic Observations in Belgium
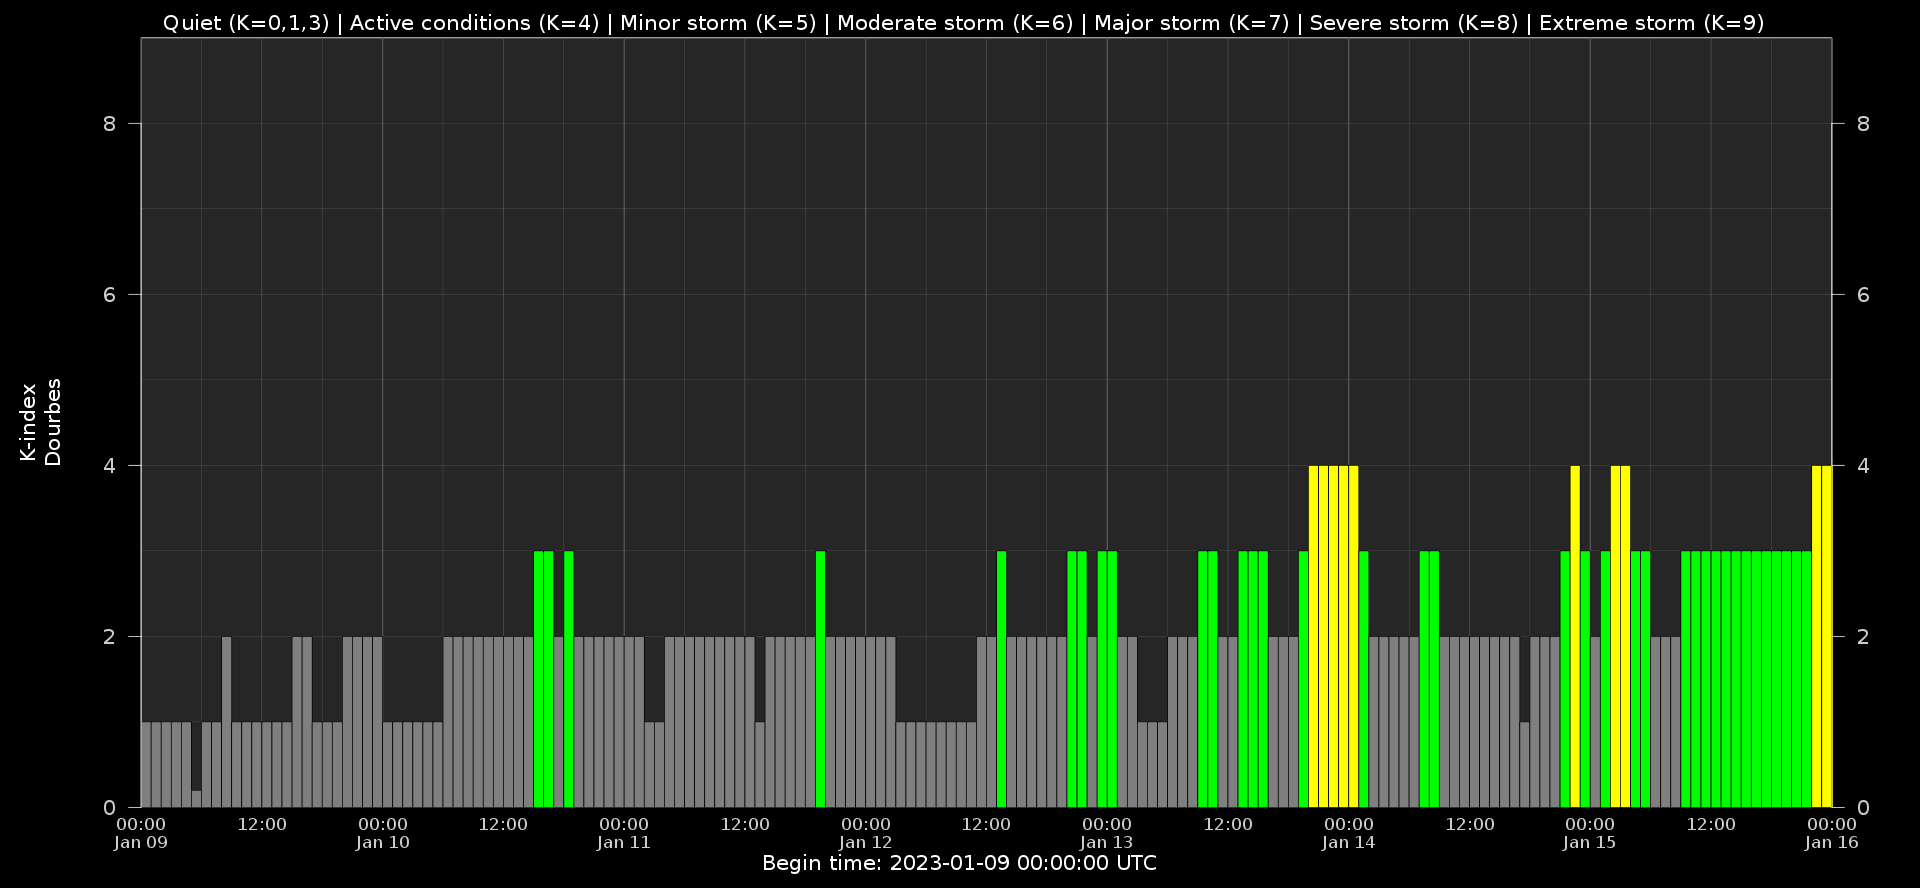
Local K-type magnetic activity index for Belgium based on data from Dourbes (DOU) and Manhay (MAB). Comparing the data from both measurement stations allows to reliably remove outliers from the magnetic data. At the same time the operational service availability is improved: whenever data from one observatory is not available, the single-station index obtained from the other can be used as a fallback system.
Both the two-station index and the single station indices are available here: http://ionosphere.meteo.be/geomagnetism/K_BEL/
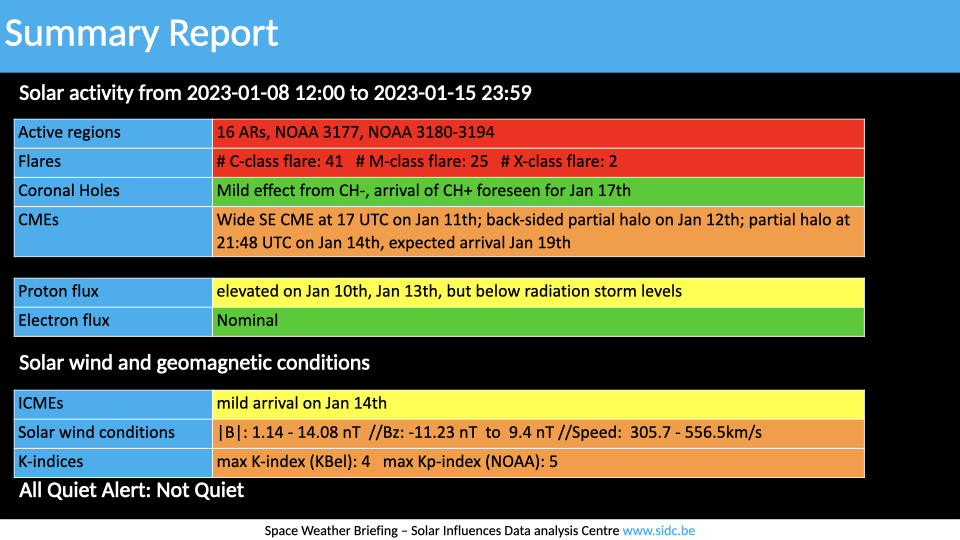
The SIDC Space Weather Briefing
The Space Weather Briefing presented by the forecaster on duty from to . It reflects in images and graphs what is written in the Solar and Geomagnetic Activity report: https://www.stce.be/briefings/20230116_SWbriefing.pdf
If you need to access the movies, contact us: stce_coordination at stce.be
Action!
Check out our activity calendar: activities and encounters with the Sun-Space-Earth system and Space Weather as the main theme. We provide occasions to get submerged in our world through educational, informative and instructive activities.
If you want your event in our calendar, contact us: stce_coordination at stce.be
* January 27, POSTPONED Seminar: Opportunities of Wikipedia and related applications for science, BIRA-IASB
* January 30, 31, February 2, 3, Space Weather Introductory Course - online, by the STCE, zoom
* March 14, PITHIA-NRF High Profile Meeting, Brussels, Belgium
* March 15, PITHIA-NRF Innovation Day, Brussels, Belgium
* March 16, PITHIA-NRF Training for Partners, Brussels, Belgium
* March 17, PITHIA-NRF Workshop for Optimization of Observational Strategies, Brussels, Belgium
* March 27-29, Space Weather Introductory Course - onsite, by the STCE, Brussels, Belgium
* May 22-24, Space Weather Introductory Course - onsite, by the STCE, Brussels, Belgium
* May 29 - June 1, PITHIA-NRF Training School, Rome, Italy
Check: https://www.stce.be/calendar