- Table of Content
- 1.Severe geomagn...
- 2.New group of p...
- 3.The SIDC space...
- 4.International ...
- 5.Noticeable Sol...
- 6.PROBA2 Observa...
- 7.Geomagnetic Ob...
- 8.Review of iono...
- 9.Review of sola...
- 10.Review of geom...
- 11.Calendar
2. New group of potential SWx operators
3. The SIDC space Weather Briefing
4. International Sunspot Number by SILSO (20 Mar 2023 - 26 Mar 2023)
5. Noticeable Solar Events (20 Mar 2023 - 26 Mar 2023)
6. PROBA2 Observations (20 Mar 2023 - 26 Mar 2023)
7. Geomagnetic Observations in Belgium (20 Mar 2023 - 26 Mar 2023)
8. Review of ionospheric activity (20 Mar 2023 - 26 Mar 2023)
9. Review of solar activity
10. Review of geomagnetic activity
11. Calendar
Severe geomagnetic storm!
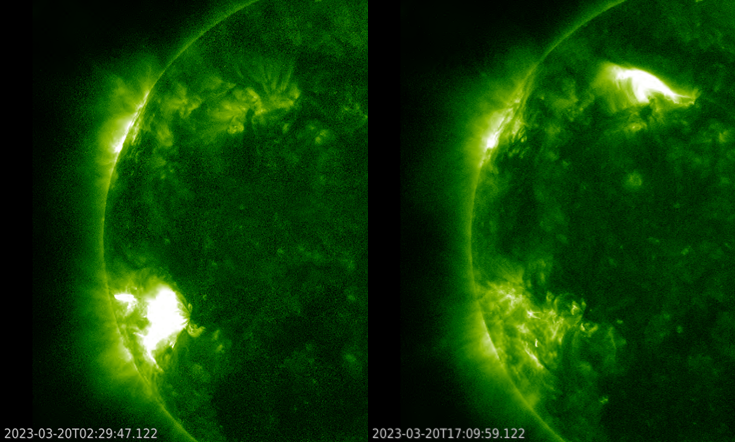
On 23 and 24 March, the earth environment was hit by a strong interplanetary coronal mass ejection (ICME). The geomagnetic field got very disturbed with the Kp-index eventually reaching severe geomagnetic storm levels (Kp = 8-) early on 24 March. More information on geomagnetic indices and geomagnetic disturbance levels can be found at the STCE's SWx classification page (https://www.stce.be/educational/classification#geomag ). The source of the ICME was most likely a solar eruption that took place on 20 March: an M1 flare in NOAA 3256 near the southeast limb early that day, or a long duration C4 flare in NOAA 3258 in the northeast solar quadrant. Both eruptions are shown in the SDO/AIA 094 imagery (http://sdo.gsfc.nasa.gov/data/aiahmi/ ) underneath.
When the ICME arrived, no shock was observed as can be seen in the solar wind data chart from the DSCOVR satellite (https://www.swpc.noaa.gov/products/real-time-solar-wind ). The solar wind speed (yellow curve) did not change abruptly and even gradually decreased from around 500 km/s to 450 km/s. The density (orange curve) first rose to high values around 50 particles / cm3, quickly to drop to more typical values near 10 particles / cm3 around 13:45 UTC on 23 March. The magnetic field of the passing ICME then turned southward (Bz, red curve) soon after, with Bz near -15 nT for nearly 9 consecutive hours, from about 17h UTC until 04h UTC the next day as the CME core passed.
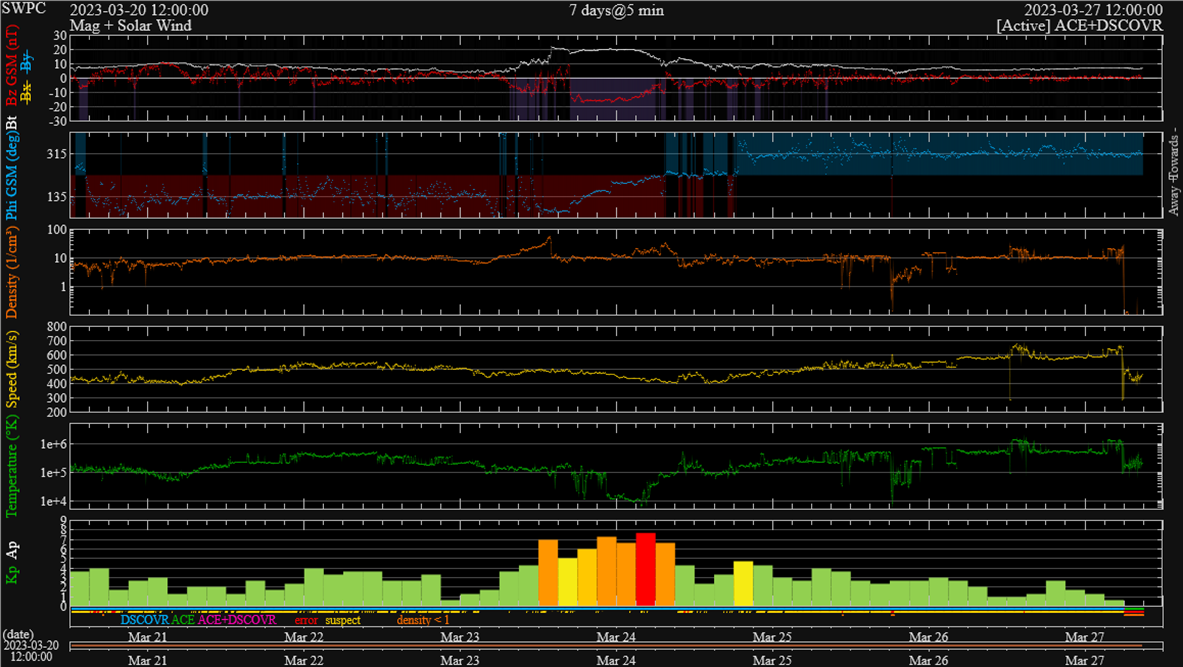
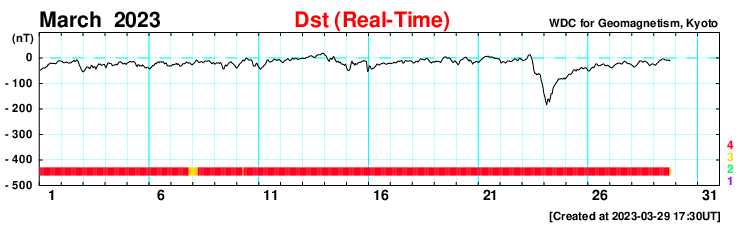
This peculiar set of solar wind conditions resulted of course in a much stronger geomagnetic storm than initially anticipated just a few days earlier. Instead of the expected minor or moderate storm (Kp of 5 or 6), Kp eventually reached severe storming levels (Kp = 8-) during the 03-06 UTC interval in the morning of 24 March (see the bottom chart above). Kp-wise, this was the strongest storm since 4 November 2021 (see this STCE newsitem at https://www.stce.be/news/561/welcome.html ). The (provisional) Dst index reached -184 nT, a value not seen since the "Solstice storm" on 23 June 2015 when it was at -198 nT (Kyoto WDC, https://wdc.kugi.kyoto-u.ac.jp/index.html ).
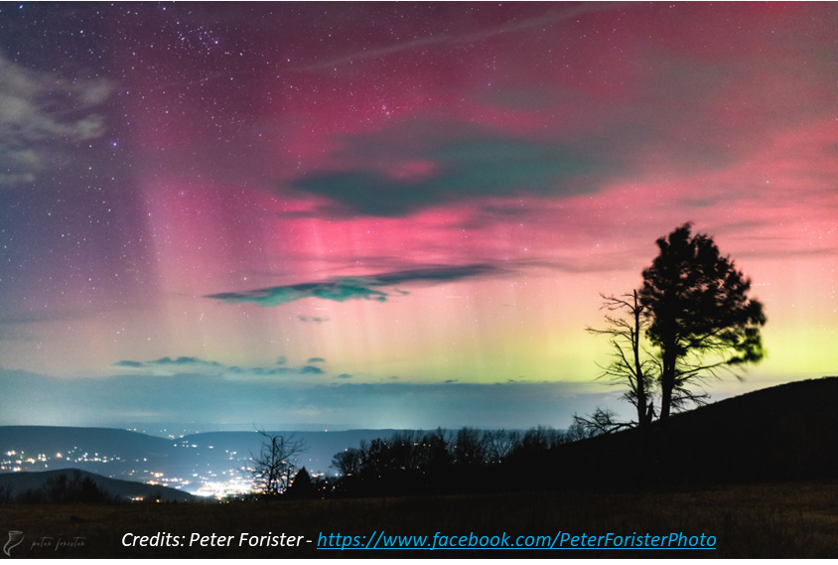
The severe geomagnetic storm resulted in aurora that were visible and/or photographed at relatively low latitudes (source: https://www.spaceweather.com/ ). Most of these pictures showed the red hues of the aurora, which are typically found at higher altitudes (200 km or higher) than the green coloured aurora (between 100 and 200 km) and thus can be seen from further away (see BIRA-IASB at https://www.aeronomie.be/en/encyclopedia/aurora-or-polar-lights-secret-colours ). Thus, long-exposed pictures taken in Europe (Slovenia) and the United States (New Mexico, North Carolina, and even Florida) showed faint reddish aurora just above the horizon. For these locations near 30 degrees latitude, the polar lights were not visible to the naked eye. But that gradually changed for sites located about 5 to 10 degrees more poleward. Peter Forister (https://www.facebook.com/PeterForisterPhoto ; image underneath) photographed the aurora from Stanley, Virginia (latitude +38.7 degrees). The photos were taken in Shenandoah National Park between 22:45 and 23:45 local time, looking northwest. He reported that "The lights were visible to my naked eye for about an hour. The vibrant green and red colors only lasted about 15 minutes during an intense "Substorm" around 23:00. These are long exposure photographs (between 4 and 6 seconds long each), and so are brighter than what I was able to see. The colors are accurate to the very deep reds and greens that I could see!"
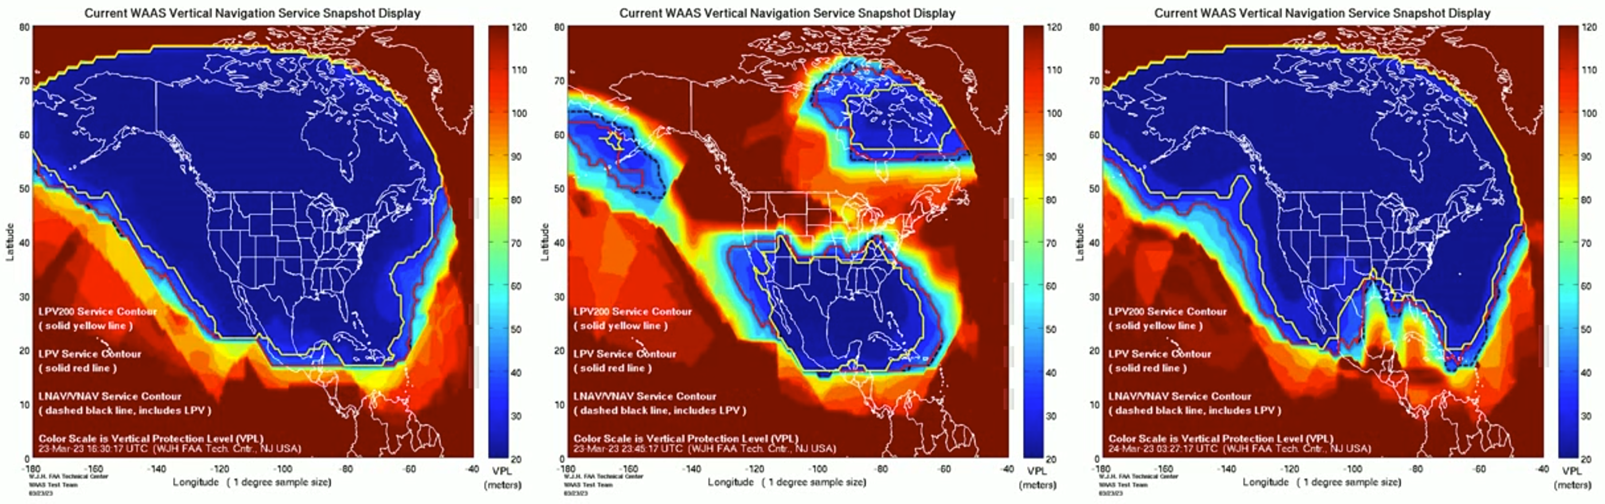
As a result of this severe geomagnetic storm, some GNSS-based applications for the civil aviation did not reach their typical availability, as can be gauged from the imagery underneath for the USA/Canada (WAAS - https://www.nstb.tc.faa.gov/index.htm ), covering the period 23 March (09:00 UTC) until 24 March (10:00 UTC). Blue colours mean good availability, red/brown means significantly degraded availability. Clearly the systems were underperforming while the geomagnetic storm was ongoing. In Europe, similar observations were made for the EGNOS system (https://egnos-user-support.essp-sas.eu/ ). Clips are available in the online version of this newsitem at https://www.stce.be/news/638/welcome.html
New group of potential SWx operators
The Space Weather Introductory Course of March has ended. We share our knowledge about the different forms of solar energy transported through the heliosphere and how this energy can impact the magnetosphere and atmosphere.
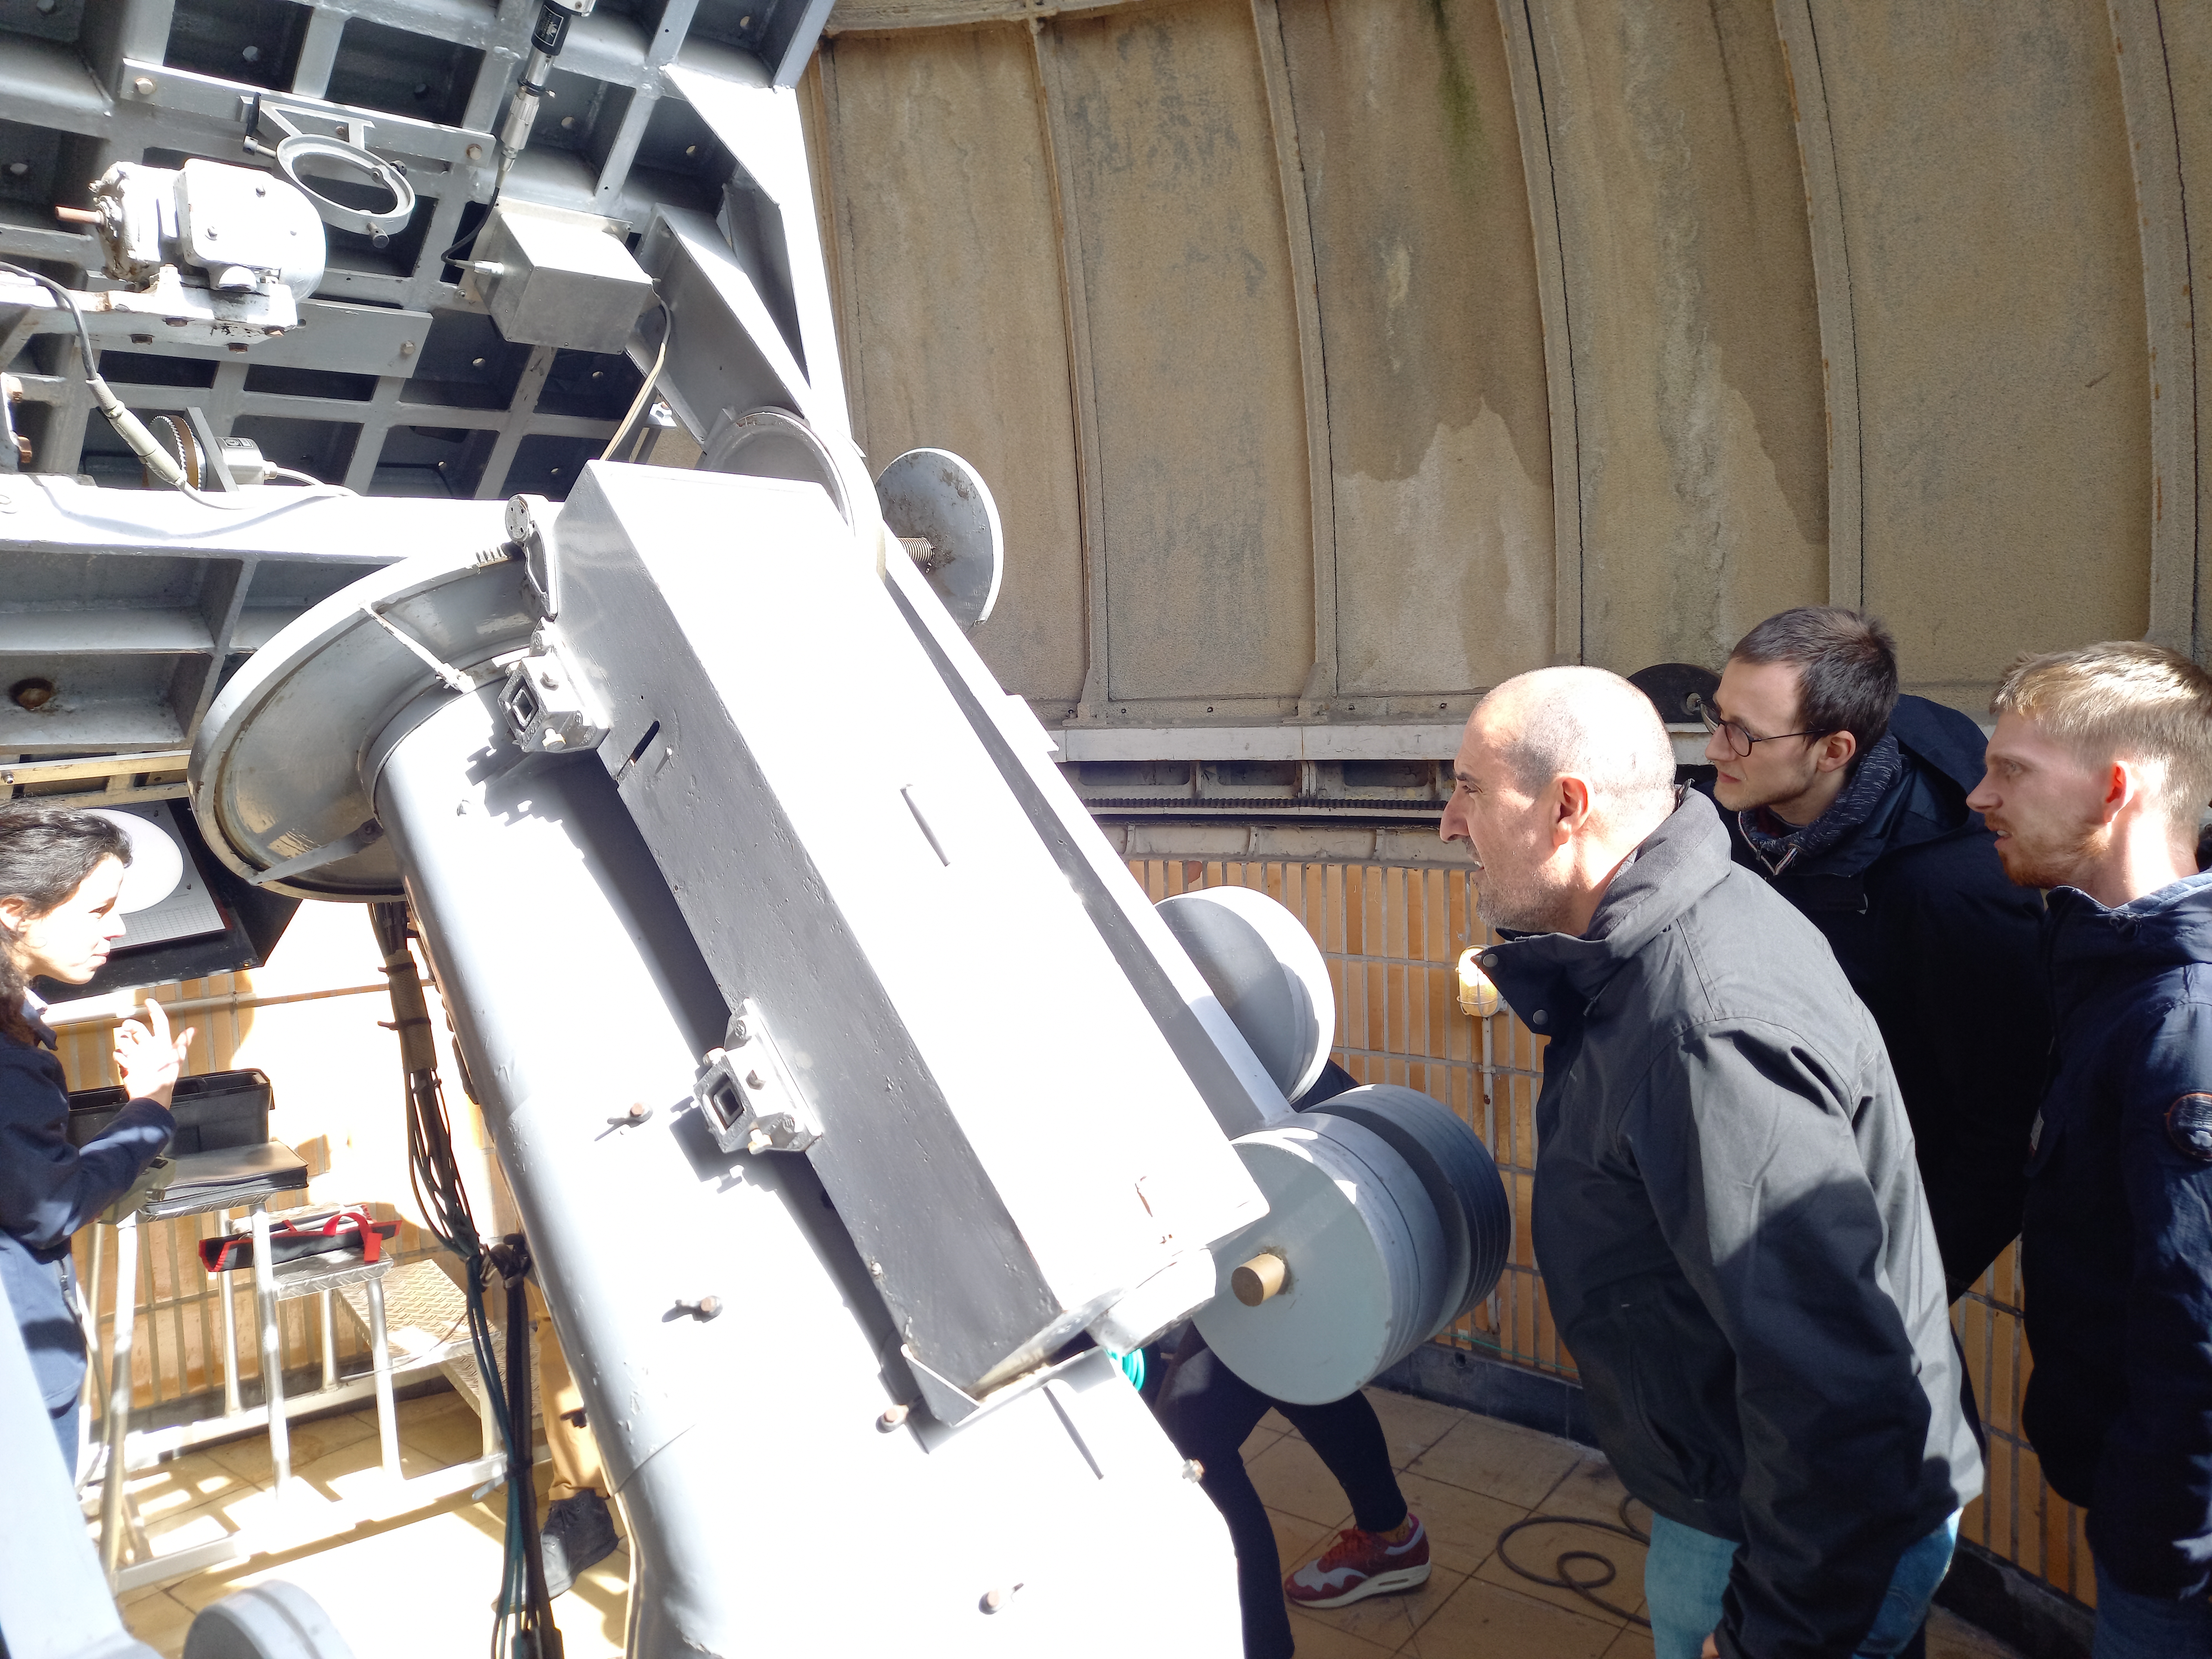
Sabrina in action.
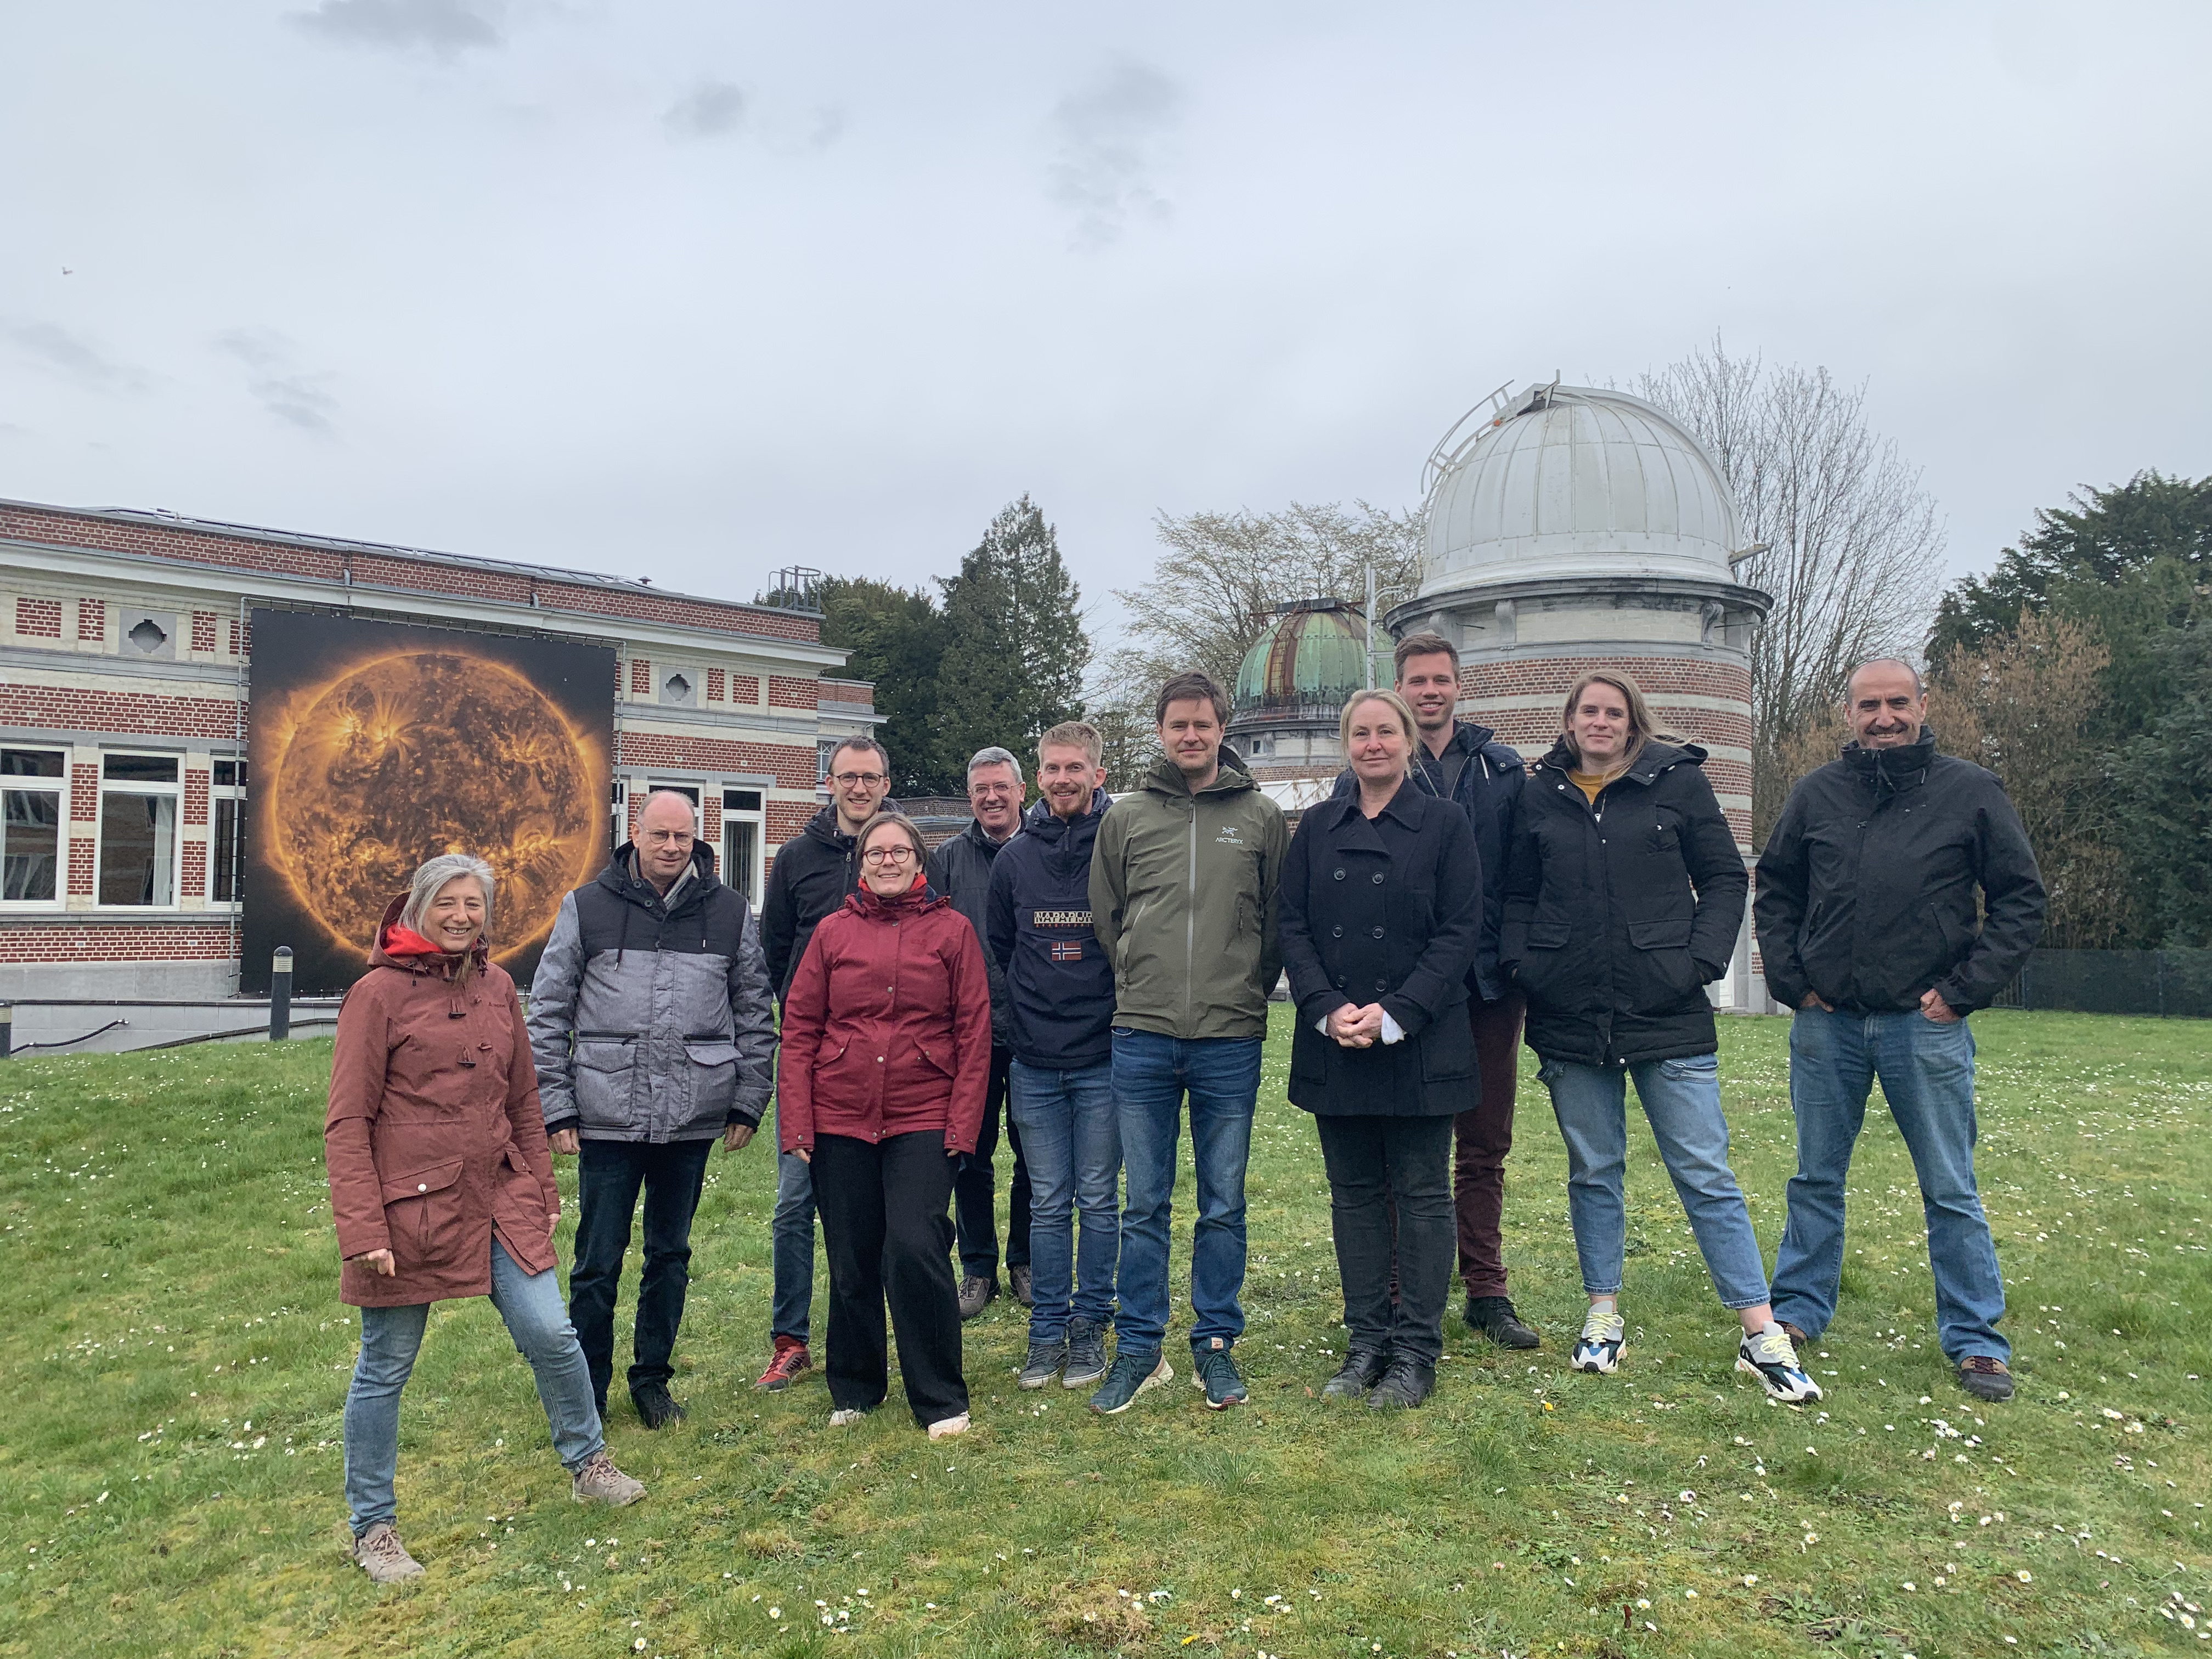
All participants were enthousiast and a pleasure to work with.
Thanks to our guest speakers, Sabrina, Lenka, Antonio, Eelco, Jean-Marie, Nicolas and Klaus.
The dates of the SWICs in autumn still need to be fixed. We will announce them in the STCE Newsletter and put them in the STCE calendar.
The SIDC space Weather Briefing
The Space Weather Briefing presented by the forecaster on duty from Mar 19 to 26. It reflects in images and graphs what is written in the Solar and Geomagnetic Activity report: https://www.stce.be/briefings/20230327_SWbriefing.pdf
If you need to access the movies, contact us: stce_coordination at stce.be
International Sunspot Number by SILSO (20 Mar 2023 - 26 Mar 2023)
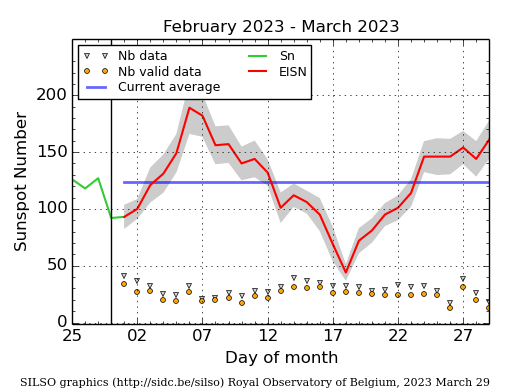
The daily Estimated International Sunspot Number (EISN, red curve with shaded error) derived by a simplified method from real-time data from the worldwide SILSO network. It extends the official Sunspot Number from the full processing of the preceding month (green line), a few days more than one solar rotation. The horizontal blue line shows the current monthly average. The yellow dots give the number of stations that provided valid data. Valid data are used to calculate the EISN. The triangle gives the number of stations providing data. When a triangle and a yellow dot coincide, it means that all the data is used to calculate the EISN of that day.
Noticeable Solar Events (20 Mar 2023 - 26 Mar 2023)
| DAY | BEGIN | MAX | END | LOC | XRAY | OP | 10CM | TYPE | Cat | NOAA |
| 20 | 0119 | 0148 | 0226 | M1.2 | 3256 |
| LOC: approximate heliographic location | TYPE: radio burst type |
| XRAY: X-ray flare class | Cat: Catania sunspot group number |
| OP: optical flare class | NOAA: NOAA active region number |
| 10CM: peak 10 cm radio flux |
PROBA2 Observations (20 Mar 2023 - 26 Mar 2023)
Solar Activity
Solar flare activity fluctuated from very low to moderate during the week.
In order to view the activity of this week in more detail, we suggest to go to the following website from which all the daily (normal and difference) movies can be accessed: https://proba2.oma.be/ssa
This page also lists the recorded flaring events.
A weekly overview movie (SWAP week 678) can be found here: https://proba2.sidc.be/swap/data/mpg/movies/weekly_movies/weekly_movie_2023_03_20.mp4.
Details about some of this week's events can be found further below.
If any of the linked movies are unavailable they can be found in the P2SC movie repository here: https://proba2.oma.be/swap/data/mpg/movies/.
Monday March 20
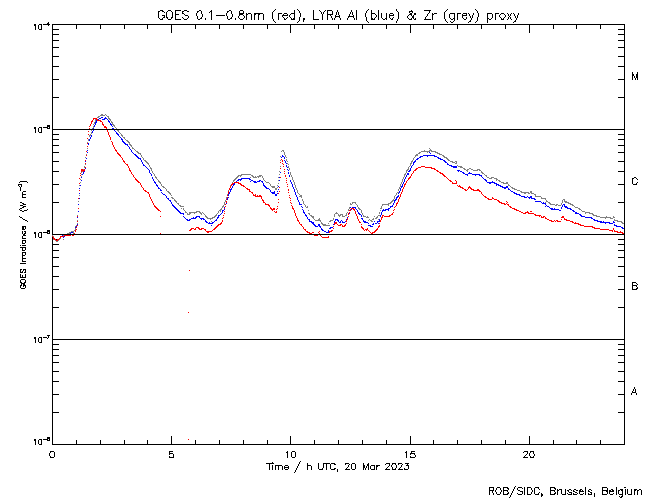
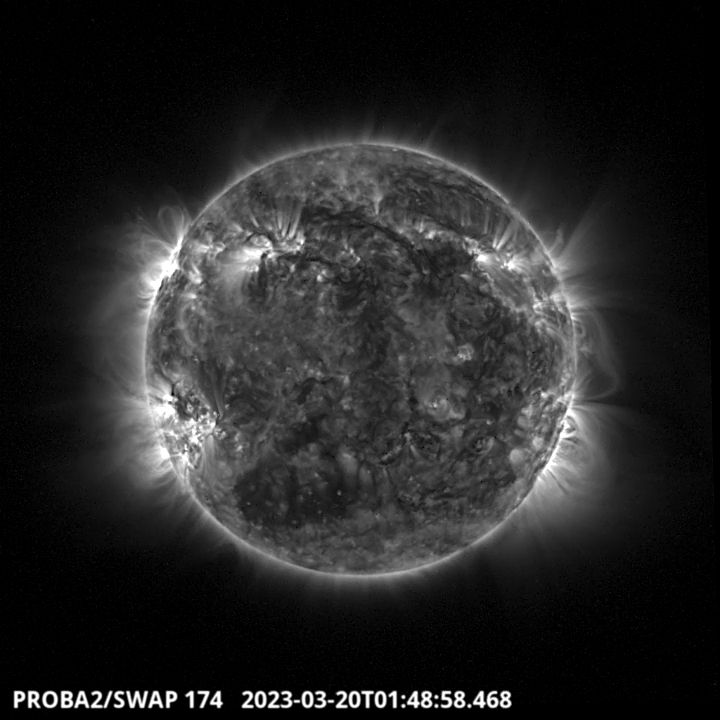
The largest and only M-flare of the week, an M1.2, was observed by LYRA (top panel) and SWAP (bottom panel). The flare occurred on 2023-Mar-20 (peak at 01:48 UT) in the south-eastern hemisphere, and it was associated with NOAA AR3256.
Find a SWAP movie of the event here: https://proba2.sidc.be/swap/movies/20230320_swap_movie.mp4.
Geomagnetic Observations in Belgium (20 Mar 2023 - 26 Mar 2023)
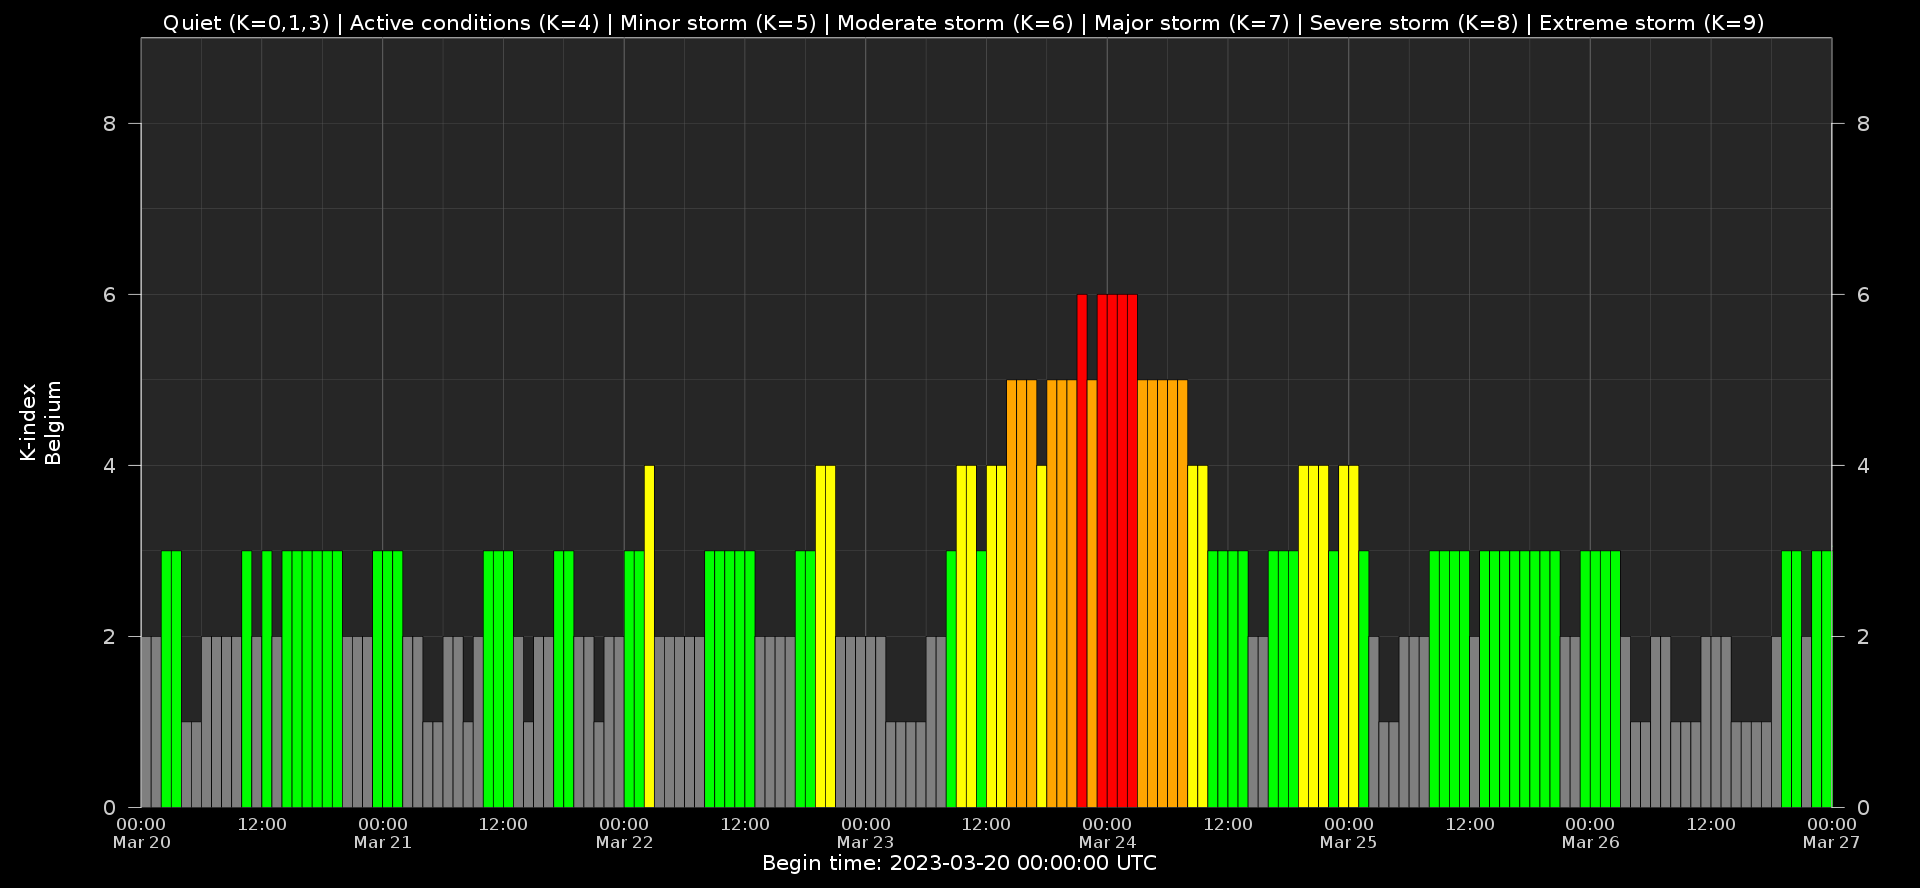
Local K-type magnetic activity index for Belgium based on data from Dourbes (DOU) and Manhay (MAB). Comparing the data from both measurement stations allows to reliably remove outliers from the magnetic data. At the same time the operational service availability is improved: whenever data from one observatory is not available, the single-station index obtained from the other can be used as a fallback system.
Both the two-station index and the single station indices are available here: http://ionosphere.meteo.be/geomagnetism/K_BEL/
Review of ionospheric activity (20 Mar 2023 - 26 Mar 2023)
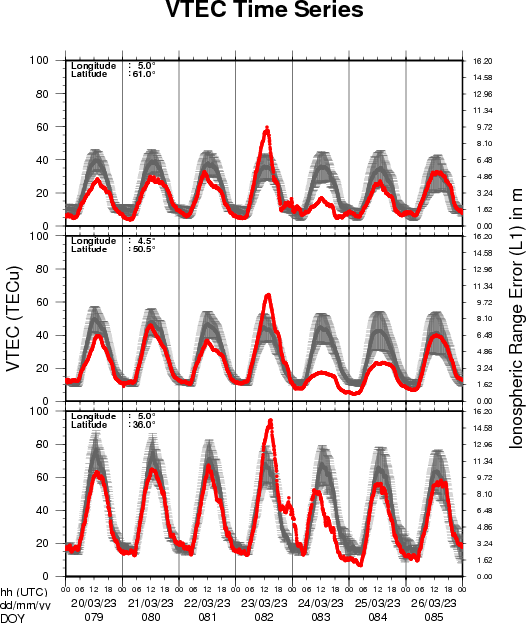
The figure shows the time evolution of the Vertical Total Electron Content (VTEC) (in red) during the last week at three locations:
a) in the northern part of Europe(N 61deg E 5deg)
b) above Brussels(N 50.5deg, E 4.5 deg)
c) in the southern part of Europe(N 36 deg, E 5deg)
This figure also shows (in grey) the normal ionospheric behaviour expected based on the median VTEC from the 15 previous days.
The VTEC is expressed in TECu (with TECu=10^16 electrons per square meter) and is directly related to the signal propagation delay due to the ionosphere (in figure: delay on GPS L1 frequency).
The Sun's radiation ionizes the Earth's upper atmosphere, the ionosphere, located from about 60km to 1000km above the Earth's surface.The ionization process in the ionosphere produces ions and free electrons. These electrons perturb the propagation of the GNSS (Global Navigation Satellite System) signals by inducing a so-called ionospheric delay.
See http://stce.be/newsletter/GNSS_final.pdf for some more explanations ; for detailed information, see http://gnss.be/ionosphere_tutorial.php
Review of solar activity
Flares
The solar flaring activity started moderate with an M1.3-class flare produced by NOAA Action Region 3256 (beta), peak time 01:48 UTC on March 19th, and decreased to low levels for the rest of the week. Twelve active regions were seen, most of them relatively simple. NOAA AR 3256 was the most magnetic complex region as it evolved to type beta-gamma.
Solar wind disturbances: coronal mass ejections
The solar surface was streaked by filaments and multiple eruptions were observed.
A filament erupted in the north-east quadrant near NOAA AR 3258 around 13:00 UTC on March 20th. The active region produced at that time a long duration C4.4 flare with start time 13:00 UTC, peak time 13:34 UTC, end time 18:14 UTC. The associated CME was a partial halo first observed in the LASCO/C2 imagery around 15:00 UTC. While the bulk of the CME was estimated off the Sun-Earth line, a glancing blow on Earth was expected on March 23rd.
Earlier another partial halo CME lifted off the south-west quadrant around 14:14 UTC on March 20th, accompanied by large scale magnetic field reconfiguration. This CME was considered to be back-sided.
A C1.7 flare from NOAA AR 3258 on March 21st, peak time 10:29 UTC, resulted in a plasma eruption with pronounced on-disc dimming, well visible in the AIA images, and a coronal wave across the disc starting from the north-east quadrant near the central meridian and ending with a consequent prominence eruption on the west limb. A minor glancing blow from this eruption was possible on March 24th, but no clear arrival was observed in the situ near Earth solar wind data.
Solar wind disturbances: coronal holes
A large negative polarity coronal hole crossed the central meridian on March 20th and the related high speed stream was expected to reach Earth late on March 23r or March 24th.
Energetic particles in the Earth environment
Note that the fluxes mentioned below are measured by the geostationary satellite GOES.
The week started with slightly elevated levels of the greater than 10 MeV proton flux as a result of partial halo CME activity from the previous week. The enhancements gradually declined throughout the week to remain under radiation storm levels throughout the entire week.
The greater than 2 MeV electron flux was below the 1000 pfu threshold throughout the entire the week. The corresponding electron fluence was at nominal levels.
Review of geomagnetic activity
Solar wind parameters at L1
The solar wind parameters at the beginning of the week were at the background slow solar wind levels and exhibited minor enhancements on March 21st through March 22nd with enhanced speed and temperature possibly suggesting expected mild high speed stream (HSS) arrival from a small positive polarity coronal hole.
The solar wind parameters became highly disturbed on March 23rd and March 24th with a prominent ICME arrival possibly related to the partial halo CME from March 20th. During the ICME passage, the solar wind speed was moderately enhanced with velocities close to 500 km/s. The interplanetary magnetic field reached a peak value of 22 nT around 14 UTC on March 23rd. From the early UTC evening on March 23rd, the B field registered long periods with magnitude of approximately 20 nT and steady north-south, Bz component, with values close to -16 nT. The lowest negative Bz registered was -17.5 nT.
Towards the end of March 24th the ICME influence declined and a HSS from the negative polarity coronal hole which crossed the central meridian on March 20th was measured. The solar wind velocity initially increased up to 580 km/s and at the end of the week reached 700 km/s. The interplanetary magnetic field (B) gradually decreased during the HSS arrival with a maximum value of 8 nT on March 26th and a weak minimum Bz of -5 nT.
Geomagnetic impact
The geomagnetic conditions significantly varied throughout the week with quiet, unsettled and active levels from March 19th to March 22nd. The geomagnetic conditions reached major storm levels on March 23 and severe storm level (Kp was 8-) on March 24. Over Belgium, a moderate storm was observed on March 23 and 24.
Quiet to active geomagnetic conditions were observed on March 25th and the week ended with quiet to unsettled conditions.
Calendar
Check out our activity calendar: activities and encounters with the Sun-Space-Earth system and Space Weather as the main theme. We provide occasions to get submerged in our world through educational, informative and instructive activities.
If you want your event in our calendar, contact us: stce_coordination at stce.be
* April 6, CmPA Seminar: Identification, Tracking and Analysis of Early-Stage CME Flux Ropes from Simulation Data; room 200B 02.16, KU Leuven, Heverlee, Belgium
* April 21, BIRA-IASB seminar: High resolution modelling of atmospheric composition over Antwerp, Belgium, Nicolet@spacepole and Teams, Brussels, Belgium
* April 28, STCE seminar: Space Weather Tools in Support of Space Radiation Operations, Nicolet@spacepole and Teams, Brussels, Belgium
* May 22-24, STCE Space Weather Introductory Course, Brussels, Belgium - FULL
* May 25, STCE seminar: Comparative study of a constant-alpha force-free field and its approximations in an ideal toroid, Meridian room@spacepole and zoom, Brussels, Belgium
* May 25, RMI Seminar: Towards a new hydrometeors identification tool at the RMI, conference room of the RMI, Brussels, Belgium
* May 29 - June 1, PITHIA-NRF Training School, Rome, Italy
Check: https://www.stce.be/calendar