
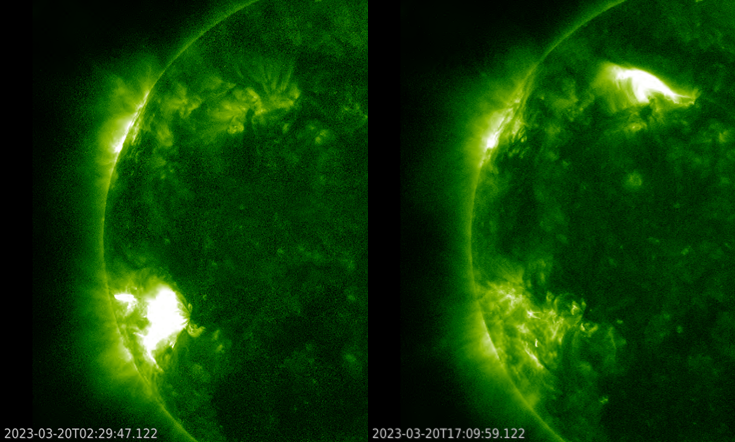
On 23 and 24 March, the earth environment was hit by a strong interplanetary coronal mass ejection (ICME). The geomagnetic field got very disturbed with the Kp-index eventually reaching severe geomagnetic storm levels (Kp = 8-) early on 24 March. More information on geomagnetic indices and geomagnetic disturbance levels can be found at the STCE's SWx classification page. The source of the ICME was most likely a solar eruption that took place on 20 March: an M1 flare in NOAA 3256 near the southeast limb early that day, or a long duration C4 flare in NOAA 3258 in the northeast solar quadrant. Both eruptions are shown in the SDO/AIA 094 imagery underneath.
When the ICME arrived, no shock was observed as can be seen in the solar wind data chart from the DSCOVR satellite. The solar wind speed (yellow curve) did not change abruptly and even gradually decreased from around 500 km/s to 450 km/s. The density (orange curve) first rose to high values around 50 particles / cm3, quickly to drop to more typical values near 10 particles / cm3 around 13:45 UTC on 23 March. The magnetic field of the passing ICME then turned southward (Bz, red curve) soon after, with Bz near -15 nT for nearly 9 consecutive hours, from about 17h UTC until 04h UTC the next day as the CME core passed.
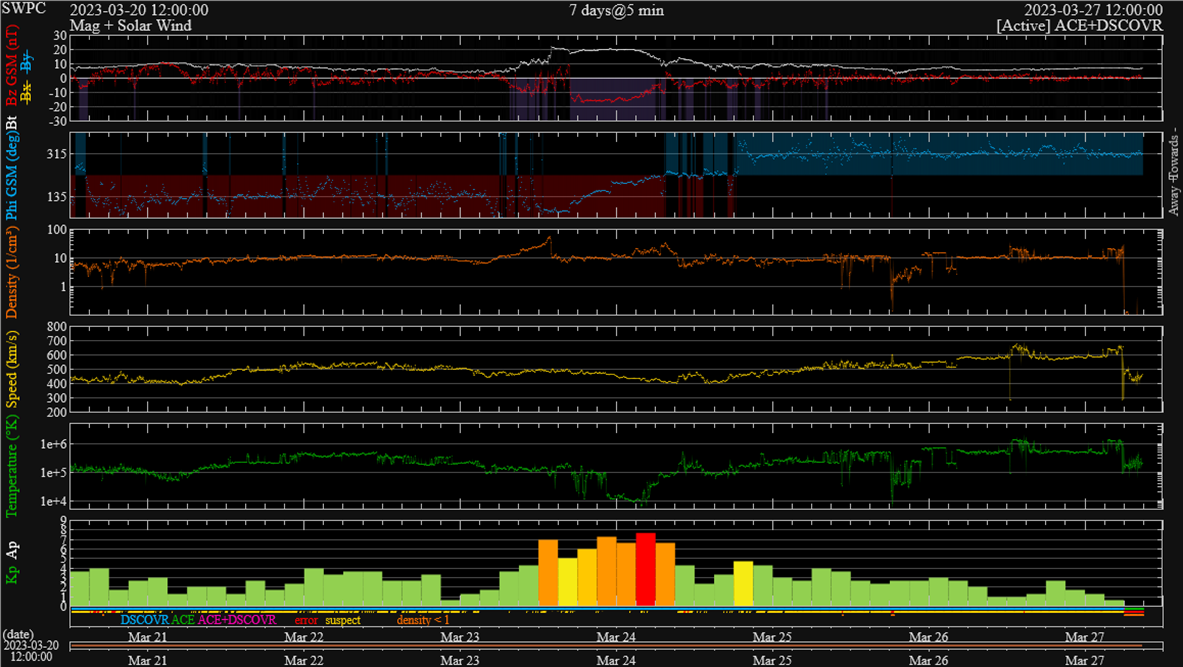
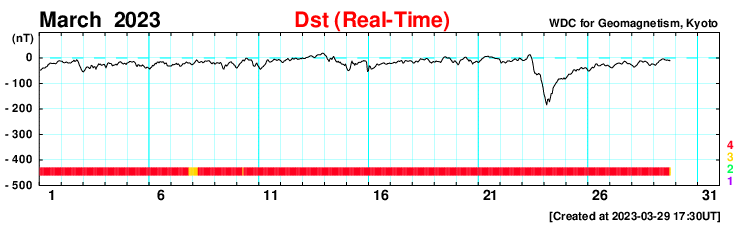
This peculiar set of solar wind conditions resulted of course in a much stronger geomagnetic storm than initially anticipated just a few days earlier. Instead of the expected minor or moderate storm (Kp of 5 or 6), Kp eventually reached severe storming levels (Kp = 8-) during the 03-06 UTC interval in the morning of 24 March (see the bottom chart above). Kp-wise, this was the strongest storm since 4 November 2021 (see this STCE newsitem). The (provisional) Dst index reached -184 nT, a value not seen since the "Solstice storm" on 23 June 2015 when it was at -198 nT (Kyoto WDC).
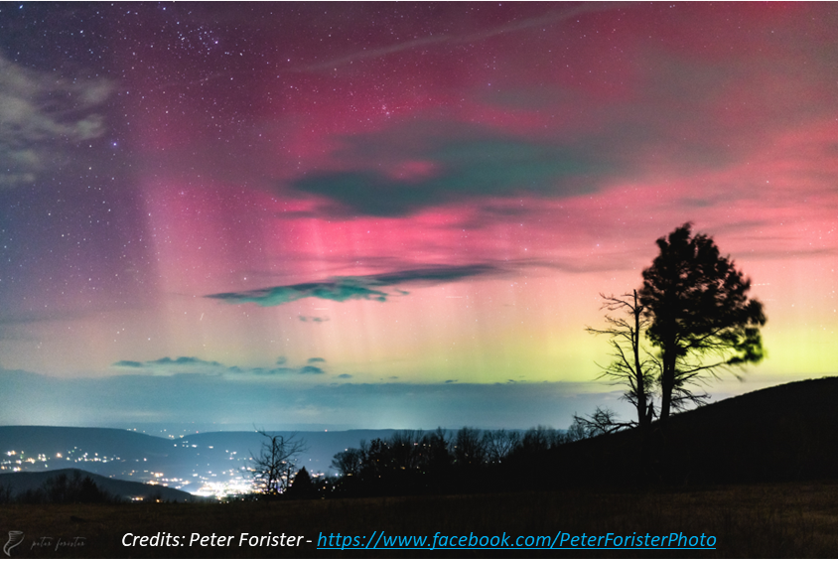
The severe geomagnetic storm resulted in aurora that were visible and/or photographed at relatively low latitudes (source: https://www.spaceweather.com/ ). Most of these pictures showed the red hues of the aurora, which are typically found at higher altitudes (200 km or higher) than the green coloured aurora (between 100 and 200 km) and thus can be seen from further away (see BIRA-IASB). Thus, long-exposed pictures taken in Europe (Slovenia) and the United States (New Mexico, North Carolina, and even Florida) showed faint reddish aurora just above the horizon. For these locations near 30 degrees latitude, the polar lights were not visible to the naked eye. But that gradually changed for sites located about 5 to 10 degrees more poleward. Peter Forister (https://www.facebook.com/PeterForisterPhoto ; image underneath) photographed the aurora from Stanley, Virginia (latitude +38.7 degrees). The photos were taken in Shenandoah National Park between 22:45 and 23:45 local time, looking northwest. He reported that "The lights were visible to my naked eye for about an hour. The vibrant green and red colors only lasted about 15 minutes during an intense "Substorm" around 23:00. These are long exposure photographs (between 4 and 6 seconds long each), and so are brighter than what I was able to see. The colors are accurate to the very deep reds and greens that I could see!"
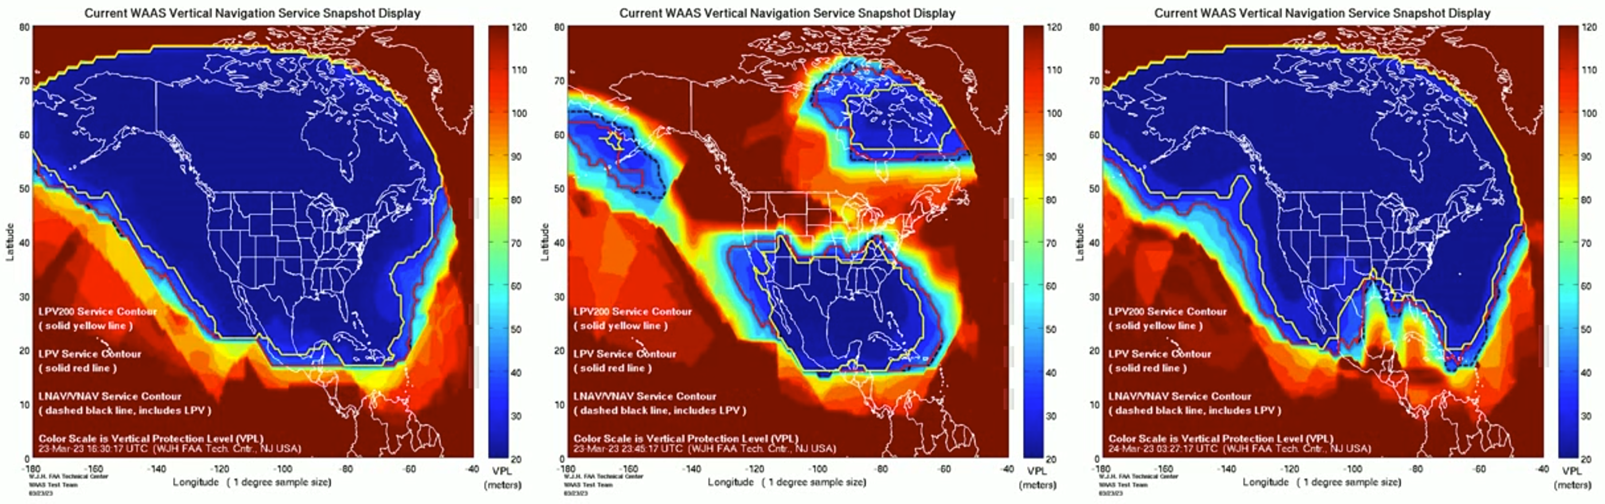
As a result of this severe geomagnetic storm, some GNSS-based applications for the civil aviation did not reach their typical availability, as can be gauged from the imagery underneath for the USA/Canada (WAAS), covering the period 23 March (09:00 UTC) until 24 March (10:00 UTC). Blue colours mean good availability, red/brown means significantly degraded availability. Clearly the systems were underperforming while the geomagnetic storm was ongoing. In Europe, similar observations were made for the EGNOS system.

