- Table of Content
- 1.Ionospheric st...
- 2.e-SWAN newslet...
- 3.Review of sola...
- 4.Review of geom...
- 5.PROBA2 Observa...
- 6.International ...
- 7.Noticeable Sol...
- 8.Geomagnetic Ob...
- 9.Things to do
2. e-SWAN newsletter
3. Review of solar activity
4. Review of geomagnetic activity
5. PROBA2 Observations (3 Apr 2023 - 9 Apr 2023)
6. International Sunspot Number by SILSO
7. Noticeable Solar Events
8. Geomagnetic Observations in Belgium
9. Things to do
Ionospheric storm!
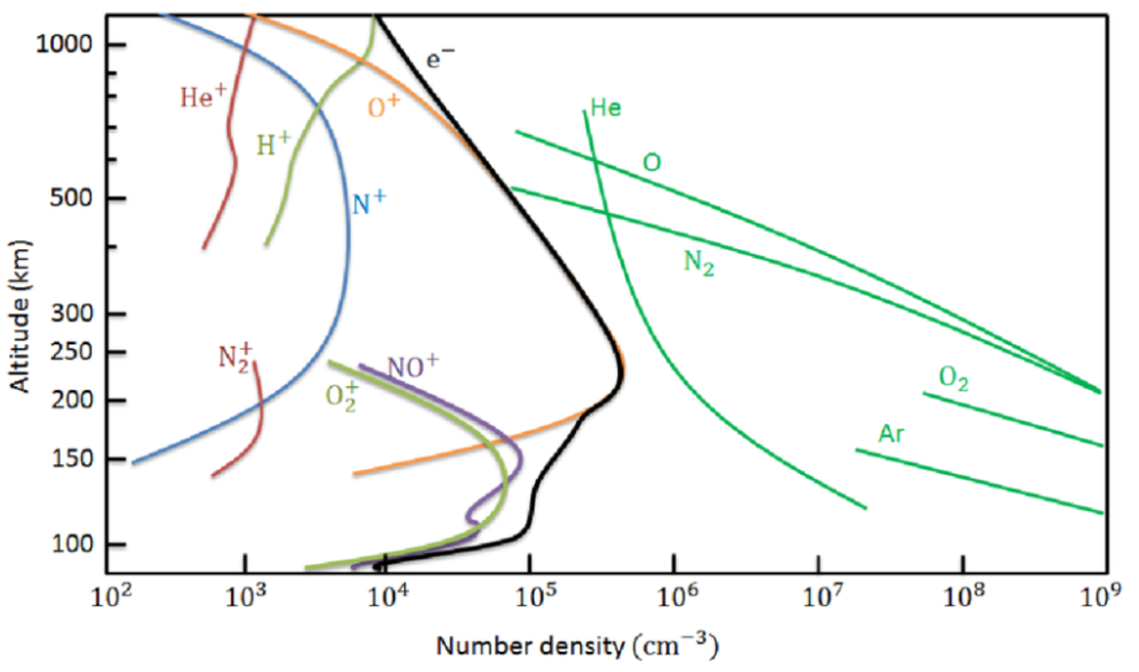
The ionosphere is a partially ionized layer of the Earth's upper atmosphere located about 60km to 1000km above the Earth's surface. It consists of a changing concentration of neutral atoms and molecules ("neutrals"), ions and free electrons. Above about 60km the number of these free electrons is sufficient to affect the propagation of electromagnetic waves, e.g. the radio-communication between satellites and the ground-stations. The maximum ionization occurs at altitudes of about 250 to 400 km ("F-layer"), and is mainly due to solar extreme ultraviolet radiation ionizing atomic oxygen (O) which is the main neutral at that altitude (ROB/GNSS ; http://gnss.be/ ). This can be seen in the graph underneath, with the density of neutrals and ions indicated by respectively the green and other-coloured lines (Akbari 2015 DOI: https://hdl.handle.net/2144/16310 ; Kelley 1989 - eBook ISBN: 9780323148054 ; Johnson 1969 - https://ui.adsabs.harvard.edu/abs/1969AIQSY...5..197J/abstract ). The electron density is shown by the thick black line, and coincides with the evolution of the density of ionized oxygen (O+ ; orange line). The ionosphere consists mainly of 3 layers (D-, E-, and F-layer), with usually only the F-layer remaining during the night. Since the main cause of ionization in the atmosphere is solar radiation, the behaviour of the quiet ionosphere follows a daily, seasonal and solar cycle pattern. The integrated electron density along the path between the transmitter (satellite) and receiver (ground-station) where the radio waves are propagating, is called the total electron content (TEC), which is measured in TEC units (1 TECU = 10^16 electrons per square meter). This newsitem will only consider the vertical TEC (VTEC), which is the TEC directly (perpendicular to the Earth's surface) above the ground-station.
An ionospheric storm is a perturbation of the ionization density at F-region heights. Geomagnetic storms, being the result of a coronal mass ejection or a high-speed solar wind stream passing the Earth, are one of the main sources of ionospheric storms as solar wind energy is captured by the magnetosphere, then transformed and dissipated in the polar upper atmosphere (Prölss 1995 - ISBN-13: 978-1138559028). The evolution of an ionospheric storm is usually based on the evolution of the electron density, as this is the easiest accessible ionospheric parameter. Due to the large variability of the storms and the numerous ongoing processes during such a storm, an ionospheric storm is usually described simply by a positive phase (positive storm) and a negative phase (negative storm), corresponding respectively to a large enhancement and depletion of the maximum electron density compared to the quiet day curve.
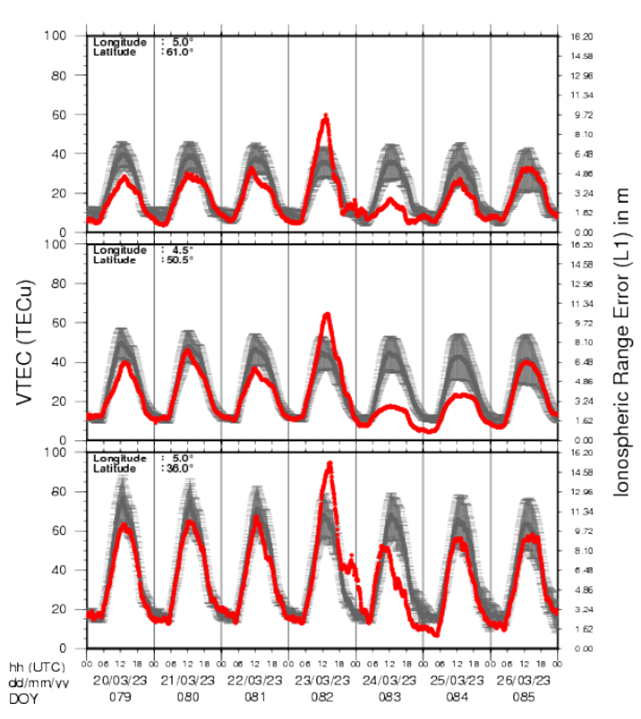
A very nice example of the two phases of such an ionospheric storm took place during the severe geomagnetic storm of 23 and 24 March 2023 (see this STCE newsitem at https://www.stce.be/news/638/welcome.html ). The graph underneath shows the evolution of the VTEC at 3 stations located near the meridian of 5 degrees East: one located in Norway (latitude 61 degrees ; upper graph), one in Brussels (latitude 50.5 degrees ; middle), and one in North-Africa (Algeria, latitude 36 degrees ; lower graph). Each of these 3 graphs shows the local VTEC (red) for the period 20-26 March against the normal ionospheric behaviour expected based on the median VTEC from the 15 previous days (in grey). A positive ionospheric storm can clearly be distinguished in the VTEC evolution on 23 March and a negative storm on 24 March. For Brussels, the negative storm persisted into 25 March. This is a typical behaviour: the disturbed variation in TEC is usually positive in the first 24 hours of the storm. The increase in content may occasionally be very large, with values reached that may be as much as twice that of the undisturbed ionosphere. In the second 24 hours or so the content has decreased below that of the undisturbed ionosphere. The disturbance variation in content has usually disappeared by early in the third storm day, if not earlier (see e.g. the review by Mendillo (2006 - https://doi.org/10.1029/2005RG000193 ).
The mechanism behind a negative ionospheric storm is fairly well understood. Geomagnetic activity can lead to atmospheric disturbances changing the neutral composition which in turn can result in a decrease in the ratio between atomic oxygen and molecular nitrogen. This change in neutral composition results in a depletion of the electron content, and thus in a negative ionospheric storm. See Prölss (1995 - https://doi.org/10.1201/9780203713297 ) and Ratovsky et al. (2020 - https://doi.org/10.3390/atmos11121308) for the details of this mechanism. The mechanisms behind the positive phase of an ionospheric storm constitute an area of active research ((see e.g. PITHIA - https://pithia-nrf.eu/ ). The main idea is that positive ionospheric storms are caused by upward transport of ionization, where the recombination to neutrals decreases and the electron production increases, leading to an overall increase in the electron density. The main question is how this uplifting happens. An increase in the atomic oxygen density, a change in meridian winds which move the ionosphere to higher altitudes where recombination rates are lower, traveling ionospheric disturbances (TIDs) and disturbed electric fields that cause plasma redistribution are -amongst other- used to explain the nature of positive ionospheric storms (Kassa et al. 2023 - https://doi.org/10.1016/j.jastp.2023.106003 ).
The global ionospheric maps underneath (Credits: DLR/IMPC - https://impc.dlr.de/ ) provide near real-time information about VTEC derived from ground-based GNSS measurements (GNSS: Global Navigation Satellite System, such as GPS and GALILEO). The compilation shows the global VTEC maps at a fixed hour (13:00 UTC) highlighting the phases of the ionospheric storm. The hour was chosen to correspond to the highest VTEC recorded at Brussels. The maps show an undisturbed day (22 March), and the effects from the 23-24 March geomagnetic storm. The positive phase on 23 March can clearly be distinguished in the enhanced VTEC observed that day, and the negative phase (VTEC much lower than during undisturbed days) on 24 and 25 March. A clip at a 1 hour cadence covering the period from 22 to 25 March is available in the online version of this newsitem at https://www.stce.be/news/640/welcome.html
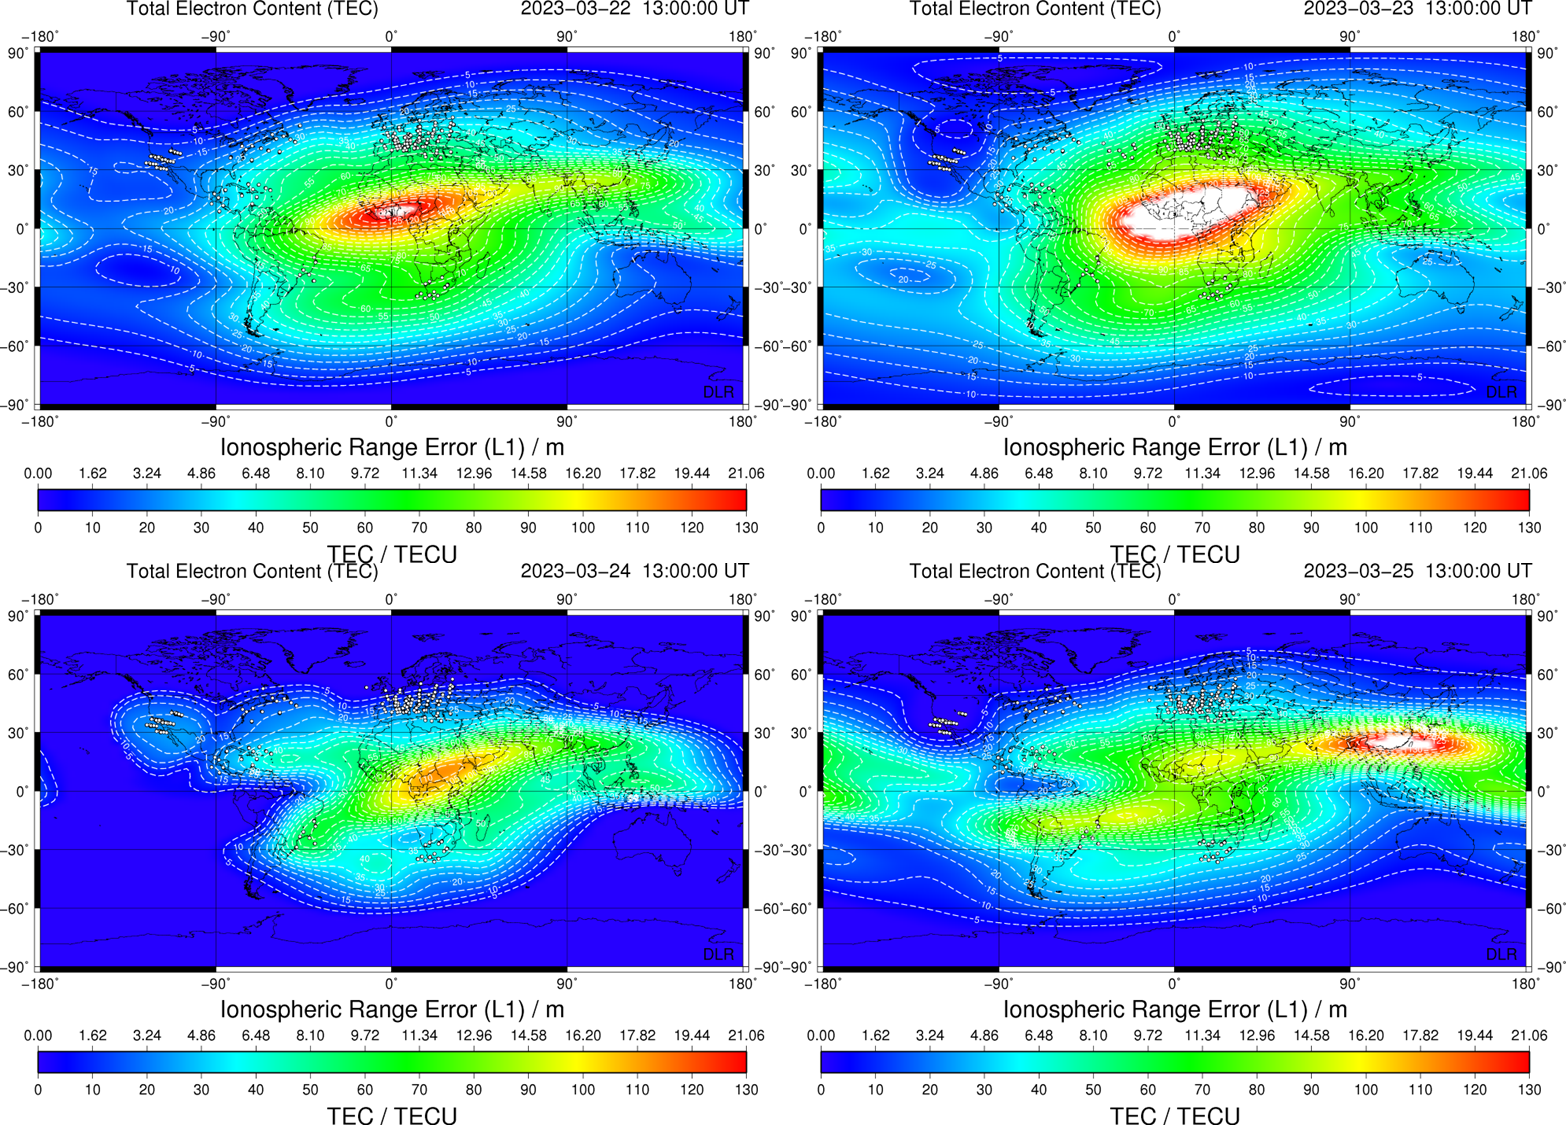
Credits to DLR who is maintaining the IMPC services. "Ionosphere Monitoring and Prediction Center" (IMPC) is operated by the German Aerospace Center (DLR) at the Neustrelitz location.
The community’s interest in this research field is high because of the significant impact of ionospheric storm effects on the reliable performance of technological systems. Negative ionospheric storm effects (i.e. when VTEC is well below their normal levels) cause serious problems in ground-based HF radio communications, while on the other hand, positive ionospheric storm effects (i.e. when VTEC is well above their normal levels) can cause serious problems such as e.g. ionospheric scintillation effects in satellite communication and navigation (GNSS). On top of that, a set of dependencies (e.g., seasonal, local time, latitudinal, altitude) compile a rather complicated scene for the appearance of ionospheric storm effects, thus keeping the topic a relevant and vivid research field (Tsagouri 2022 - https://doi.org/10.3390/atmos13020346 ).
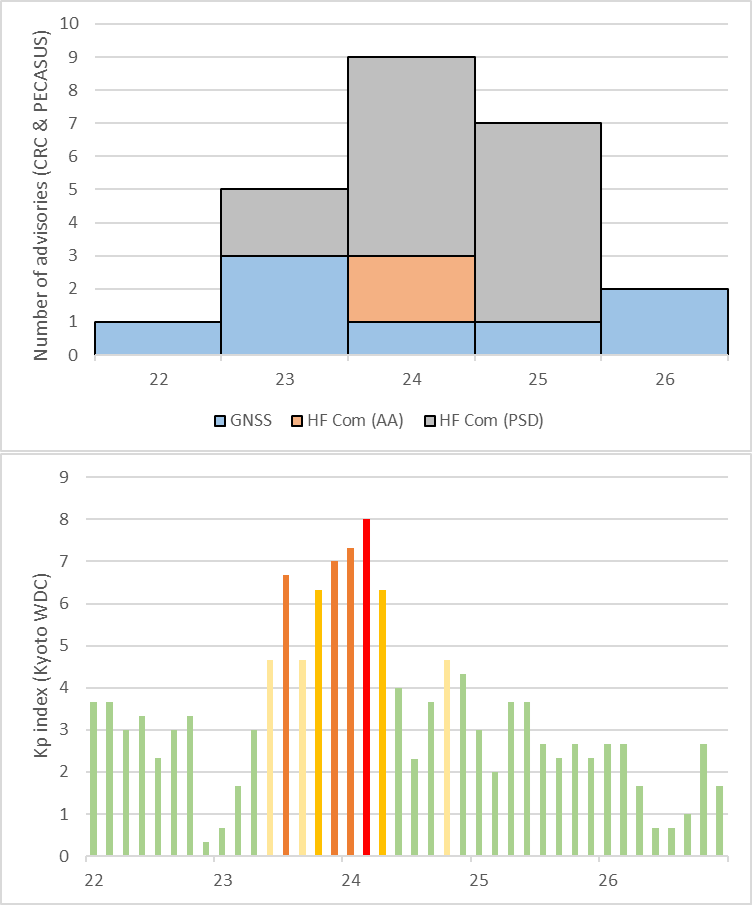
In the case of the 23-24 March geomagnetic storm, a large number of advisories were issued for the benefit of the civil aviation (ICAO - https://www.icao.int/Pages/default.aspx). In particular on 24 and 25 March, alerts pertaining to High Frequency (HF) communication problems have been sent. They concerned mostly Post Storm Depressions (PSD), i.e. a decrease of the maximum frequency in HF that can be used (MUF: Maximum Useable Frequency). This is no surprize, as those days coincided with the negative phase of the ionospheric storm, meaning a lower VTEC and thus a weakened F-layer having difficulties to reflect the higher frequencies of the HF radio window (see e.g. Fiori et al. 2022 - https://doi.org/10.1051/swsc/2022017 ). The upper diagram underneath shows, for the period from 22 until 26 March, the daily number of advisories issued based on CRC and internal PECASUS (https://pecasus.eu/ ) communications. No distinction has been made for opening, follow-up or closing of advisories, and they are split into GNSS, HF Com AA (Auroral Absorption), and HF Com PSD (Post Storm Depression). The lower diagram underneath shows the evolution of the Kp index (Kyoto WDC - https://wdc.kugi.kyoto-u.ac.jp/ ) for the same period.
e-SWAN newsletter
A new newsletter is created
The announcement:
Dear Colleagues
I am glad to inform you about the issuing of the Newsletter of the European Space Weather and Space Climate Association (E-SWAN, https://eswan.eu). You can read the first number at this link: https://eswan.eu/index.php/newsletter.
The E-SWAN Newsletter is distributed monthly by email to subscribers on the 7th day of each month. To subscribe, please send an email to pubcom@eswan.eu.
Sections of the Newsletter:
General News
News from JSWSC
News from ESWW Programme Committee
News from Awards Committee
News from E-SWAN working groups
Employment Opportunities
School Announcements
Meeting Announcements
Miscellaneous
Currently, the following sections of the newsletter are open to all E-SWAN members and subscribers:
Employment Opportunities
School Announcements
Meeting Announcements
Miscellaneous
Content Guidelines: We accept original content related to Space Weather and Space Climate, and related fields. Content may include research updates, announcements, job postings, and relevant events.
Submission Deadline: The deadline for submitting content is the last day of the preceding month. For example, the deadline for the June Newsletter is May 31st. Late submissions will not be considered for the upcoming issue but can be considered for the following month.
Submission Process: To submit your content, please email it to our Newsletter Editor at pubcom@eswan.eu with the subject line "[E-SWAN NEWS] Your Submission Title - Issue Month”.
In the body of the email, please include:
the suggested title for your news (120 characters or less);
a link to an already existing webpage or resources containing the news information;
your name, and affiliation.
If a webpage containing the news information does not exist, in the body of the email please include a text of no more than 500 words, and a maximum of two high-resolution images in either JPEG or PNG format (300dpi).
We look forward to receiving your submissions and making our Newsletter a valuable resource for our Space Weather and Space Climate community. If you have any questions, please do not hesitate to contact our Newsletter Editor at pubcom@eswan.eu.
Best Regards,
Luca Spogli,
President of E-SWAN
Review of solar activity
Flares
Eight (8) active regions were observed on the sun as seen from Earth. The satellite GOES reported two M-class and 36 C-class flares. The majority of the flares originated from the Catania sunspot group 50 (NOAA AR 3272). The strongest flare reported this week was the GOES M3.0 flare which peaked at 05:53 UT on April 06. The flare originated from the Catania sunspot group 50 (NOAA AR 3272), at that moment rotating on the solar disc visible from Earth.
Solar wind disturbances: coronal mass ejections (CMEs)
Four wide CMEs were reported this week. One was expected to arrive to Earth.
A first partial halo CME was observed on April 03, first time seen in the SOHO/LASCO C2 field of view at 07:36 UT. the CACTus software reported a speed of about 300 km/s and an angular width of about 200 degrees. This was a back-side event.
The second wide CME (first observed in the SOHOS/LASCO C2 field of view at 07:12 UT on April 07) had angular width of about 120 degrees and velocity of about 500 km/s (as reported by CACTUS software). The CME source region was at and behind the East solar limb.
The third wide CME had angular width of about 100 degrees and velocity of about 500 km/s (as reported by CACTUS software), and was first observed in the SOHOS/LASCO C2 field of view at about 11:36 UT on April 07. This CME was associated with the filament eruption in the south-west quadrant of the Sun (about S40 - S30). Due to the combination of the CME width, its source position and the characteristic that the bulk of the CME mass was ejected southward from the Sun - Earth line, we did not expect this CME to arrive to Earth.
The fourth partial halo CME, with the source region situate at the North-West quadrant of the Sun and rather close to the West solar limb, was observed in the morning of April 09. The CME was first observed in the SOHO/LASCO C2 field of view at about 09:24 UT, it had angular width of about 180 degrees and velocity of about 500 km/s (as reported by the CACTUS software). This CME was expected to arrive at Earth in the morning of April 13.
Solar wind disturbances: coronal holes
A small, positive coronal hole crossed the central meridian on April 07.
Energetic particles at GEO
The fluxes are measured by GOES, in geostationary orbit.
The greater than 10 MeV proton flux was at background level during the whole week.
The greater than 2 MeV electron flux was most of the week fluctuating around the threshold value of 1000 pfu. The 24h electron fluence was most of the time at moderate to normal level.
Review of geomagnetic activity
Solar wind at L1
During first 3.5 days of the week, Earth was inside the fast solar wind, (reaching the maximum velocity values of about 530 km/s). Around midday of April 05, the solar wind speed decreased and in about half a day reached the value of about 400 km/s. The rest of the week, the solar wind speed remained around 400 km/s.
The in situ data showed arrival of the shock wave at about 22:00 UT on April 09, followed by the ICME. The solar source of this CME was not clear. One of the possibility is a faint, wide CME observed first time in the SOHO/LASCO C2 field of view at 09:24 UT on April 06, above the East solar limb. The other possibility is that the source was a stealth CME with no clear on-disc signatures.
Geomagnetic conditions
The geomagnetic conditions were during the major part of the week quiet to unsettled with the exception of a few short intervals of active geomagnetic conditions in the beginning of the week.
PROBA2 Observations (3 Apr 2023 - 9 Apr 2023)
Solar Activity
Solar flare activity fluctuated from low to moderate during the week.
In order to view the activity of this week in more detail, we suggest to go to the following website from which all the daily (normal and difference) movies can be accessed: https://proba2.oma.be/ssa
This page also lists the recorded flaring events.
A weekly overview movie (SWAP week 680) can be found here: https://proba2.sidc.be/swap/data/mpg/movies/weekly_movies/weekly_movie_2023_04_03.mp4.
Details about some of this week's events can be found further below.
If any of the linked movies are unavailable they can be found in the P2SC movie repository here: https://proba2.oma.be/swap/data/mpg/movies/.
Thursday April 06
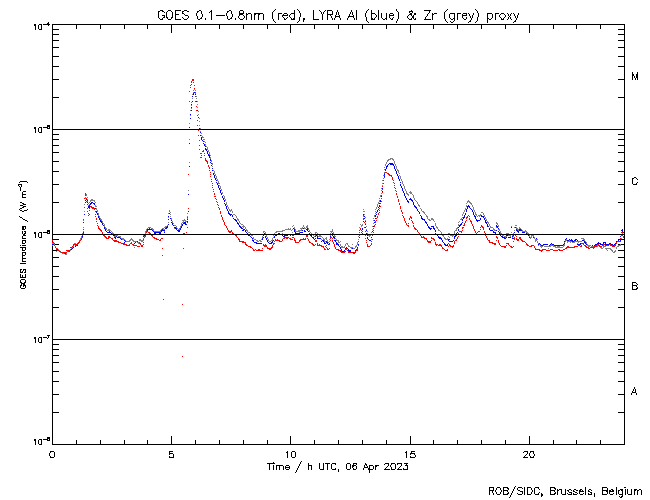
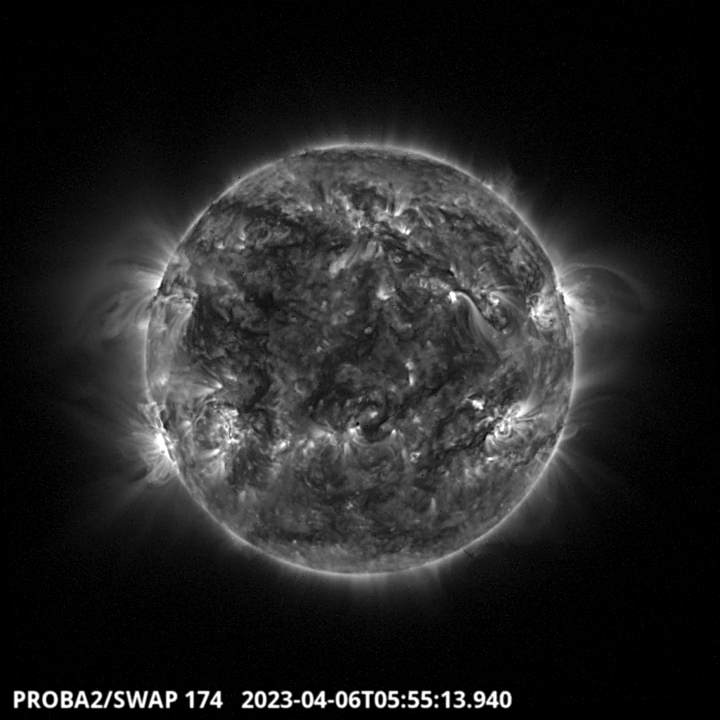
The largest flare of the week, an M3.0, was observed by LYRA (top panel) and SWAP (bottom panel). The flare occurred on 2023-Apr-06 (peak at 05:53 UT) at the south-eastern limb of the Sun, and it was associated with NOAA AR3272.
Find a SWAP movie of the event here: https://proba2.sidc.be/swap/movies/20230406_swap_movie.mp4.
International Sunspot Number by SILSO
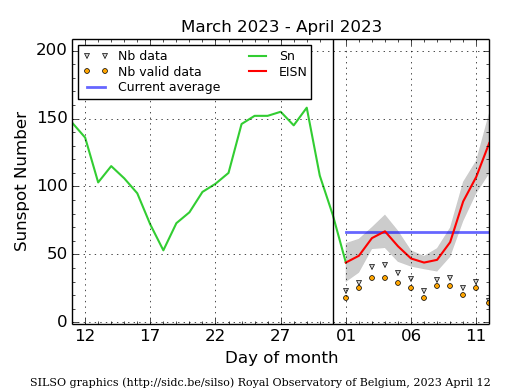
The daily Estimated International Sunspot Number (EISN, red curve with shaded error) derived by a simplified method from real-time data from the worldwide SILSO network. It extends the official Sunspot Number from the full processing of the preceding month (green line), a few days more than one solar rotation. The horizontal blue line shows the current monthly average. The yellow dots give the number of stations that provided valid data. Valid data are used to calculate the EISN. The triangle gives the number of stations providing data. When a triangle and a yellow dot coincide, it means that all the data is used to calculate the EISN of that day.
Noticeable Solar Events
| DAY | BEGIN | MAX | END | LOC | XRAY | OP | 10CM | TYPE | Cat | NOAA |
| 06 | 0536 | 0553 | 0604 | M3.0 | 100 | 3272 | ||||
| 08 | 0138 | 0146 | 0150 | S21E57 | M2.9 | 1N | 50 | 3272 |
| LOC: approximate heliographic location | TYPE: radio burst type |
| XRAY: X-ray flare class | Cat: Catania sunspot group number |
| OP: optical flare class | NOAA: NOAA active region number |
| 10CM: peak 10 cm radio flux |
Geomagnetic Observations in Belgium

Local K-type magnetic activity index for Belgium based on data from Dourbes (DOU) and Manhay (MAB). Comparing the data from both measurement stations allows to reliably remove outliers from the magnetic data. At the same time the operational service availability is improved: whenever data from one observatory is not available, the single-station index obtained from the other can be used as a fallback system.
Both the two-station index and the single station indices are available here: http://ionosphere.meteo.be/geomagnetism/K_BEL/
Things to do
Check out our activity calendar: activities and encounters with the Sun-Space-Earth system and Space Weather as the main theme. We provide occasions to get submerged in our world through educational, informative and instructive activities.
If you want your event in our calendar, contact us: stce_coordination at stce.be
* April 21, BIRA-IASB seminar: High resolution modelling of atmospheric composition over Antwerp, Belgium, Nicolet@spacepole and Teams, Brussels, Belgium
* April 28, STCE seminar: Space Weather Tools in Support of Space Radiation Operations, Nicolet@spacepole and Teams, Brussels, Belgium
* May 22-24, STCE Space Weather Introductory Course, Brussels, Belgium - FULL
* May 25, STCE seminar: Comparative study of a constant-alpha force-free field and its approximations in an ideal toroid, Meridian room@spacepole and zoom, Brussels, Belgium
* May 25, RMI Seminar: Towards a new hydrometeors identification tool at the RMI, conference room of the RMI, Brussels, Belgium
* May 29 - June 1, PITHIA-NRF Training School, Rome, Italy
Check: https://www.stce.be/calendar