- Table of Content
- 1.The storm seas...
- 2.X-class flare ...
- 3.Review of sola...
- 4.PROBA2 Observa...
- 5.International ...
- 6.Noticeable Sol...
- 7.Geomagnetic Ob...
- 8.The SIDC Space...
- 9.Review of Iono...
- 10.Activities at ...
2. X-class flare in large sunspot group
3. Review of solar and geomagnetic activity
4. PROBA2 Observations (26 Jun 2023 - 2 Jul 2023)
5. International Sunspot Number by SILSO
6. Noticeable Solar Events
7. Geomagnetic Observations in Belgium
8. The SIDC Space Weather Briefing
9. Review of Ionospheric Activity
10. Activities at the STCE
The storm season has started - do we have to worry?
It has been from 2002 since so many sunspots have been seen on the sun in a single month. It shows that the sun is becoming more active and the "storm season" on the sun is in full swing. It raises the concern on a very severe solar storm, where satellites and even power plants could fail. Should we be worried?
We got this question from a journalist.
Space weather impacts
On Sunday, a very powerful solar flare erupted on the sun. It caused radio communication failures for 20 minutes (see the STCE news item https://www.stce.be/news/653/welcome.html), including in the western United States. Fortunately, the eruption was relatively short, so the consequences on Earth were limited. But it could have been worse.
Similar to weather on Earth, there is also weather in space. Space weather is determined by the sun and how active it is. During periods of high solar activity, there are many storms and eruptions on the sun. Solar flares, electrically charged particles and a wind of solar material can then disturb our magnetosphere and atmosphere.
We can sometimes see this as auroras. But when huge amounts of fast and energetic solar material reach us, communication and navigation satellites and even power plants can also fail and be damaged.
Solar maximum
On average every 11 years, the sun's activity peaks. Right now, we are clearly heading toward a so-called solar maximum. Scientists predict the peak will be in 2024 or 2025. But according to some researchers, there are indications that the sun is more active than expected and that we will reach the peak sooner.
One such clue is the number of sunspots. These are dark spots on the sun's surface with strong magnetic fields. They appear dark because the temperature is lower compared to its surrounding. The number of sunspots is a measure of the sun's activity. The more sunspots, the more active the sun is.
More sunspots were observed in June than during previous months. The monthly mean total sunspot number in June 2023 was 163 (Check https://www.sidc.be/SILSO/datafiles). It was from 2002 that so many were once seen in a single month. Still, it is not that exceptional.
Our response
You can compare it to the seasons on Earth, only on the sun there are only 2 seasons and they last plus/minus 5.5 years each. But just like on Earth, one summer is not the other. And some summers are a warmer than others.
Right now we are moving toward the high season, where there is a lot of solar activity, so it makes sense that we see more sunspots. If you compare with the previous solar cycle, which peaked in 2014, 2015 and was a rather low cycle, now we are indeed at a higher peak. But what we are seeing now is still within our expectation.
But it is true that in the high season there is more chance of disturbed space weather, with more chance of solar storms. And therefore more chance of a major solar storm. But if and when that would occur is unpredictable. An extremely powerful solar storm is estimated to happen once every 100 to 150 years. The most severe solar storm measured to date occurred in 1859. 164 years ago. So the likelihood of another severe solar storm does increase.
But even an ordinary powerful solar storm can already affect navigation and telecommunication. The impact of space weather is much greater today than it was 100 years ago, because we have now become much more dependent on technology that can be affected by it.
So we keep a close eye on space weather and warn if necessary.
The original online article: https://www.vrt.be/vrtnws/nl/2023/07/04/de-zonneactiviteit-piekt/ (Dutch)
X-class flare in large sunspot group
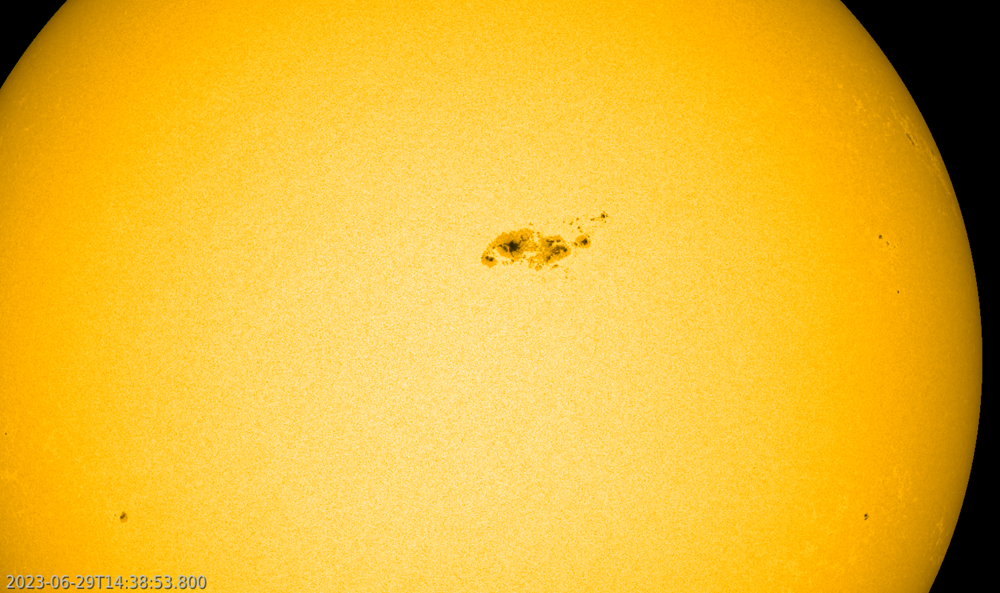
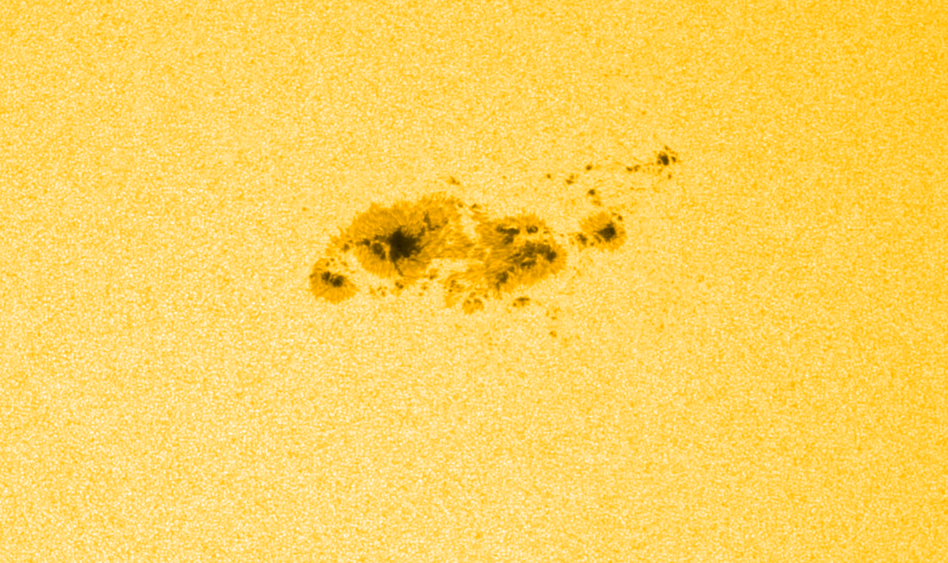
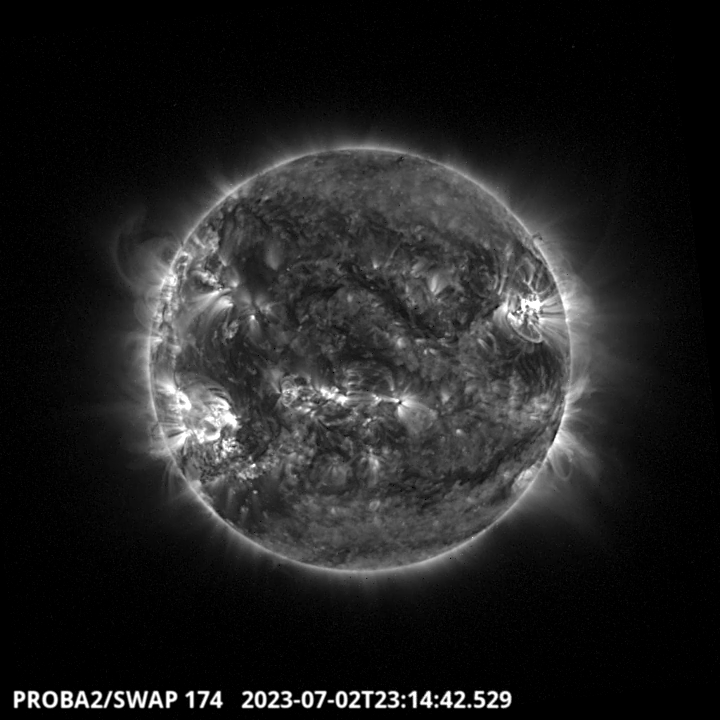
From 26 June onwards, a sunspot region quickly developed to become one of the largest sunspot groups of the current solar cycle (SC25) so far. Though still visible on disk, NOAA 13354 is already the second largest region after NOAA 13014 (https://www.stce.be/news/592/welcome.html ; May 2022), and before NOAA 12786 (November 2020) and NOAA 13153 (November 2022). Using eclipse glasses, NOAA 13354 was also an easy naked eye object. The SDO/HMI (http://sdo.gsfc.nasa.gov/data/aiahmi/ ) imagery underneath shows the evolution of NOAA 13354 during last week, as well as a zoom on the region. Clips are available in the online version of this STCE newsitem at https://www.stce.be/news/653/welcome.html
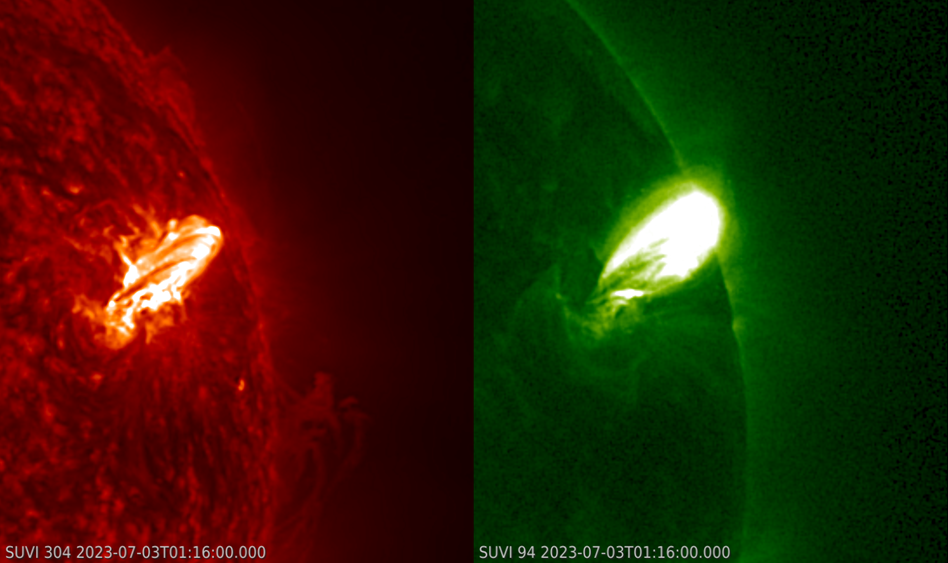
Despite its size and complexity, NOAA 13354 was initially a relatively quiet region in terms of flare production with just a single M-class flare ("moderate"; 29 June) until 30 June. Then, from 1 July onwards, the region started to grow even further in size and finally created some significant magnetic delta structures (see the STCE SWx classification page at https://www.stce.be/educational/classification#wilson ). This resulted in a long duration X1 flare peaking at 23:14UTC on 3 July (GOES - https://www.swpc.noaa.gov/products/goes-x-ray-flux). There seems to have been no direct triggering from interaction with preceding eruptive prominence activity, staying well to the northwest of the leading spot and relatively far from the coronal loops overarching NOAA 13354. A space weather advisory warning for Shortwave Fadeout (High Frequency communication or HFCom) was sent to the Civil Aviation (ICAO; PECASUS - https://pecasus.eu/ ). HFCom was affected mainly over the Pacific Ocean, Alaska and northeast Siberia (D-RAP ; https://www.swpc.noaa.gov/products/d-region-absorption-predictions-d-rap ). Radio bursts were observed at 2.8, 5.0 and 8.8 GHz (SWPC ; https://www.swpc.noaa.gov/products/solar-and-geophysical-event-reports ). The GOES/SUVI (https://www.swpc.noaa.gov/products/goes-solar-ultraviolet-imager-suvi ) extreme ultraviolet images underneath show the flare about 2 hours after its peak in soft-x-rays, on the left at temperatures around 80.000 degrees (SUVI 304) and on the right at temperatures of several millions degrees (SUVI 094). No obvious coronal mass ejection seems to have been associated with this eruption. Another X-class flare from this sunspot region remains possible over the next 2 to 3 days, i.e. until 5-6 July when the region is sufficiently behind the Sun's northwestern limb.
Meanwhile, SILSO -the World Data Center for the production, preservation and dissemination of the international sunspot number- (https://www.sidc.be/SILSO/home ) has issued its most recent report with the monthly Provisional International Sunspot Numbers (ISN). With a (provisional!) value of 163.4, June 2023 is now the month with the highest monthly ISN so far this solar cycle. In fact, we have to go back all the way to September 2002 to find a higher monthly sunspot number (187.9). That is more than 20 years ago! A similar story for the daily sunspot number where, on 22 June, the daily sunspot number (provisional!) reached 240. We have to go back to the famous Halloween events in 2003 to find higher values, when 250 was reached on 29 and 30 October. These values confirm that SC25 is shaping up to become stronger than the previous solar cycle 24 - See the STCE SC25 Tracking page at https://www.stce.be/content/sc25-tracking . Note that these daily sunspot numbers are still well below the all-time highs recorded in August 1870 (528 on 26 August) and December 1957 (503 on 24 December).
Review of solar and geomagnetic activity
Solar Active Regions (ARs) and flares
The Sun was active and released several C-class flares, M-class flares and one X-class flare. The M-class flares were produced by NOAA Active Region AR-3340, NOAA Active Region AR-3354 and NOAA Active Region AR-3359. The X1 flare was produced on July 02 at 23:14 UTC by the NOAA Active Region AR-3354.
Coronal mass ejections
No clear Earth-directed Coronal Mass Ejections (CME) were observed in the SOHO/LASCO coronograph images over the past week. A solar coronal dimming was observed on June 27 starting at around 01:00 UTC and ending around 01:45 UTC. This coronal dimming was located on the disc centre close to the Sunspot region NOAA AR 3349. This type of coronal events are usually associated with the initiation of a coronal mass ejection. However no clear CME was observed following this event.
Coronal Holes
A small equatorial coronal hole (negative polarity) has transited the central meridian on July 01.
Proton flux levels
The greater than 10 MeV proton flux was at background levels over the past 24 hours and is expected to remain so for the next 24 hours.
Electron fluxes at GEO
The greater than 2 MeV electron flux was above the 1000 pfu threshold for some periods and the 24-hour electron fluence was at normal to moderate levels for the past 24 hours and it is expected to remain at these levels for the next 24 hours.
Solar wind at L1
The solar wind was mildly enhanced due to a high-speed stream emanating from a coronal hole (negative polarity) that crossed the solar meridian on Jun 24. The wind speed ranged between 400 km/s to 550 km/h. The total interplanetary magnetic field (Bt) increased up to the 8.1 nT on June 30. The southward component (Bz) was fluctuating between -5.4 nT and 4.2 nT.
Geomagnetism
Geomagnetic conditions were quiet to unsettled (NOAA Kp 4 and K_BEL less than 4).
PROBA2 Observations (26 Jun 2023 - 2 Jul 2023)
Solar Activity
Solar flare activity fluctuated from low to high during the week.
In order to view the activity of this week in more detail, we suggest to go to the following website from which all the daily (normal and difference) movies can be accessed: https://proba2.oma.be/ssa
This page also lists the recorded flaring events.
A weekly overview movie (SWAP week 692) can be found here: https://proba2.sidc.be/swap/data/mpg/movies/weekly_movies/weekly_movie_2023_06_26.mp4.
Details about some of this week's events can be found further below.
If any of the linked movies are unavailable they can be found in the P2SC movie repository here: https://proba2.oma.be/swap/data/mpg/movies/.
Sunday July 02
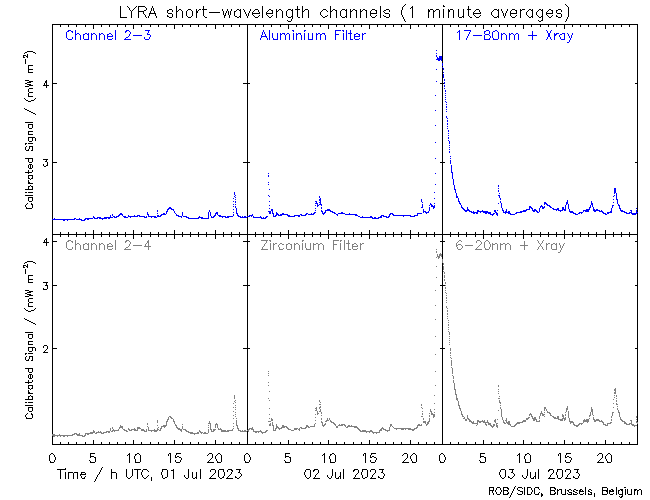
The largest flare of the week, an X1.0, was observed by LYRA (top panel) and SWAP (bottom panel). The flare peaked on 2023-Jul-02 at 23:14 UT, but continued on 2023-Jul-03. It occurred in the north-western hemisphere, and it originated from NOAA AR3354. Surprisingly enough, it was not associated with any strong CME or outflows.
Find a SWAP movie of the event here: https://proba2.sidc.be/swap/movies/20230702_swap_movie.mp4.
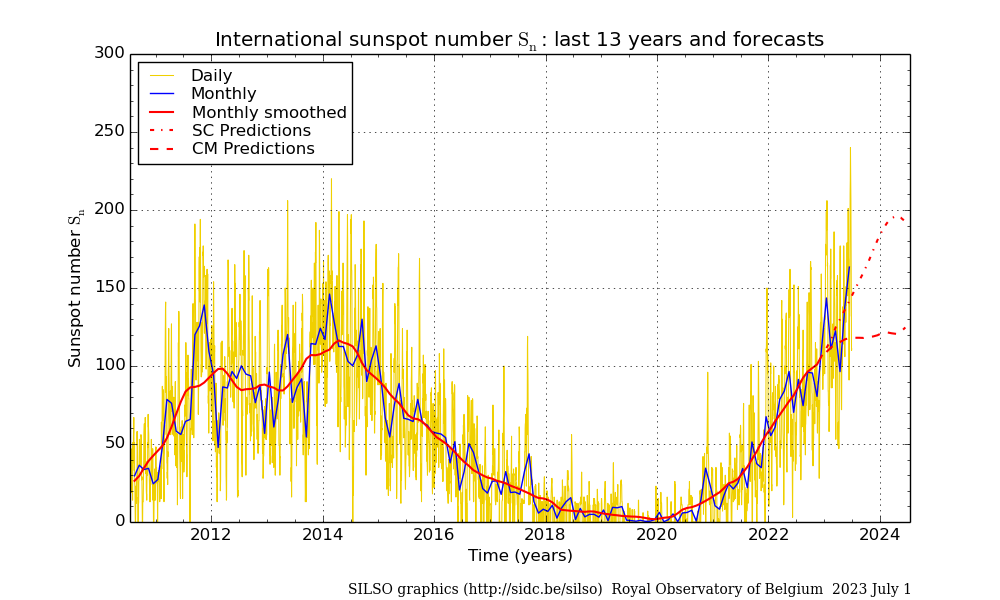
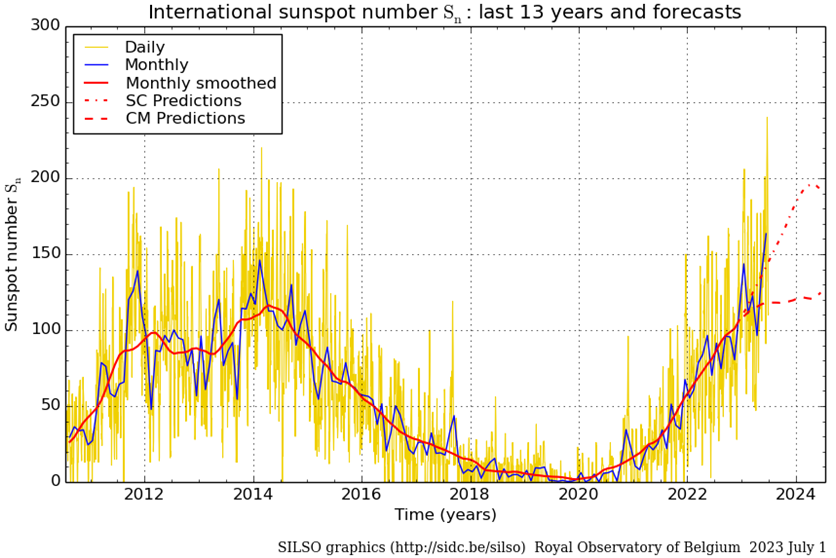
International Sunspot Number by SILSO

The daily Estimated International Sunspot Number (EISN, red curve with shaded error) derived by a simplified method from real-time data from the worldwide SILSO network. It extends the official Sunspot Number from the full processing of the preceding month (green line), a few days more than one solar rotation. The horizontal blue line shows the current monthly average. The yellow dots give the number of stations that provided valid data. Valid data are used to calculate the EISN. The triangle gives the number of stations providing data. When a triangle and a yellow dot coincide, it means that all the data is used to calculate the EISN of that day.
Noticeable Solar Events
| DAY | BEGIN | MAX | END | LOC | XRAY | OP | 10CM | TYPE | Cat | NOAA |
| 26 | 1608 | 1622 | 1634 | N23W38 | M1.6 | 1N | 38 | 3340 | ||
| 27 | 1457 | 1514 | 1519 | N14E17 | M1.2 | SF | 38 | 3340 | ||
| 28 | 0826 | 0844 | 0859 | N20W62 | M1.9 | 2N | 38 | 3340 | ||
| 29 | 1400 | 1415 | 1423 | N17W14 | M3.8 | 2B | V/2 | 53 | 3354 | |
| 29 | 1400 | 1415 | 1423 | M3.8 | V/2 | |||||
| 01 | 2207 | 2223 | 2231 | S20E55 | M1.1 | SN | III/1 | 3359 | ||
| 02 | 0229 | 0235 | 0240 | M2.0 | III/2II/3 | 3359 | ||||
| 02 | 2254 | 2314 | 2358 | X1.0 | 200 | III/1 | 53 | 3354 |
| LOC: approximate heliographic location | TYPE: radio burst type |
| XRAY: X-ray flare class | Cat: Catania sunspot group number |
| OP: optical flare class | NOAA: NOAA active region number |
| 10CM: peak 10 cm radio flux |
Geomagnetic Observations in Belgium

Local K-type magnetic activity index for Belgium based on data from Dourbes (DOU) and Manhay (MAB). Comparing the data from both measurement stations allows to reliably remove outliers from the magnetic data. At the same time the operational service availability is improved: whenever data from one observatory is not available, the single-station index obtained from the other can be used as a fallback system.
Both the two-station index and the single station indices are available here: http://ionosphere.meteo.be/geomagnetism/K_BEL/
The SIDC Space Weather Briefing
The Space Weather Briefing presented by the forecaster on duty from June 25 to July 02. It reflects in images and graphs what is written in the Solar and Geomagnetic Activity report: https://www.stce.be/briefings/20230703_SWbriefing.pdf
If you need to access the movies, contact us: stce_coordination at stce.be
Review of Ionospheric Activity

The figure shows the time evolution of the Vertical Total Electron Content (VTEC) (in red) during the last week at three locations:
a) in the northern part of Europe(N 61deg E 5deg)
b) above Brussels(N 50.5deg, E 4.5 deg)
c) in the southern part of Europe(N 36 deg, E 5deg)
This figure also shows (in grey) the normal ionospheric behaviour expected based on the median VTEC from the 15 previous days.
The VTEC is expressed in TECu (with TECu=10^16 electrons per square meter) and is directly related to the signal propagation delay due to the ionosphere (in figure: delay on GPS L1 frequency).
The Sun's radiation ionizes the Earth's upper atmosphere, the ionosphere, located from about 60km to 1000km above the Earth's surface.The ionization process in the ionosphere produces ions and free electrons. These electrons perturb the propagation of the GNSS (Global Navigation Satellite System) signals by inducing a so-called ionospheric delay.
See http://stce.be/newsletter/GNSS_final.pdf for some more explanations ; for detailed information, see http://gnss.be/ionosphere_tutorial.php
Activities at the STCE
Check out our activity calendar: activities and encounters with the Sun-Space-Earth system and Space Weather as the main theme. We provide occasions to get submerged in our world through educational, informative and instructive activities.
If you want your event in our calendar, contact us: stce_coordination at stce.be
* Aug 21, Lecture: The Sun, VVS Summerschool, Leuven, Belgium
* Sept 9-10, Open Doors at the Humain Radioastronomy Station, Humain, Belgium
* Sep 18-20, STCE Space Weather Introductory Course, Brussels, Belgium - Registrations are open
* Sep 26, post-Space Weather Introductory Course, by JMG, date and place TBD - registration is included in the Sep SWIC
* Nov 18-19, e-SWAN Space Weather School: data, models and services, by the STCE, Toulouse, France
* Dec 4-6, STCE course: Space Weather impacts on ionospheric wave propagation - focus on GNSS and HF, Brussels, Belgium - Registrations are open
* Jan 22-24, 2024, STCE Space Weather Introductory Course, Brussels, Belgium - Registrations are open
* Jan 25, 2024, post-Space Weather Introductory Course, by JMG and MeteoWing, place TBD - registration is included in the Jan SWIC
Check: https://www.stce.be/calendar