- Table of Content
- 1.Consistent Com...
- 2.STEREO-A's inf...
- 3.Review of Spac...
- 4.International ...
- 5.PROBA2 Observa...
- 6.Noticeable Sol...
- 7.Geomagnetic Ob...
- 8.Review of Iono...
- 9.The SIDC Space...
- 10.STCE Activitie...
2. STEREO-A's inferior conjunction
3. Review of Space Weather
4. International Sunspot Number by SILSO
5. PROBA2 Observations
6. Noticeable Solar Events
7. Geomagnetic Observations in Belgium
8. Review of Ionospheric Activity
9. The SIDC Space Weather Briefing
10. STCE Activities
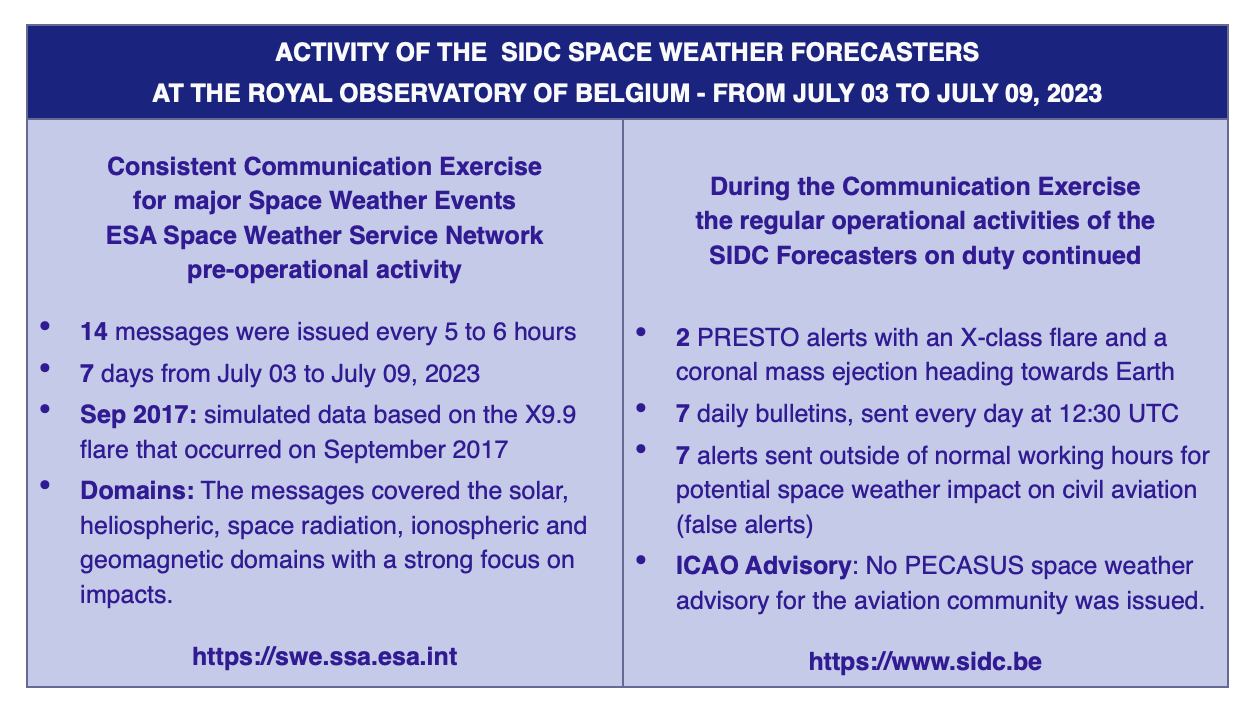
Consistent Communication in case of Extraordinary Space Weather Events
The SIDC Forecasters at the Royal Observatory of Belgium participated in a Consistent Communication Exercise for major Space Weather Events.
The exercise took place from July 3 to 9, 2023, as part of ESA's Space Weather Service Network pre-operational activities. The SIDC forecasters took the role of forecasters at ESA’s SSA Space Weather Coordination Centre (SSCC), and collaborated with the other network experts to agree on a series of messages following a predefined protocol.
The protocol consisted of standard operating procedures that addressed several aspects: promptly gathering relevant experts, utilizing communication platforms and methods for efficient information exchange, achieving consensus and agreement on messages among experts, establishing procedures for regular updates, and determining and communicating the end of the event.
The primary objective of this real-time information service is to equip end-users with comprehensive knowledge to effectively manage potential risks associated with unexpected extreme space weather events.
The table below shows just how busy our forecasters were that week.
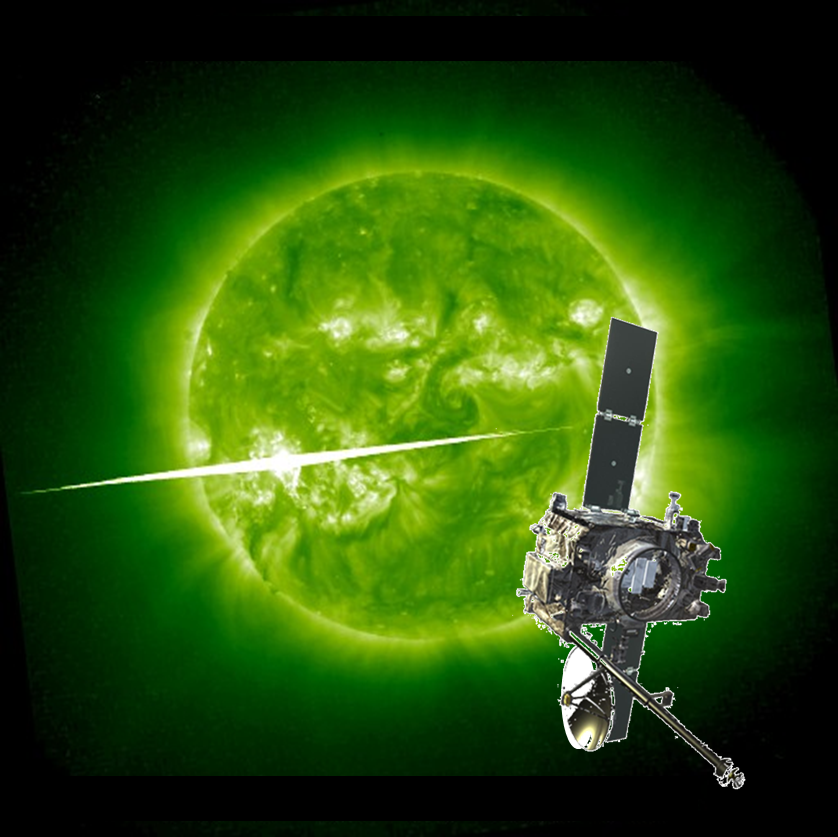
STEREO-A's inferior conjunction
Launched on 26 October 2006 (00:52 UTC), STEREO (Solar TErrestrial RElations Observatory - https://stereo-ssc.nascom.nasa.gov/ ) consisted of two nearly identical spacecraft: STEREO-A and STEREO-B. The spacecraft are at distances from the Sun resp. slightly inward and slightly outward than the Earth's, and thus one of them is moving ahead of Earth in its orbit (STEREO-A), while the other is trailing behind (STEREO-B). Since their launch in 2006, both spacecraft gradually moved away from Earth, separating from each other at a combined rate of approximately 44° per year. They achieved 90° separation on January 24, 2009, a condition known as quadrature. On February 6, 2011, the two spacecraft were exactly 180° apart from each other, allowing the entire Sun to be seen at once for the first time (see this NASA news item - https://www.nasa.gov/mission_pages/stereo/news/entire-sun.html ). The maps underneath show the positions of the STEREO-A ("A") and -B ("B") relative to the "fixed" positions of the Sun (yellow) and Earth (green) during some of the mentioned key moments.
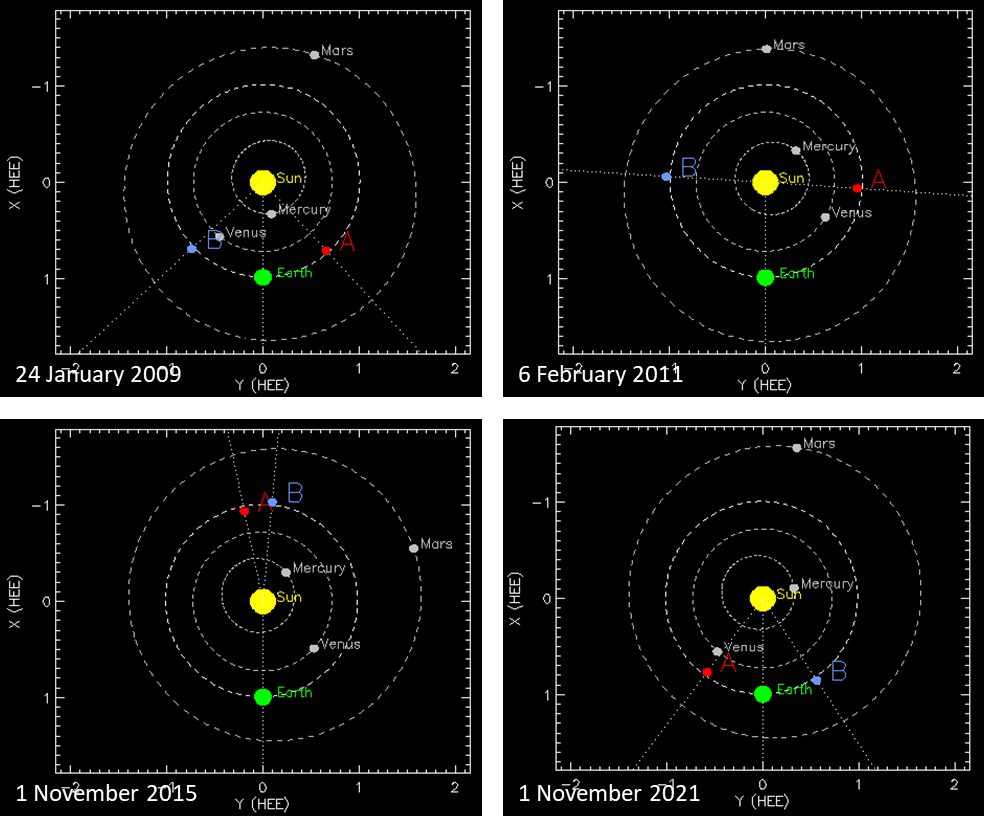
On October 1, 2014, contact was lost with STEREO-B during a planned reset to test the craft's automation, in anticipation of the solar "conjunction" period in 2015 (STCE newsitem at https://www.stce.be/news/253/welcome.html ). Telemetry revealed that the spacecraft was in an uncontrolled spin of about 3° per second, decreasing the amount of power that could be generated by the solar panels. Numerous attempts to re-establish permanent two-way communication between STEREO-B and Earth failed, and NASA ended the periodic recovery operations in 2018. Meanwhile, STEREO-A had passed its superior conjunction (i.e. on the opposite side of the Sun as seen from Earth) uneventfully, with no radio contact possible (and thus no data available) for several months from mid-March until mid-July 2015 (STCE newsitem at https://www.stce.be/news/315/welcome.html ). The angular distance between the two spacecraft and Earth was decreasing again, however with STEREO-A now trailing the Earth and the non-functioning STEREO-B preceding the Earth. To avoid confusion, the names were kept the same.
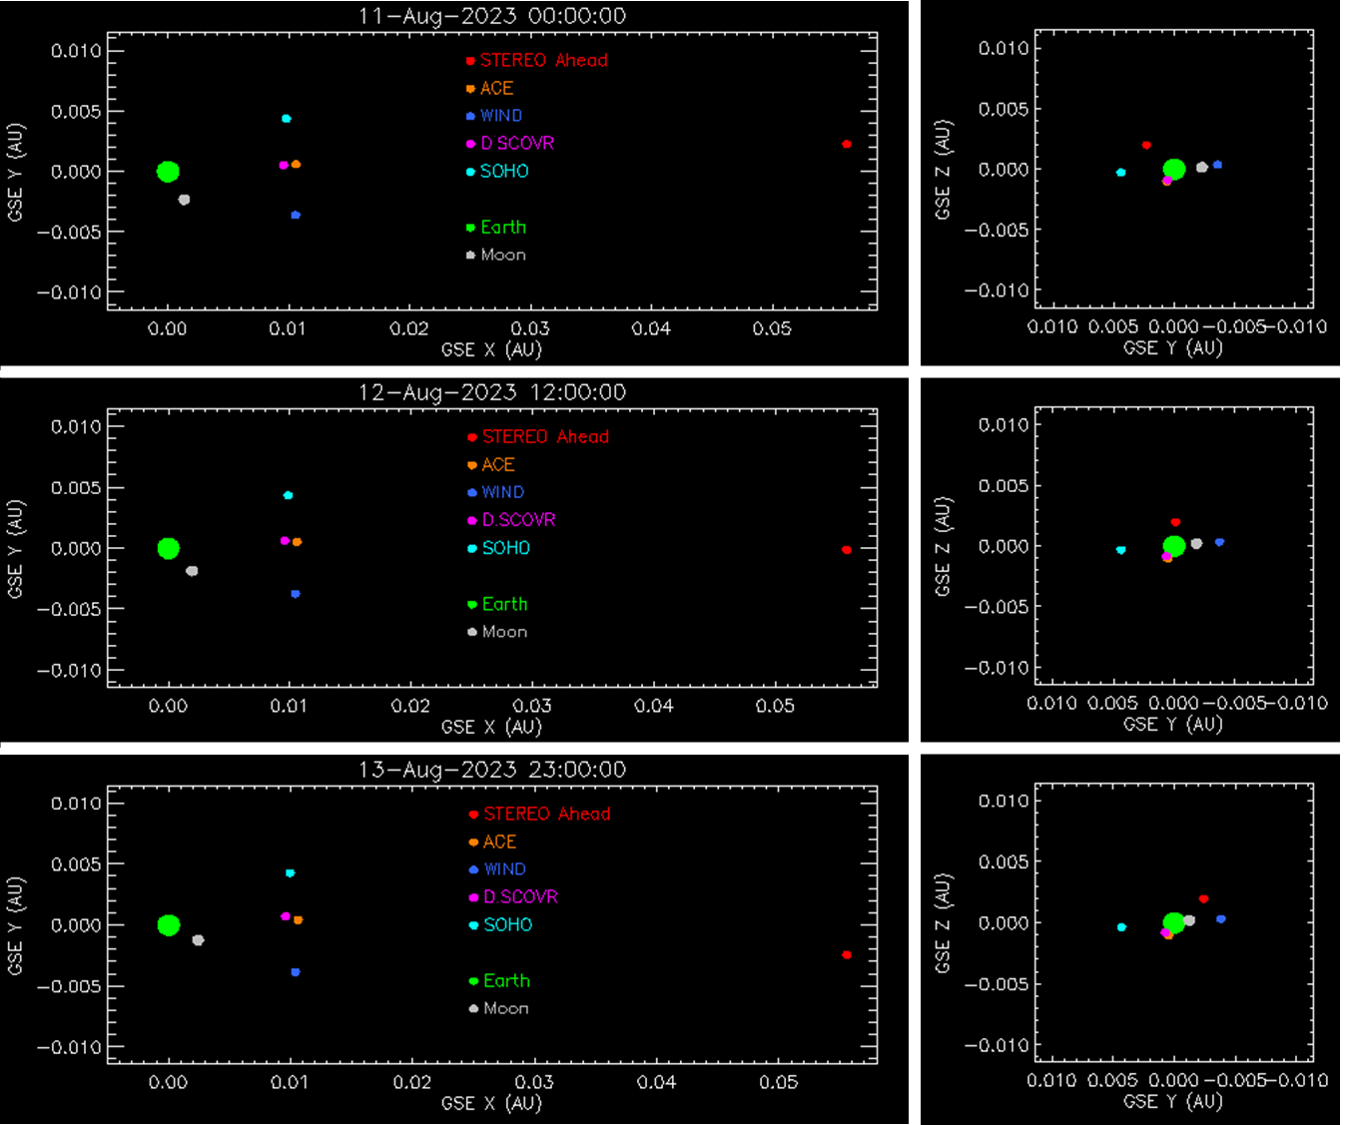
Celestial mechanics dictates that the spacecraft must return to near-Earth, and so this will be the case for STEREO-A in August this year. The STEREO-team has put a webpage online where the event can be tracked (https://stereo-ssc.nascom.nasa.gov/cgi-bin/make_ic_gif ). On 12 August, the spacecraft will pass between the Earth and the Sun, in what is called an inferior conjunction. Closest distance to Earth will be just over 8.3 million km, far enough from the 1st Lagrangian point ("L1"), home of SOHO, ACE, DSCOVR and Wind, to safely pass. The graphs above show the position of the Earth, Moon (grey), STEREO-A and the 4 satellites at L1 on 11-12-13 August, as seen from above looking down on the ecliptic (the plane described by the Earth during its orbit around the Sun) with the Sun to the right (not shown). The 3 smaller graphs to the right show the positions of the same bodies for the same timings, but now seen in the plane of the ecliptic from behind the Earth (green) in the direction of the Sun. Distances are in Astronomical Units (1 AU is about 150 million km). After 12 August, STEREO-A will embark on another pass around the Sun's farside, again preceding the Earth during the next few years.
Credits: NASA/Goddard Space Flight Center/SwRI/STEREO
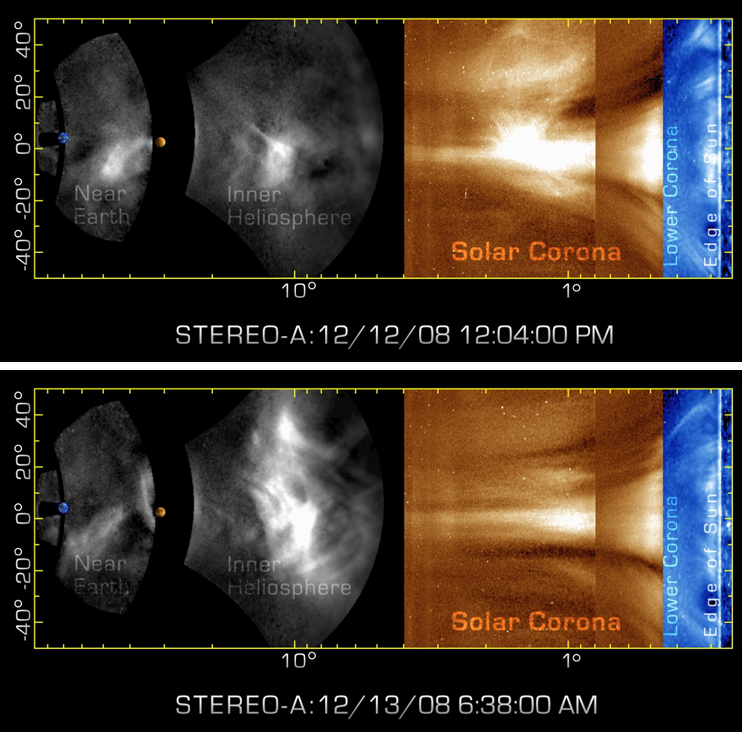
Over the years, STEREO has proven itself invaluable in solar science allowing an in-depth understanding of the 3D shape of coronal mass ejections (CMEs) and their propagation throughout the solar system. It also has instruments to measure the solar wind parameters, solar energetic particles, and to record solar radio bursts. This allows anticipation on solar wind structures, or cross-checking with near-earth or earth-based observations. Its EUV telescope (EUVI), coronographs (COR1 and COR2), and heliospheric imagers (HI 1 and HI 2) allow the observation of the sources of solar eruptions and also offer space weather forecasters a formidable tool in distinguishing the direction a CME is headed (see e.g. this STCE newsitem at https://www.stce.be/news/581/welcome.html ). In particular, provided sufficient separation with the Earth, when a halo CME is observed from Earth (in casu SOHO), the coronagraphic images from the STEREO spacecraft unambiguously establish the origin of the CME, i.e. either from the Sun's Earth-facing side, or from the Sun's farside. In the first case, the CME can impact Earth's magnetic field, in the other case the earth environment will not be affected. The imagery above (NASA/STEREO webpage - https://svs.gsfc.nasa.gov/10809 ) reveals the detailed features in a large geoeffective CME in December 2008, connecting the original magnetized structure in the Sun's corona all the way to its impact on the earth environment three days later (density measurements by the WIND spacecraft). At the time the data were collected, in late 2008, STEREO-A was nearly 45 degrees ahead of the Earth in its orbit, affording a very clear view of the Earth-Sun line. Further newsitems can be found on STEREO's newspage (https://stereo.gsfc.nasa.gov/news/news.shtml ), and a retrospective on 10 years STEREO mission is at https://stereo.gsfc.nasa.gov/10year/
Review of Space Weather
Solar Active Regions and flares
The solar flaring activity over the past week was mostly at moderate levels with almost daily isolated low M-class flaring. There have been more than twenty active regions on the visible solar disc and 20 M-class flares were recorded. The most complex, largest and most active regions (AR) throughout the week were NOAA AR 3363 and NOAA AR 3372, which developed into a beta-gamma-delta magnetic configuration and produced multiple M-class flaring as well as background low levels of activity. Another notable active region in the first half of the week was NOAA AR 3361 (beta-gamma-delta), which also produced some isolated M-class flaring, together with several sunspot groups near NOAA AR 3366 (beta). The strongest activity throughout the week was an impulsive M6.9 flare, start time 08:49 UTC, peak time 08:55 UTC, end time 09:10 UTC, produced by NOAA AR 3372 on July 12th. Several other high M-class flares were produced by the same region.
Coronal mass ejections
The solar surface was streaked by filaments and multiple eruptions were observed throughout the week. More notable filament eruptions were detected near NOAA AR 3363 (beta) with an associated southward partial halo coronal mass ejection (CME) first visible in the LASCO/C2 coronagraph imagery at 19:24 UTC on July 11th.
The CME was expected to arrive to Earth on July 15th. Another partial halo CME was detected in the coronagraph imagery at 19:10 UTC on July 14th following an on-disc filament eruption and a C8.8 flare from plage region NOAA AR 3370. The CME was expected to have an Earth-directed component with possible arrival on July 18th, but due to multiple overlapping partial halo CMEs at the time the CME properties were difficult to determine, leaving greater uncertainties for the predicted arrival time. Several strong back-sided halo CMEs were observed from behind the west limb, one of which caused a proton radiation storm in the UTC morning of July 16th. Multiple other partial halo CMEs were observed throughout the week, two of which were related to on-disc flaring activity and were expected to have an Earth-directed component with possible arrival times on July 12th and July 18th. The above mentioned CMEs were, namely, a partial halo CME related to an M2.4 flare with peak time 03:55 UTC on July 10th from near NOAA AR 3366, and a partial halo CME, first observed at 20:06 UTC on July 15th, related to a C8.8 flare from NOAA AR 3363.
Coronal Holes
A small negative polarity coronal hole crossed the central meridian on July 10th and a related high speed stream was expected to reach Earth in the period between July 13th and July 15th. Another small positive polarity coronal hole crossed the central meridian on July 15th. The coronal hole was deemed too small to produce significant impact at Earth and possible solar wind enhancements from July 18th onwards were expected to be mixed with the anticipated interplanetary CME (ICME) arrivals.
Proton flux levels
Regarding energetic solar particles, the week started below radiation storm levels, but with slightly elevated levels of the greater than 10 MeV proton flux as a result of partial halo CME activity on July 10th. The enhancements gradually declined throughout July 11th. Nominal conditions remained until July 16th, when moderate radiation storm levels were reached following the on-disc partial halo CME from July 15th and a back-sided full halo CME with related type IV radio emission around 04:00 UTC on July 16th.
Electron fluxes at GEO
The greater than 2 MeV electron flux was mostly below the 1000 pfu threshold throughout the entire week. The corresponding electron fluence was at nominal levels.
Solar wind
The solar wind parameters throughout the week exhibited signatures of several weak ICME arrivals. A weak glancing blow arrival in the UTC afternoon of July 12th could be related to the anticipated weak impact from the partial halo CME on July 10th. Another weak transient was visible in the solar wind parameters in the UTC afternoon of July 13th, before a more prominent ICME with a forward shock was detected in the solar wind data on July 14th, possibly related to the expected arrival of the July 11th partial halo CME. The solar wind shock was observed at 15:25 UTC on July 14th as the solar wind velocity increased from 386 km/s to 441 km/s and the interplanetary magnetic field jumped from 8 nT to 14 nT, increasing up to 18 nT later. The minimum Bz reached -12 nT. The solar wind density jumped from 9 ppc to 16 ppc and reached almost 36 ppc by the UTC evening of July 14th.
Despite the numerous ICME arrivals the solar wind velocity remained mostly in the slow solar wind regime with values exceeding 500 km/s on July 14th, but staying below 400 km/s throughout most of the week. The orientation of the interplanetary magnetic field was predominantly in the positive sector until July 14th (directed away from the Sun) and mostly in the negative sector (directed towards the Sun) since then. No clear signatures of anticipated high speed stream arrival were identified in the solar wind data in the period of July 13th to July 15th.
Geomagnetism
The geomagnetic conditions throughout the week were predominantly quiet to unsettled. Active conditions were globally measured following the last ICME arrival on July 14th and July 15th, with two isolated minor storm intervals observed locally over Belgium between 19:00 and 21:00 UTC on July 14th.
International Sunspot Number by SILSO
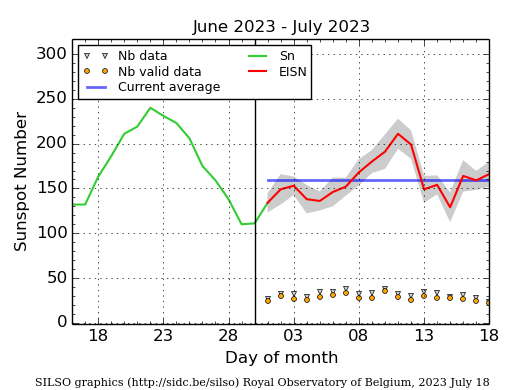
The daily Estimated International Sunspot Number (EISN, red curve with shaded error) derived by a simplified method from real-time data from the worldwide SILSO network. It extends the official Sunspot Number from the full processing of the preceding month (green line), a few days more than one solar rotation. The horizontal blue line shows the current monthly average. The yellow dots give the number of stations that provided valid data. Valid data are used to calculate the EISN. The triangle gives the number of stations providing data. When a triangle and a yellow dot coincide, it means that all the data is used to calculate the EISN of that day.
PROBA2 Observations
Solar Activity
Solar flare activity was at a moderate level during the week.
In order to view the activity of this week in more detail, we suggest to go to the following website from which all the daily (normal and difference) movies can be accessed: https://proba2.oma.be/ssa
This page also lists the recorded flaring events.
A weekly overview movie (SWAP week 694) can be found here: https://proba2.sidc.be/swap/data/mpg/movies/weekly_movies/weekly_movie_2023_07_10.mp4.
Details about some of this week's events can be found further below.
If any of the linked movies are unavailable they can be found in the P2SC movie repository here: https://proba2.oma.be/swap/data/mpg/movies/.
Wednesday July 12
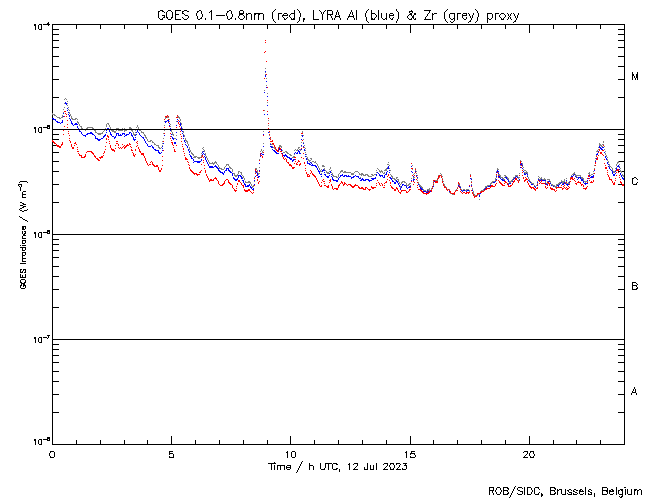
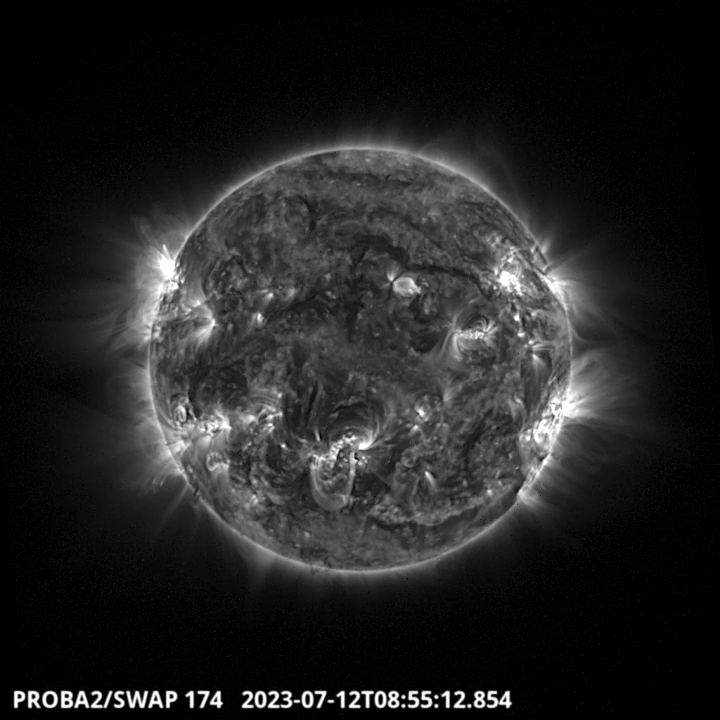
The largest flare of this very active week, an M6.9, was observed by LYRA (top panel) and SWAP (bottom panel). The flare peaked on 2023-Jul-12 at 08:55 UT. It occurred in the north-eastern hemisphere close to the solar limb, and it originated from NOAA AR3372.
Find a SWAP movie of the event here: https://proba2.sidc.be/swap/movies/20230712_swap_movie.mp4.
Noticeable Solar Events
| DAY | BEGIN | MAX | END | LOC | XRAY | OP | 10CM | TYPE | Cat | NOAA |
| 10 | 0329 | 0355 | 0412 | S13W49 | M2.3 | 2N | 23 | II/1 | 62 | 3366 |
| 10 | 2206 | 2218 | 2229 | S12W59 | M1.4 | 1N | 120 | 62 | 3366 | |
| 11 | 1419 | 1435 | 1445 | M2.0 | 3372 | |||||
| 11 | 1602 | 1612 | 1635 | M1.1 | 3372 | |||||
| 11 | 1751 | 1808 | 1816 | M6.8 | F | 71 | 3368 | |||
| 11 | 1920 | 1929 | 1939 | M1.0 | F | 3372 | ||||
| 11 | 2204 | 2215 | 2224 | M5.8 | 140 | |||||
| 11 | 2334 | 2337 | 2345 | M1.2 | 71 | 3368 | ||||
| 12 | 0021 | 0031 | 0040 | M1.4 | F | 62 | 3366 | |||
| 12 | 0431 | 0445 | 0458 | M1.3 | I/2 | 78 | 3372 | |||
| 12 | 0510 | 0514 | 0523 | M1.3 | 63 | 3361 | ||||
| 12 | 0849 | 0855 | 0900 | M6.9 | N | 78 | 3372 | |||
| 13 | 1855 | 1920 | 1936 | N24E57 | M2.1 | 1N | VI/2 | 78 | 3372 | |
| 14 | 0922 | 0936 | 0949 | S19W24 | M1.0 | SF | III/2CTM/1VI/2 | 69 | 3363 | |
| 15 | 0721 | 0741 | 0756 | S23W37 | M2.9 | 2B | 570 | III/3CTM/1 | 69 | 3363 |
| 15 | 0943 | 0953 | 0957 | N11E63 | M1.0 | SF | III/2 | 78 | 3372 | |
| 15 | 1005 | 1010 | 1014 | N23E42 | M2.2 | 1N | III/3II/2 | 78 | 3372 | |
| 16 | 0816 | 0826 | 0830 | M1.0 | III/3 | 78 | 3372 | |||
| 16 | 0816 | 0826 | 0830 | M1.0 | III/3 | |||||
| 16 | 1457 | 1508 | 1512 | N23E27 | M1.7 | 1B | 170 | V/2IV/2 | 78 | 3372 |
| 16 | 1736 | 1746 | 1859 | S23W58 | M4.0 | 2B | 130 | V/3III/3 | 69 | 3363 |
| LOC: approximate heliographic location | TYPE: radio burst type |
| XRAY: X-ray flare class | Cat: Catania sunspot group number |
| OP: optical flare class | NOAA: NOAA active region number |
| 10CM: peak 10 cm radio flux |
Geomagnetic Observations in Belgium

Local K-type magnetic activity index for Belgium based on data from Dourbes (DOU) and Manhay (MAB). Comparing the data from both measurement stations allows to reliably remove outliers from the magnetic data. At the same time the operational service availability is improved: whenever data from one observatory is not available, the single-station index obtained from the other can be used as a fallback system.
Both the two-station index and the single station indices are available here: http://ionosphere.meteo.be/geomagnetism/K_BEL/
Review of Ionospheric Activity
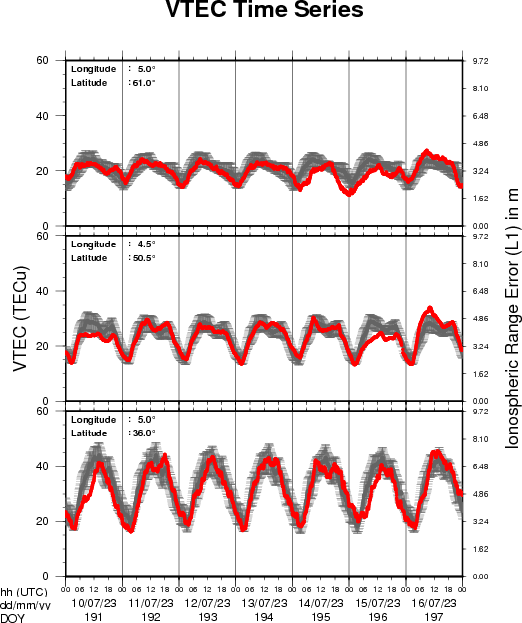
The figure shows the time evolution of the Vertical Total Electron Content (VTEC) (in red) during the last week at three locations:
a) in the northern part of Europe(N 61deg E 5deg)
b) above Brussels(N 50.5deg, E 4.5 deg)
c) in the southern part of Europe(N 36 deg, E 5deg)
This figure also shows (in grey) the normal ionospheric behaviour expected based on the median VTEC from the 15 previous days.
The VTEC is expressed in TECu (with TECu=10^16 electrons per square meter) and is directly related to the signal propagation delay due to the ionosphere (in figure: delay on GPS L1 frequency).
The Sun's radiation ionizes the Earth's upper atmosphere, the ionosphere, located from about 60km to 1000km above the Earth's surface.The ionization process in the ionosphere produces ions and free electrons. These electrons perturb the propagation of the GNSS (Global Navigation Satellite System) signals by inducing a so-called ionospheric delay.
See http://stce.be/newsletter/GNSS_final.pdf for some more explanations ; for detailed information, see http://gnss.be/ionosphere_tutorial.php
The SIDC Space Weather Briefing
The Space Weather Briefing presented by the forecaster on duty from 10 to 16 July. It reflects in images and graphs what is written in the Solar and Geomagnetic Activity report: https://www.stce.be/briefings/20230717_SWbriefing.pdf
If you need to access the movies, contact us: stce_coordination at stce.be
STCE Activities
Check out our activity calendar: activities and encounters with the Sun-Space-Earth system and Space Weather as the main theme. We provide occasions to get submerged in our world through educational, informative and instructive activities.
If you want your event in our calendar, contact us: stce_coordination at stce.be
* Aug 21, Lecture: The Sun, VVS Summerschool, Leuven, Belgium
* Sept 9-10, Open Doors at the Humain Radioastronomy Station, Humain, Belgium
* Sep 18-20, STCE Space Weather Introductory Course, Brussels, Belgium - Registrations are open
* Sep 26, post-Space Weather Introductory Course, by JMG, date and place TBD - registration is included in the Sep SWIC
* Nov 18-19, e-SWAN Space Weather School: data, models and services, by the STCE, Toulouse, France
* Dec 4-6, STCE course: Space Weather impacts on ionospheric wave propagation - focus on GNSS and HF, Brussels, Belgium - Registrations are open
* Jan 22-24, 2024, STCE Space Weather Introductory Course, Brussels, Belgium - Registrations are open
* Jan 25, 2024, post-Space Weather Introductory Course, by JMG and MeteoWing, place TBD - registration is included in the Jan SWIC
Check: https://www.stce.be/calendar