- Table of Content
- 1.Strong geomagn...
- 2.Review of sola...
- 3.International ...
- 4.PROBA2 Observa...
- 5.Noticeable Sol...
- 6.Geomagnetic Ob...
- 7.Review of Iono...
- 8.The SIDC Space...
- 9.Activities at ...
2. Review of solar and geomagnetic activity
3. International Sunspot Number by SILSO
4. PROBA2 Observations
5. Noticeable Solar Events
6. Geomagnetic Observations in Belgium
7. Review of Ionospheric Activity
8. The SIDC Space Weather Briefing
9. Activities at the STCE
Strong geomagnetic storms
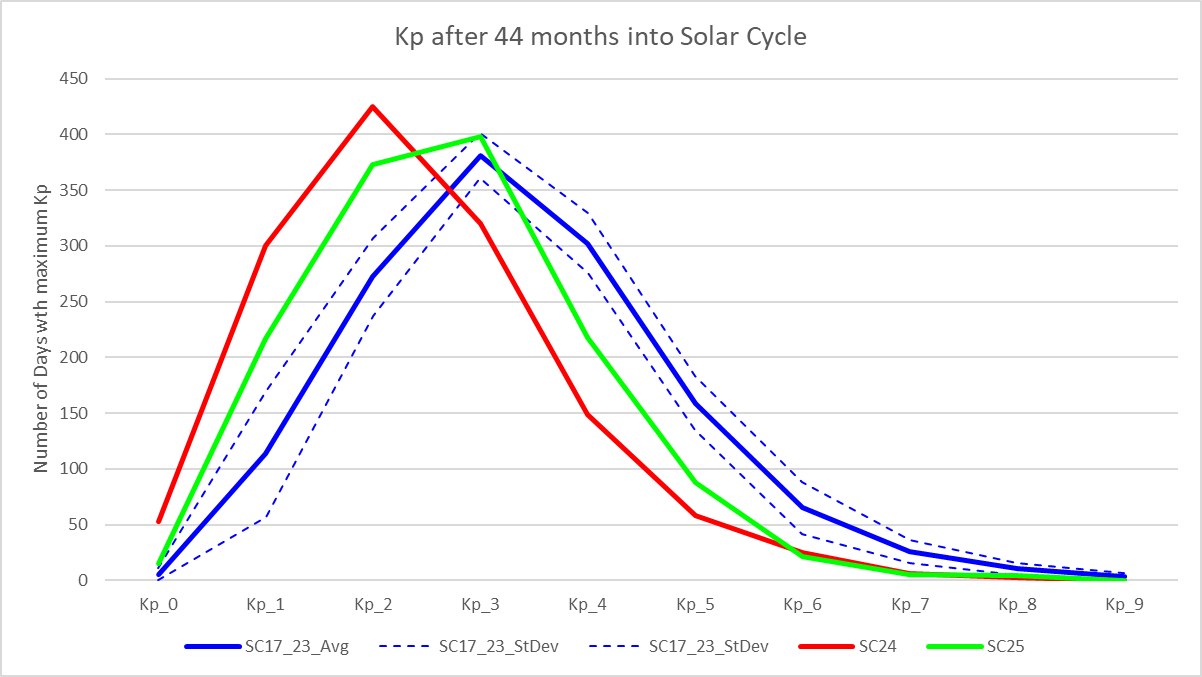
With another strong geomagnetic storm that has occurred just a week ago, one might wonder how unusual geomagnetic activity has been so far this solar cycle (SC25). To properly evaluate this, we can take a look at the most often used geomagnetic parameter, i.e. the Kp index. The Kp index ("planetarische Kennziffer") is a 3-hourly geomagnetic range index averaged from the *standardized* local K indices of 13 contributing subauroral geomagnetic observatories worldwide (list at http://isgi.unistra.fr/listobs_index.php?index=Kp ). It was introduced by Bartels in 1949 (The standardized index Ks and the planetary index Kp, IATME Bulletin 12b, 97), and extended further back in time to 1932. The final 3-hourly and daily Kp indices are compiled by GFZ Potsdam (https://www.gfz-potsdam.de/en/kp-index/ ) and expressed in thirds, from 0o, 0+, 1-, ... to 9-, 9o. The scale has an upper-boundary, i.e. no matter how large the geomagnetic variation is, Kp will never exceed 9o. The values are archived at the World Data Center for Geomagnetism at Kyoto (WDC Kyoto, http://wdc.kugi.kyoto-u.ac.jp/wdc/Sec3.html ).
From October 1933, the onset of solar cycle 17, to the last full month of data (August 2023), the maximum 3-hourly Kp index was determined for each day from the WDC Kyoto data. As SC25 was 44 months "old" last August, the days were then summed and binned per Kp value (0o, 0+, 1-, ... to 9-, 9o) and this for the first 44 months of each solar cycle. Then, these totals were combined to integer Kp values, e.g. Kp = 0 is the sum of the values for Kp = 0o and Kp = 0+. For SC17 to SC23, these values were then averaged and a standard deviation calculated. These are respectively the thick and dashed blue lines in the graph underneath. The values for the previous SC24 (in red) and ongoing SC25 (in green) are shown separately. It now becomes clear how weak the previous solar cycle was in terms of geomagnetic activity, with a peak at Kp = 3 instead of the long-term average peak near Kp = 4. SC25 is geomagnetically stronger than SC24, with the peak now back at Kp = 4. It is nonetheless clear that there's still an abundance of weak geomagnetic days (Kp = 1, 2 or 3) compared to the long-term average, as the green line is well above the long-term average, even including the standard deviations. It is an underachiever when it comes to active conditions (Kp = 4) and geomagnetic storming (Kp values of 5 and higher), as the green line is well below the long-term average (blue). For moderate to extremely severe geomagnetic storming, SC24 and SC25 are almost each other's twin. The general conclusion is that SC25 has been geomagnetically stronger than SC24 so far, but is still well below the average geomagnetic activity produced during SC17-23.
That being said, let's take a look at the intensity of the geomagnetic storms, as the maximum Kp has an upper-boundary of 9o. For this, we can use the Disturbance storm-time index Dst (Sugiura, 1964 - http://isgi.unistra.fr/indices_dst.php ). This geomagnetic parameter is designed to measure the magnetic signature of magnetospheric currents, in particular -but not restricted to- the ring current. Dst is computed using 1-hour values of the horizontal H-component by four low latitude observatories (list at http://isgi.unistra.fr/listobs_index.php?index=Dst ) sufficiently distant from the auroral and equatorial electrojets to inhibit noise from these two sources. The values are expressed in nT and mostly negative in case of a strong geomagnetic disturbance, as the enhanced ring current tends to counteract (weaken) the Earth's magnetic field. The Dst index is available from 1957 onwards and is derived and maintained by the World Data Center for Geomagnetism at Kyoto, Japan (WDC Kyoto - https://wdc.kugi.kyoto-u.ac.jp/ ).
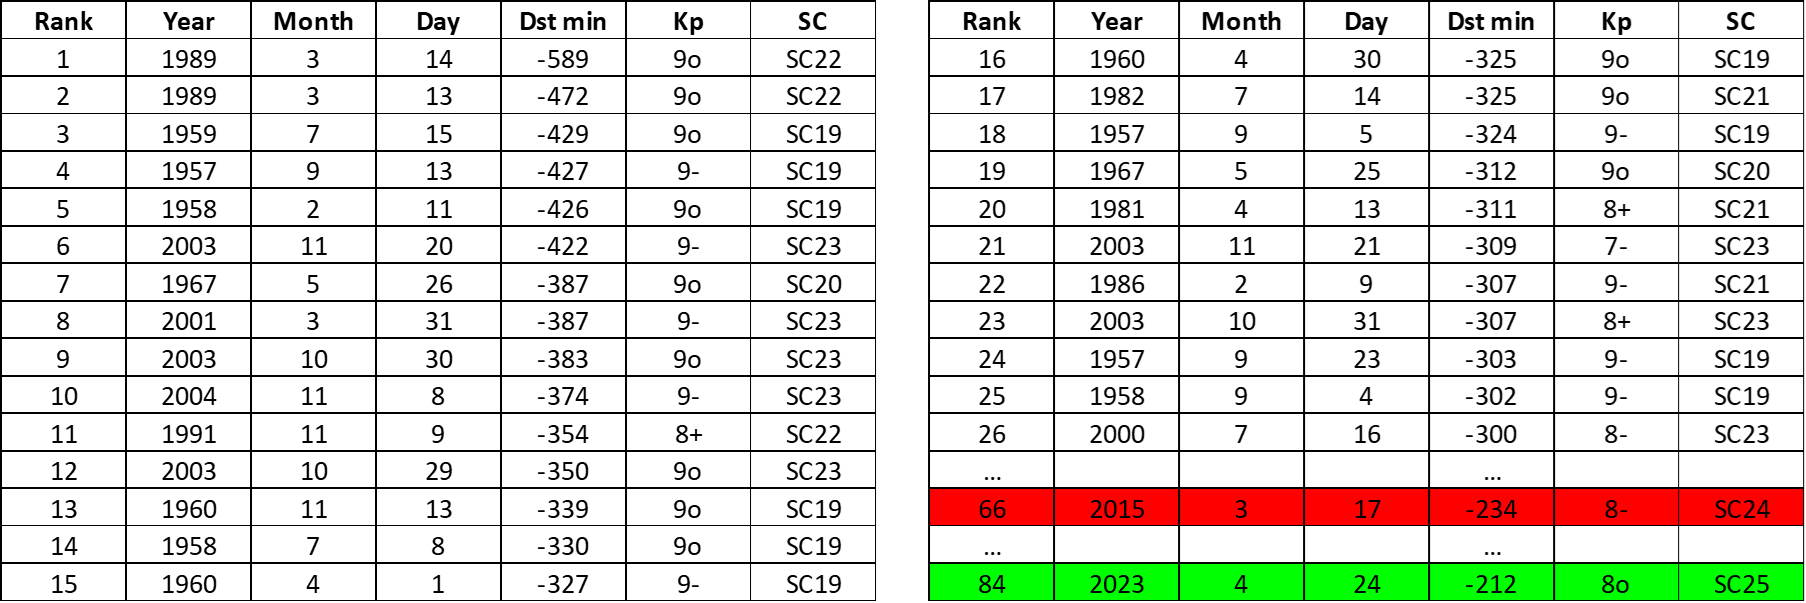
The table above gives all days with a minimum Dst of less than -300 nT, ranked by their intensity, and this since the records began early 1957. The value of -300 nT was chosen simply to avoid too large a table. Also the maximum Kp ***for that day*** has been added. There are no surprizes, with the famous March 1989 geomagnetic storm being the strongest of the last 65 years. Of the 26 days with a Dst equal to or less than -300 nT, 12 had an associated Kp of 9o, and 9 had a Kp of 9-. From the Kp point of view, there were 19 days with a Kp = 9o, 12 of which had an associated Dst of less than -300 nT and another 5 with a Dst between -250 and -300 nT. So, there's in general a good agreement between days with the strongest Kp (9o) and the strongest, most negative Dst (-300 nT or less). Some of the differences result from the interplanetary coronal mass ejection arriving by the end of a day, with Kp measuring immediate changes in the geomagnetic field, whereas the Dst index is influenced by the response from the ring current, reaching its minimum usually a few hours later. This may then be the next day, thus resulting in some day-to-day differences. Important also is that Dst and Kp are measuring influences from different geophysical sources. For example, the geomagnetic storm associated with the famous Apollo event in August 1972 reached a Kp of 9o, but a Dst of only -118 nT. In the table, the dominating presence of SC19 is noteworthy, representing about 36% in both listings. SC24 and SC25 are far behind. The highest entry for SC24 ranks only 66th in the Dst list and concerns the St-Patrick's day storm of 17 March 2015. SC25 has -so far- its highest entry ranked 84th, but of course it still has to go through most of its maximum and the whole declining phase, so there's a good chance it may produce stronger geomagnetic storms in the coming years.
Review of solar and geomagnetic activity
WEEK 1193 from 2023 Nov 06
Solar Active Regions and flares
Solar flaring activity over the past week was at low to moderate levels. There were 13 active regions (ARs) visible throughout the week and 46 C-class flares and 2 M-class flares were recorded. The largest flare was an M1.6-flare, with peak time 14:32 UTC on November 05 associated with NOAA AR 3480. The second largest flare was a M1.2-flare, with peak time 17:29 UTC on November 11, associated with NOAA AR 3477. Other active regions that contributed to the low-level flaring activity are NOAA AR 3472, NOAA AR 3477, NOAA AR 3480, NOAA AR 3483 and NOAA AR 3484. Notable active regions that emerged during the week are NOAA AR 3483 and NOAA AR 3484. The other regions stayed relatively quiet.
Coronal mass ejections
There were multiple filament eruptions during the week and two Coronal Mass Ejections (CMEs), with an impact at Earth.
The first was a full halo CME, which was detected at 11:24 UTC on November 09, in LASCO C2 data, with an estimated speed of around 700 km/s. This CME is associated with an eruption, observed at 10:49 UTC on November 09, in SDO/AIA 304 and 193 close to the centre of the visible solar disk. This was associated with a C2.6-flare, with peak time 11:18 UTC on November 09, associated with NOAA AR 3480 (beta) and arrived at Earth on November 12.
The second CME, was detected at 20:00 UTC on November 10, in LASCO C2 data. This CME is associated with an eruption, observed at 19:07 UTC on November 10, in SDO/AIA 193 in the south-west quadrant of the visible solar disk and was predicted to arrive at Earth on November 15.
Coronal Holes
A large negative polarity coronal hole passed the central meridian in the beginning of the week and the Earth was under the influence of a high-speed stream from this coronal hole from November 07 until November 10. A high latitude small positive polarity coronal hole, a low latitude small positive polarity coronal hole and an equatorial small negative polarity coronal hole passed the central meridian at the end of the week.
Proton flux levels
During the week, the greater than 10 MeV proton flux was enhanced due of the CME on November 09 but remained below the 10 MeV proton flux.
Electron fluxes at GEO
During most of the week the greater than 2 MeV electron flux measured by GOES-16 was above the 1000 pfu threshold value. The 24h electron fluence was at nominal levels in the first half of the week while rising and staying at moderate levels during the second part of the week.
Solar wind
In the beginning of the week the Earth was under the waning influence of 2 ICMEs from November 02 and 03. The interplanetary magnetic field decreased from 32 nT to 5 nT. The Bz reached a negative value of -22 nT. The solar wind speed values varied between 410 km/s and 580 km/s. In the middle of the week the Earth was under the influence of a high-speed stream from a large negative polarity coronal hole. The solar wind speed reached up to 750 km/s (ACE) and gradually decreased to slow solar wind conditions on November 10. At the end of the week the Earth was under the influence of an ICME from November 09. Its arrival was marked by a shock in the solar wind a 05:30 UTC on November 12. The solar wind jumped from 461 to 531 km/s and the interplanetary magnetic field from 2 to 5 nT. The speed later reached 600 km/s and the magnetic field 8 nT with Bz down to -6 nT. The phi-angle was mainly in the positive sector (directed away from the Sun) during the week.
Geomagnetism
The geomagnetic conditions over the past week reached major storm levels globally (Kp 7) and moderate storm levels locally (K Bel 6) at the start of the period due to the influence of 2 ICMEs. They then reached minor storm levels globally (Kp 5) and locally (Kp 5) on November 06, under the influence of a high-speed stream. They were quiet to unsettled for the rest of the week.
International Sunspot Number by SILSO
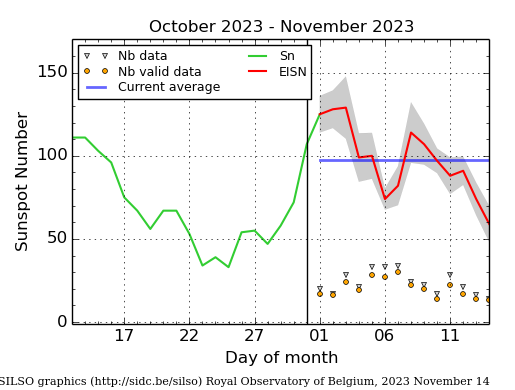
The daily Estimated International Sunspot Number (EISN, red curve with shaded error) derived by a simplified method from real-time data from the worldwide SILSO network. It extends the official Sunspot Number from the full processing of the preceding month (green line), a few days more than one solar rotation. The horizontal blue line shows the current monthly average. The yellow dots give the number of stations that provided valid data. Valid data are used to calculate the EISN. The triangle gives the number of stations providing data. When a triangle and a yellow dot coincide, it means that all the data is used to calculate the EISN of that day.
PROBA2 Observations
Solar Activity
Solar flare activity fluctuated from low to moderate during the week.
In order to view the activity of this week in more detail, we suggest to go to the following website from which all the daily (normal and difference) movies can be accessed: https://proba2.oma.be/ssa
This page also lists the recorded flaring events.
A weekly overview movie can be found here (SWAP week 711). https://proba2.sidc.be/swap/data/mpg/movies/weekly_movies/weekly_movie_2023_11_06.mp4
Details about some of this week's events can be found further below.
If any of the linked movies are unavailable they can be found in the P2SC movie repository here https://proba2.oma.be/swap/data/mpg/movies/
Saturday Nov 11
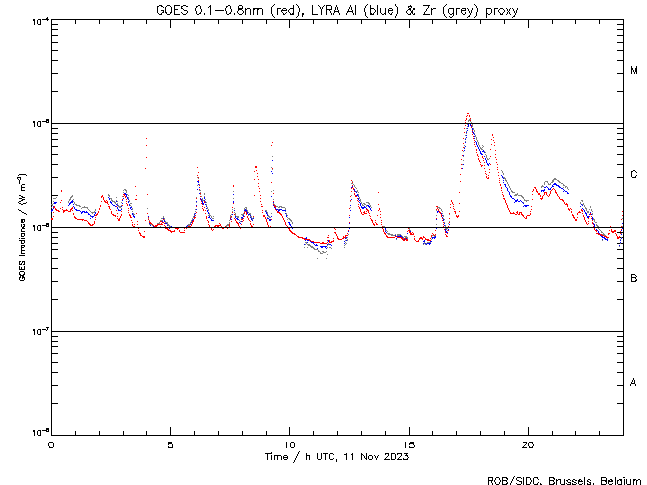
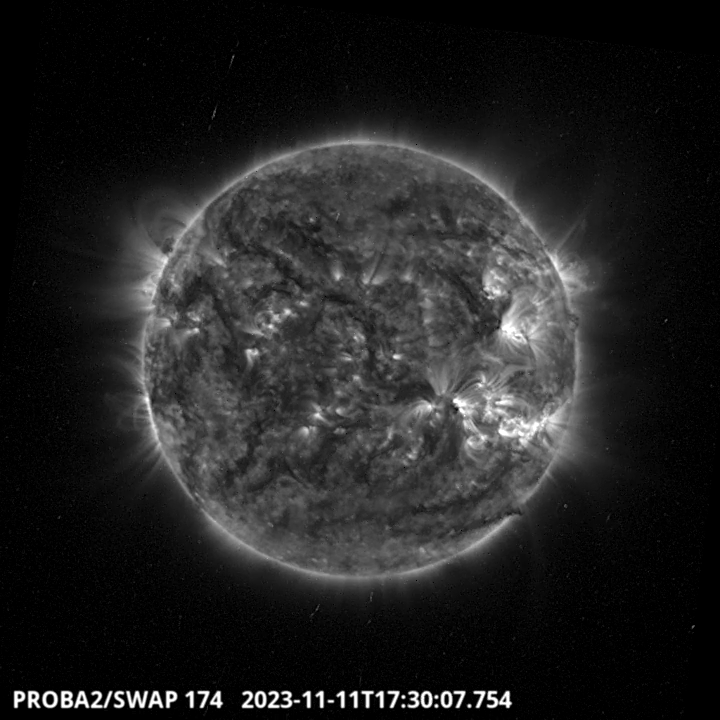
The largest flare of this week, an M1.2, was observed by LYRA (top panel) and SWAP (bottom panel). The flare peaked on 2023-Nov-11 around 17:30 UT. It occurred in the south west hemisphere and it originated from NOAA AR3477. Find a SWAP movie of the event here. https://proba2.sidc.be/swap/movies/20231111_swap_movie.mp4
Noticeable Solar Events
| DAY | BEGIN | MAX | END | LOC | XRAY | OP | 10CM | TYPE | Cat | NOAA |
| 11 | 1701 | 1729 | 1745 | S18W58 | M1.2 | SF | 37 | 3477 |
| LOC: approximate heliographic location | TYPE: radio burst type |
| XRAY: X-ray flare class | Cat: Catania sunspot group number |
| OP: optical flare class | NOAA: NOAA active region number |
| 10CM: peak 10 cm radio flux |
Geomagnetic Observations in Belgium
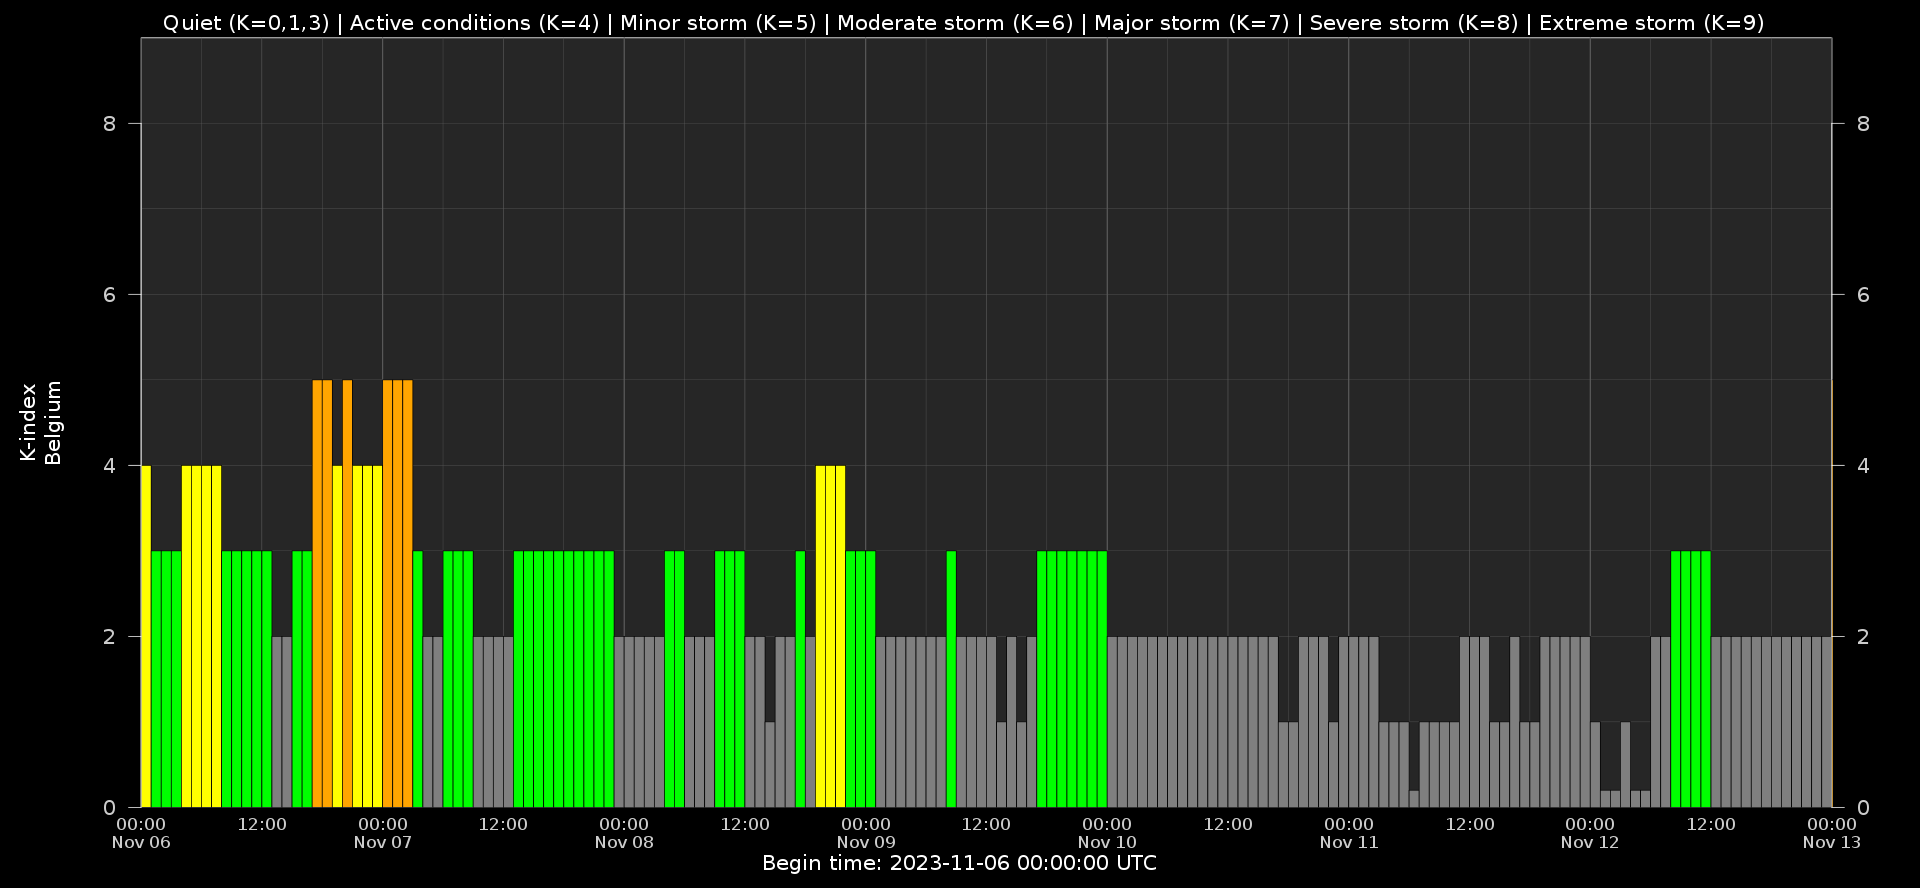
Local K-type magnetic activity index for Belgium based on data from Dourbes (DOU) and Manhay (MAB). Comparing the data from both measurement stations allows to reliably remove outliers from the magnetic data. At the same time the operational service availability is improved: whenever data from one observatory is not available, the single-station index obtained from the other can be used as a fallback system.
Both the two-station index and the single station indices are available here: http://ionosphere.meteo.be/geomagnetism/K_BEL/
Review of Ionospheric Activity
NEW! The time series below illustrates (in green) the VTEC deviation from normal quiet behaviour.
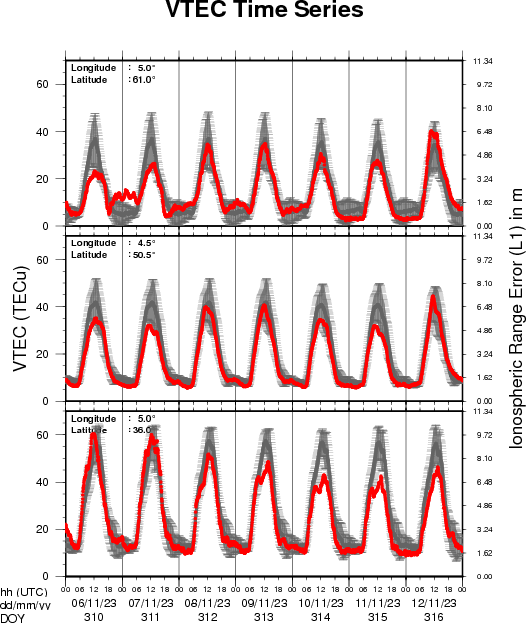
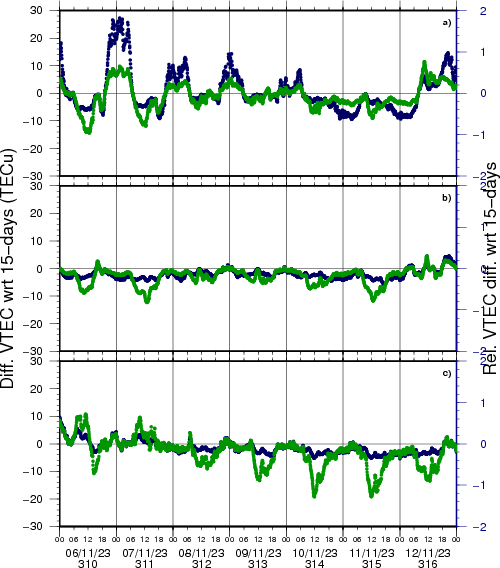
VTEC time series at 3 locations in Europe from 6 Nov 2023 till 12 Nov 2023
The top figure shows the time evolution of the Vertical Total Electron Content (VTEC) (in red) during the last week at three locations:
a) in the northern part of Europe(N 61deg E 5deg)
b) above Brussels(N 50.5deg, E 4.5 deg)
c) in the southern part of Europe(N 36 deg, E 5deg)
This top figure also shows (in grey) the normal ionospheric behaviour expected based on the median VTEC from the 15 previous days.
The time series below shows the VTEC difference (in green) and relative difference (in blue) with respect to the median of the last 15 days in the North, Mid (above Brussels) and South of Europe. It thus illustrates the VTEC deviation from normal quiet behaviour.
The VTEC is expressed in TECu (with TECu=10^16 electrons per square meter) and is directly related to the signal propagation delay due to the ionosphere (in figure: delay on GPS L1 frequency).
The Sun's radiation ionizes the Earth's upper atmosphere, the ionosphere, located from about 60km to 1000km above the Earth's surface.The ionization process in the ionosphere produces ions and free electrons. These electrons perturb the propagation of the GNSS (Global Navigation Satellite System) signals by inducing a so-called ionospheric delay.
See http://stce.be/newsletter/GNSS_final.pdf for some more explanations ; for detailed information, see http://gnss.be/ionosphere_tutorial.php
The SIDC Space Weather Briefing
The Space Weather Briefing presented by the forecaster on duty from November 6 to 12. It reflects in images and graphs what is written in the Solar and Geomagnetic Activity report: https://www.stce.be/briefings/20231113_SWbriefing.pdf

If you need to access the movies, contact us: stce_coordination at stce.be
Activities at the STCE
Check out our activity calendar: activities and encounters with the Sun-Space-Earth system and Space Weather as the main theme. We provide occasions to get submerged in our world through educational, informative and instructive activities.
If you want your event in our calendar, contact us: stce_coordination at stce.be
* Nov 18-19, E-SWAN Space Weather School: data, models and services, by the STCE, Toulouse, France
* Nov 24, Webinar: Meet EPOS-BE, ROB, online
* Nov 26, STCE @ Dag van de Wetenschap, Planetarium, Brussels
* Dec 4-6, STCE course: Space Weather impacts on ionospheric wave propagation - focus on GNSS and HF, Brussels, Belgium - Registrations are open
* Jan 22-24, 2024, STCE Space Weather Introductory Course, Brussels, Belgium - Registrations are open
* Jan 25, 2024, post-Space Weather Introductory Course, by JMG and MeteoWing, place TBD - registration is included in the Jan SWIC
* Mar 4-5, 2024, STCE Space Weather Introductory Course, focus n aviation, online - Registrations will open soon
* Apr 22-24, 2024, STCE Space Weather Introductory Course, Brussels, Belgium - Registrations will open soon
Check: https://www.stce.be/calendar